Run the sample
If you did not build the sample yourself, you must import the completed sample application before continuing.
If you originally accessed this sample directly from the Business Process Management Samples website,
you will see a Download link on the menu above. Click this link and follow
the instructions on the Download page.
Otherwise, return to the Business Process Management Samples & Tutorials Gallery
and select the Import link for this sample.
Running the sample includes four steps:
- Enable Common Event Infrastructure logging in the administrative console.
- Run a test with the sample human task.
- Run a test with the sample snippet.
- View the created events using Common Based Event Browser.
Enable Common Event Infrastructure logging in the administrative console
Ensure that your WebSphere Process Server unit test environment is properly configured in WebSphere Integration Developer and that a
WebSphere Process Server v7.0 instance is up and running. Launch the server's administrative console by right-clicking on the server entry in the
Servers panel and then selecting Administration > Run administrative console from the appearing context menu.
Sign in using your username and password and wait for the Welcome screen to be loaded. Expand the Servers section on the left side
as well as the contained Server Types subsection and click on the included link labeled WebSphere application servers. In the main panel, a list of
all available application servers will be displayed. Click on the name of the server representing your WebSphere Process Server unit test system.
Configuration details of the server will be displayed.
The configuration is divided into two columns containing several subject areas. Look for area Business Integration in the right column.
Under Business Integration, expand section Business Process Choreographer to find a link to Business Flow Manager.
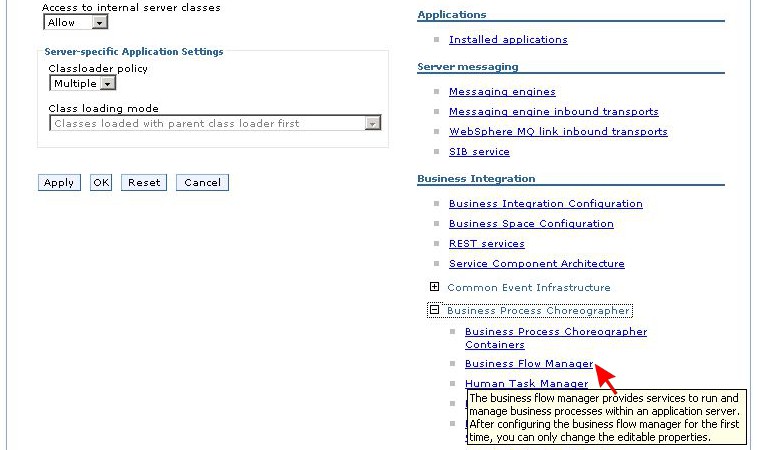
Follow the link to open the Business Flow Manager configuration panel. There is a small framed area titled State Observers with two checkboxes in it. Make sure the checkbox Enable Common Event Infrastructure logging is checked. Then scroll to the bottom of the page and click the Apply button to apply your changes to the configuration.
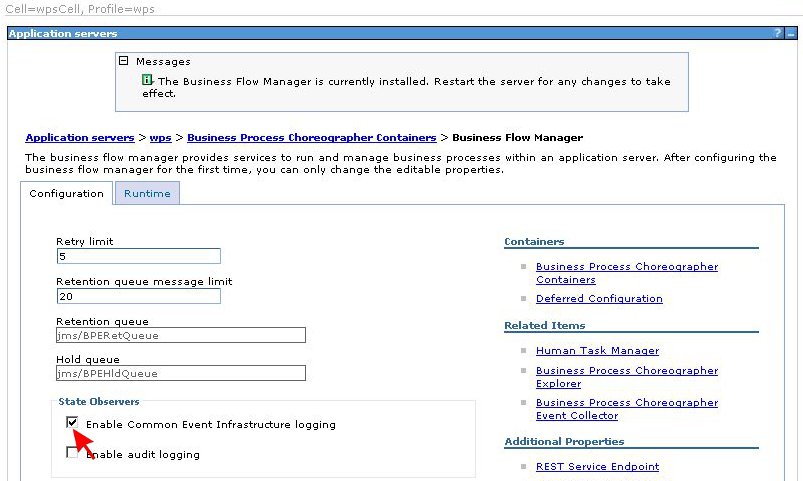
On the right side, in subject area Related Items, a link to Human Task Manager should be available. Click on that link to switch to the Human Task Manager configuration panel. A frame titled State Observers can be found there as well. Again, make sure the checkbox Enable Common Event Infrastructure logging is checked and conclude your review by pressing the Apply button at the bottom of the page.
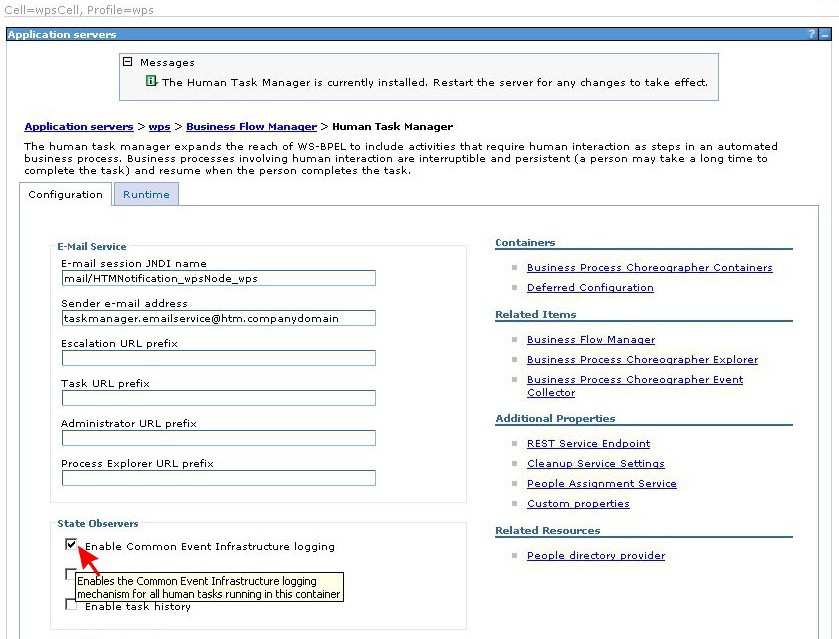
At the top of the page, a framed message will appear stating that changes have been made to the local configuration. Click on the Save link that is provided along with the message to also update the master configuration. Afterwards, log out of the administrative console and restart your WebSphere Process Server unit test system.
Run a test with the sample human task
Open the assembly diagram for module TestModule. Right-click on the included component SimpleProcess and select
Test Component from the appearing context menu. The integration test client will start and open a test editor.
Keep the defaults for all values given in the Detailed Properties section of the editor. In the Initial request parameters section,
set the value for automaticallyGenerated to false. This setting will cause the business process to make use of the included
human task.

Invoke the test by clicking on the green arrow button ![]() at the top of the Events section.
An active WebSphere Process Server instance to be used as unit test environment is required to proceed at this point.
at the top of the Events section.
An active WebSphere Process Server instance to be used as unit test environment is required to proceed at this point.
The test run will start but not finish as the human task interrupts the processing to request manual input.
Right-click on the active WebSphere Process Server instance in the Servers tab and select Launch > Business Process Choregrapher from
the context menu that pops up. Log in to Business Process Choreographer using appropriate credentials. When the application has finished loading,
click on My To-dos in the Task Instances section of the navigation panel on the left side. A list of tasks assigned to you should be
displayed in consequence.

Put a check mark in front of the pending human task in the list and then press the Work On button. Details about the task message will be displayed. The text field next to output variable luckyNumber is editable, so replace the given value of 0 with another number such as 44. Afterwards, press the Complete button to submit your update.

Log out of Business Process Choreographer and switch back to the test editor window. You can see in the Events section that the the previously started test run was continued and that it has completed succesfully in the meantime. In the Return parameters section on the right side, the value of output variable lucky number is returned as the number that you assigned to the variable in Business Process Choreographer.

Run a test with the sample snippet
After the first test run, a second run can easily be intiated by adding another Invoke statement in the Events section of the test editor.
Simply click on the corresponding icon button ![]() at the top of the section.
at the top of the section.
For the second test cycle, set the value for automaticallyGenerated to true in the Initial request parameters section. That way,
the business process will use the included snippet instead of the human task. Start the test run using the green arrow button. As the snippet
calculates numbers automatically, the processing will only take a few moments. You will see a random value between 0 and 100 being returned for
output variable luckyNumber.

View the created events using Common Based Event Browser
During the previous two test runs, several Common Based Events were generated. In order to view those events, the application Common Based Event Browser
can be used.
Right-click on your WebSphere Process Server unit test system in the Servers tab of WebSphere Integration Developer and select
Launch > Common Based Event Browser from the context menu. Sign in to the application using your username and password.
The start page of Common Based Event Browser contains a form that can be used to retrieve events from the Common Event Infrastructure database. On the left side,
the number of events currently found can be seen.

Since only a few events have been created, a sophisticated search or filtering is not required in this sample. Open the event view All Events by following the corresponding link provided in the navigation panel on the left side. A listing of all available events will be shown in the form of a table.

Browse the table columns and click on the given time stamps to access further details about the listed events. Note that some events originate from the human task
in SimpleProcess while others were generated in the process snippet.
Test different event views by clicking on the other links in the navigation panel. When you are done with your review, log out of Common Based Event Browser.
Please note that Common Based Event Browser facilitates the browsing of events but does not enable you to delete any of them. That can be done using a command-line utility
named eventpurge that is delivered along with WebSphere Process Server v7.0. For more details, please refer to the
WebSphere Process Server v7.0 Information Center paragraph on the eventpurge command-line utility.