Now you will create a business dashboard. You will add views to the dashboard and configure them.
- Open the WebSphere® Integration Developer dashboard manager.
- Select the Dashboards tab and then the Manage tab.
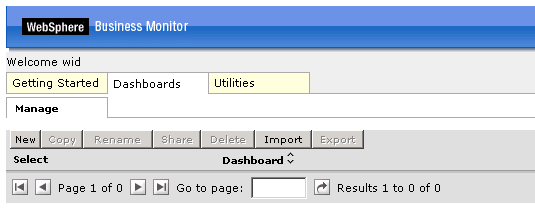
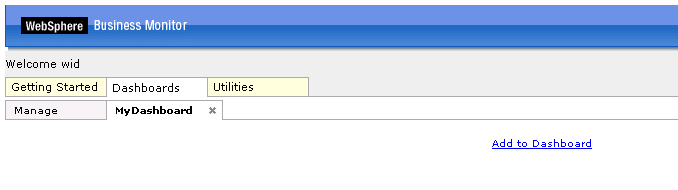
- Click New and then enter a name for the
new dashboard, for example MyDashboard. Click OK. Note: The contents in the views in the dashboards will depend on the actual data that was entered into the forms for the orders.
- Select the Dashboards tab and then the Manage tab.
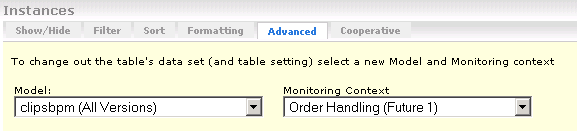
- Add the instances view to the business dashboard so that you can
view the process instances:
- Click the Advanced tab and select model clipsbpm
(All Versions).
- Click the Show/Hide tab and then click >> to
copy all of the metrics from the available list to the selected list.
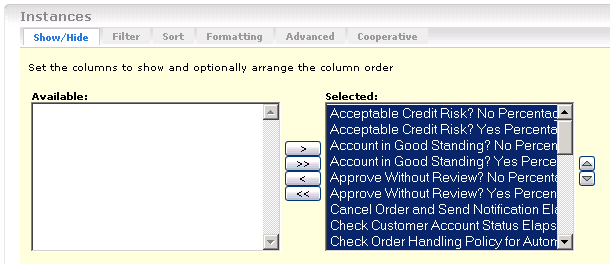
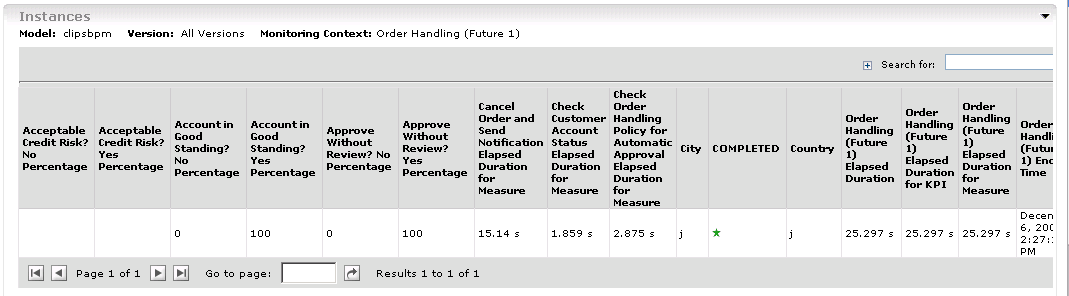
- Click OK. You will see a list of monitoring
context instances for the orders entered.
- Click the Advanced tab and select model clipsbpm
(All Versions).
- Add the Human Tasks view so that you can monitor human activity
in the process instances.
- Select the Show/Hide tab and then click >> to
copy all of the metrics from the available list to the selected list.
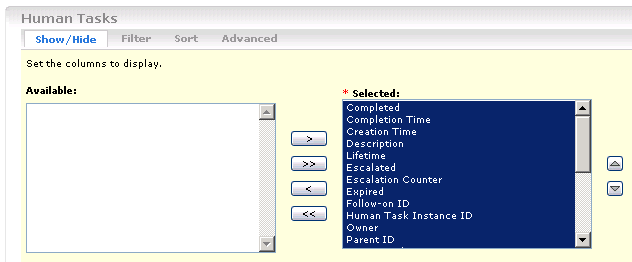
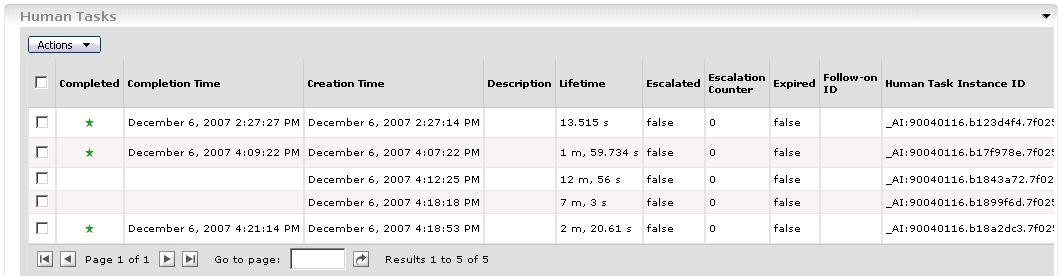
- Click OK. The Human Tasks view is shown
in the following figure.
- Select the Show/Hide tab and then click >> to
copy all of the metrics from the available list to the selected list.
- Add the dimensions view and configure it to show human task information
in aggregate form:
- From the Available Dimensions list, select Task
Name Dimension and click the right direction arrow (
 ) next to the Row Dimensions
selected list.
) next to the Row Dimensions
selected list. - Select Task Owner Dimension and click
the right directional arrow () next to the Column Dimensions selected list.
- Select Measures and click the right direction
arrow () next to the Page Dimensions text box.
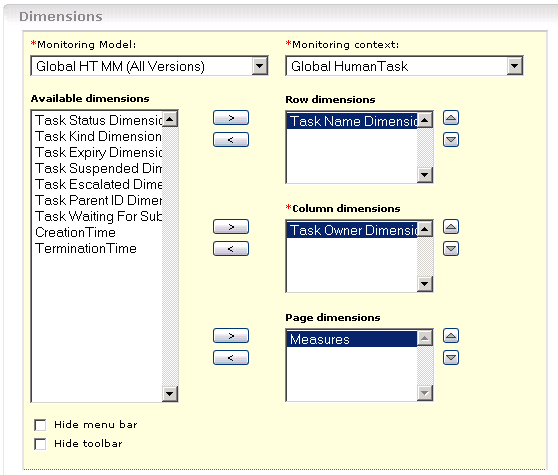
- Click OK. The Dimensions view displays
the instances count by task name and task owner.
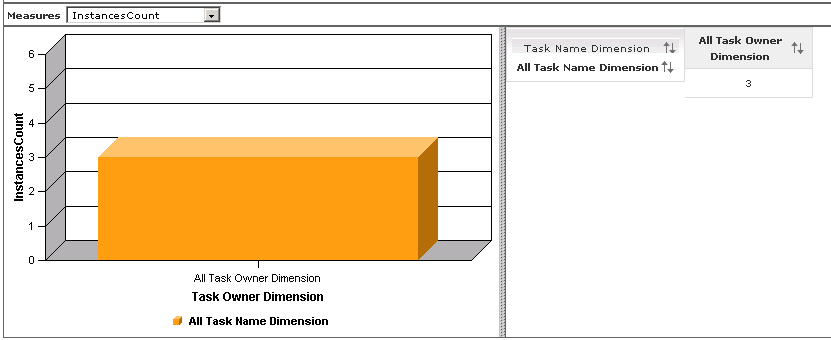
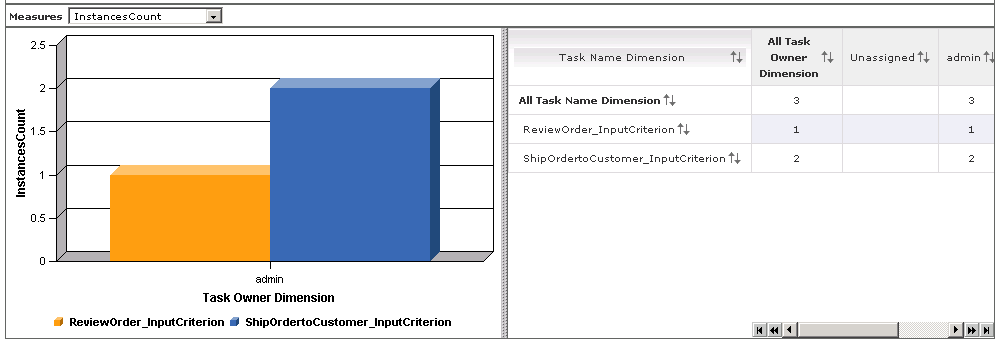
- Optional. You can double-click All Task Name Dimension and All
Task Owner Dimension and drill down to more detailed data. This
is performed in the vast majority of cases.
- From the Available Dimensions list, select Task
Name Dimension and click the right direction arrow (
- Next you will export the monitored values to WebSphere Business
Modeler to improve simulation results and assumptions made in the process
model such as path percentages. Only completed process instances are exported,
therefore, ensure that you have completed some process instances before you
export the values.
- Select the clipsbpm model and then click Export. The data exported as XML opens in a browser window.
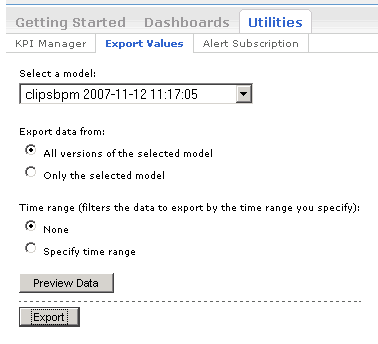
- Select the clipsbpm model and then click Export.
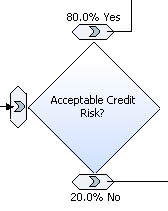
- In the project tree, double-click the process to open the process
diagram. Examine the process diagram to see the updated decision percentages
for the six simple decisions.
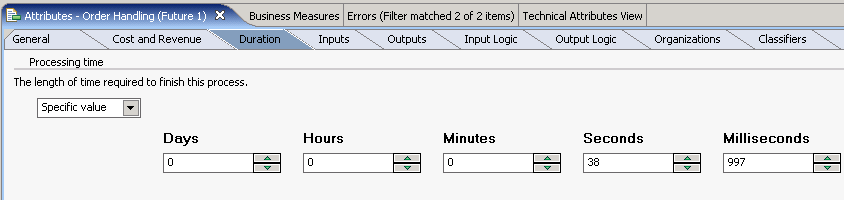
- Examine the updated process duration time by clicking the background
of the process diagram. Click the Attributes tab and
then the Duration tab.
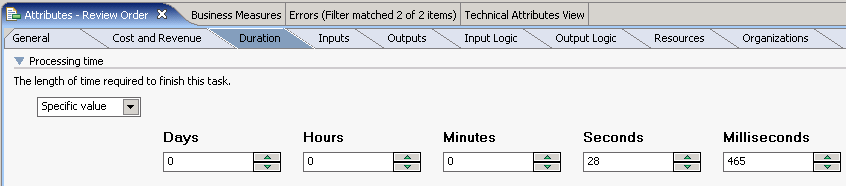
- Examine the updated task duration times by clicking one of the
tasks in the process diagram. Click the Attributes tab
and then the Duration tab. Next click the icon for 'Processing
time'.
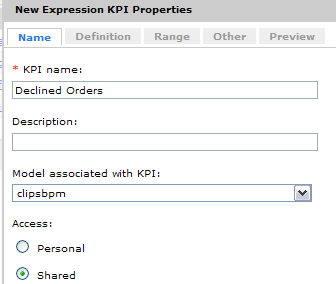
- Add a dynamic KPI to the dashboard.
- In the Model field, select clipsbpm.
In the Version field, select Latest.
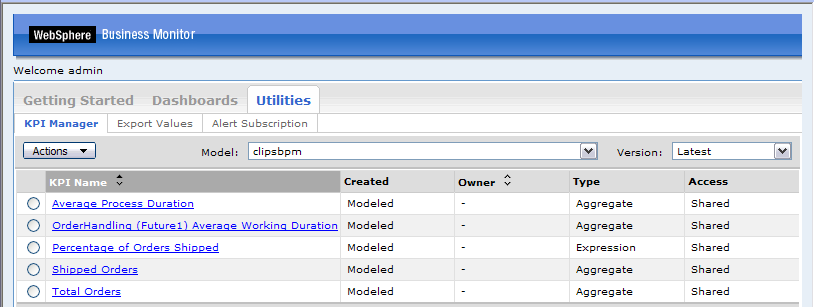
- For Access, select Shared so that other
users can see the new KPI.
- In the Model field, select clipsbpm.
In the Version field, select Latest.
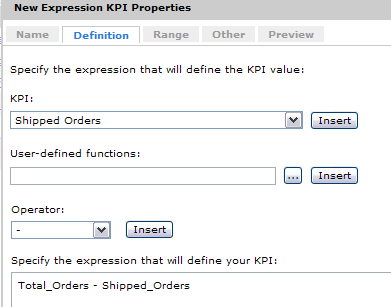
- Create the expression for the new Declined Orders KPI.
- Use the KPI drop down list again to select Shipped
Orders and click Insert.
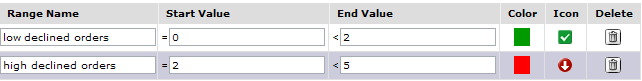
- Add two rows as shown below by clicking Add row and
entering the following values and selecting the following colors. Click OK.
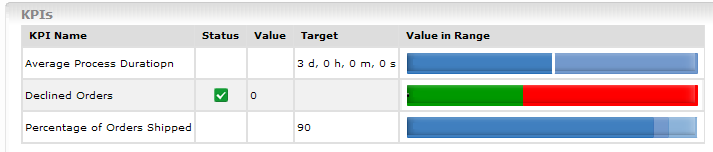
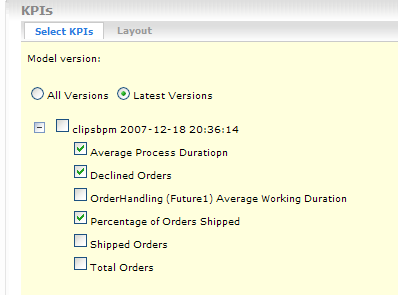
- On the KPI View, click Personalize, expand
clipsbpm and select Declined Orders (the newly created
KPI). Click OK. The new KPI view includes the dynamic
KPI that just built.
- Use the KPI drop down list again to select Shipped
Orders and click Insert.
The new KPI view includes the dynamic KPI that just built.