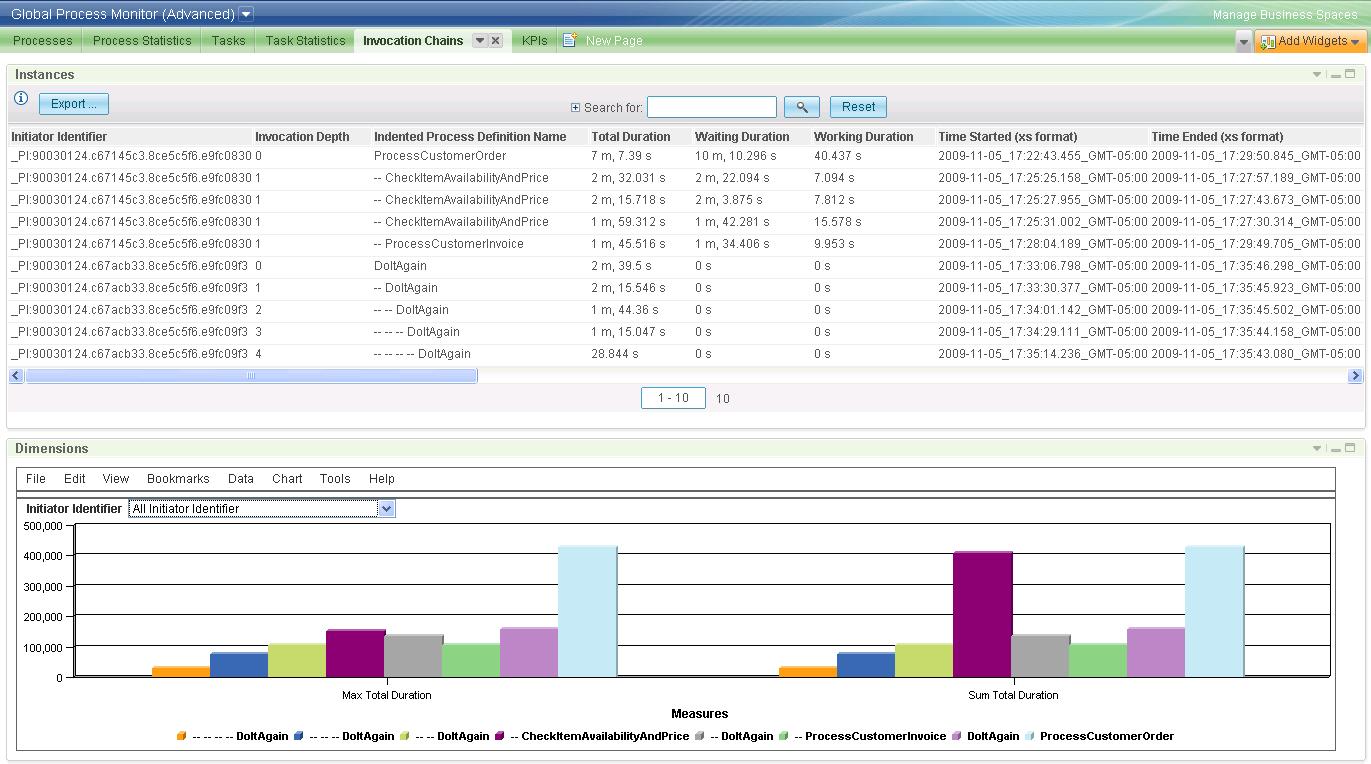
The tabular view at the top of this page (upper part of Figure 16) is simply a different visualization of the Process Execution monitoring contexts. In contrast to their rendering on the Processes page,
Hence, all process executions that were called directly or indirectly from the same top-level execution are grouped together,
and by reading downwards within a group you see the invocation sequence.
The process definition names of top-level executions are shown without indentation in the Indented Process Definition Name column and their Invocation Depth is 0.
You can see two such top-level executions in Figure 16, with identifiers
_PI:90030124.c67145c3.8ce5c5f6.e9fc0830 and _PI:90030124.c67acb33.8ce5c5f6.e9fc09f3.
First level sub-process executions have Invocation Depth 1 and one indentation;
Second level sub-process executions have invocation depth 2 and two indentations; and so on.
You can see that execution _PI:90030124.c67145c3.8ce5c5f6.e9fc0830 of ProcessCustomerOrder invoked CheckItemAvailabilityAndPrice three times and then ProcessCustomerInvoice once.
From the Time Started and Time Ended timestamps you can also tell that the three CheckItemAvailabilityAndPrice executions ran in parallel,
while the ProcessCustomerInvoice execution started about 7 seconds after the last of those finished.
In the lower part of the table, the DoItAgain process demonstrates that it would be a mistake to associate a fixed Invocation Depth with a process definition (in other words, it would be a mistake to jump to conclusions like "a main process always runs top-level"; "a sub-process always runs one level down"; etc.). The DoItAgain process called itself recursively, and hence its executions appear at various levels of Invocation Depth.
Below the tabular view, a dimensional widget displays the sum and the maximum total duration of all executions of a process, at each invocation level at which it occurs. The idea of that is to quickly show "where the time is spent". This graph will be discussed in more detail shortly, in the context of Figure 17.
|
| Figure 16: An initial view of the Invocation Chains page |
In the graph in the lower part of Figure 16 the durations of all process runs are shown in aggregation,
but you can zoom in on a particular one by selecting its Initiator Identifier from the pull-down menu.
The result may look like Figure 17, where only the times for process runs kicked off by the top-level execution
_PI:90030124.c67145c3.8ce5c5f6.e9fc0830 are visualized in the bar graph.
The graph shows both the maximum and the sum of the execution times for each sub-process in order to account for parallel and sequential execution: For sub-processes that run in parallel, the one taking the longest determines how much of the parent process's execution time is consumed by that sub-process. For sub-processes that run sequentially (for example, repeatedly in a loop), the sum of their execution times determines how much of their parent's execution time they account for. Hence, for ProcessCustomerOrder the right part of Figure 17 is not the most meaningful visualization. In fact, the total time spent in sub-processes CheckItemAvailabilityAndPrice and ProcessCustomerInvoice exceeds the time spent in the main process. This is another indicator that CheckItemAvailabilityAndPrice executions ran in parallel—as you already know from inspecting their start and end times. The left part of Figure 17 shows that slightly more than half of the total time of ProcessCustomerOrder is consumed by its sub-processes, while the remainder is spent in the top-level process itself. You can follow the Process Execution Step drill-down link (off to the right in the upper part of Figure 17) to see the step level detail and investigate where in ProcessCustomerOrder that time is being spent.
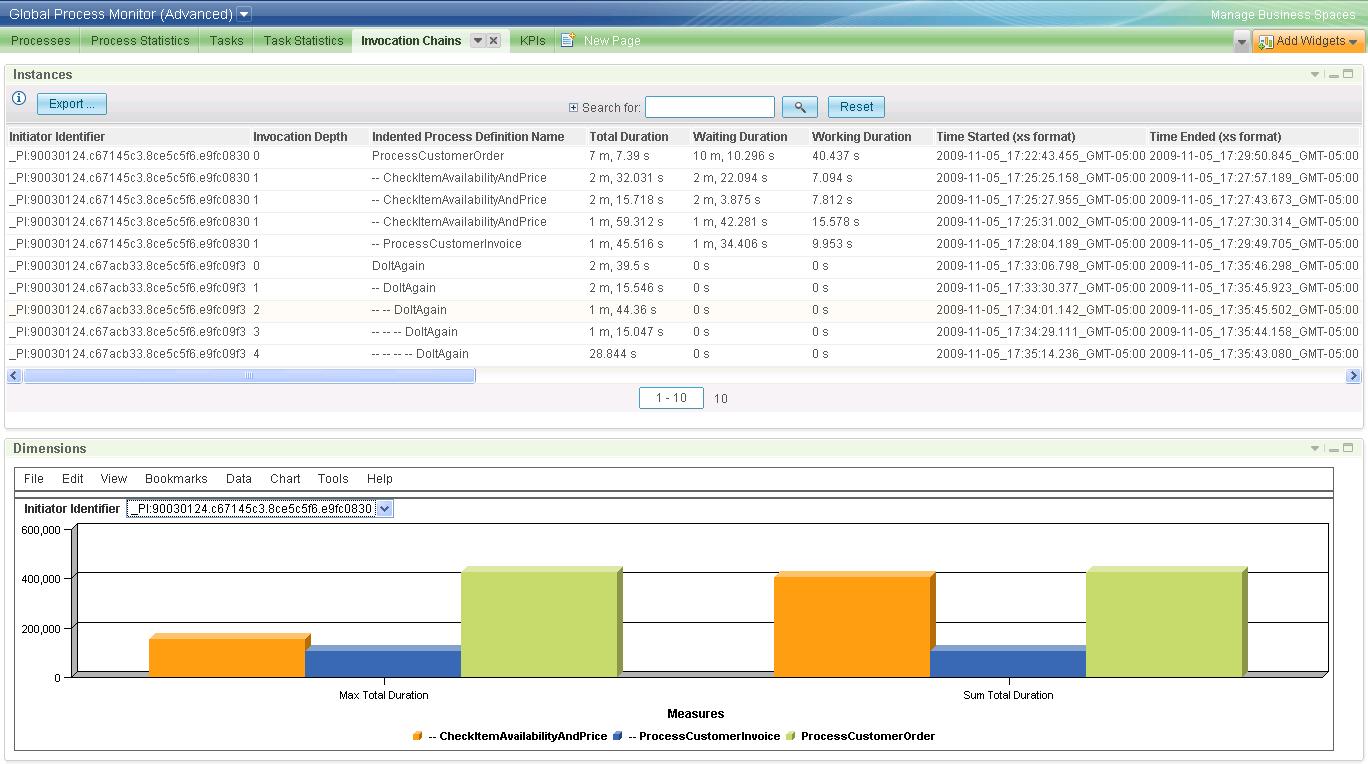 |
Figure 17: Same view as Figure 16 after selecting top-level process run _PI:90030124.c67145c3.8ce5c5f6.e9fc0830 from the pull-down menu |
To reduce the number of process executions shown in the tabular view (upper parts of Figure 16 and Figure 17) you must set up a filter. In the configuration menu for the Instances widget, choose the Filter tab, and enter one or more conditions. An example is shown in Figure 18, where we chose to filter on the name of the DoItAgain process.
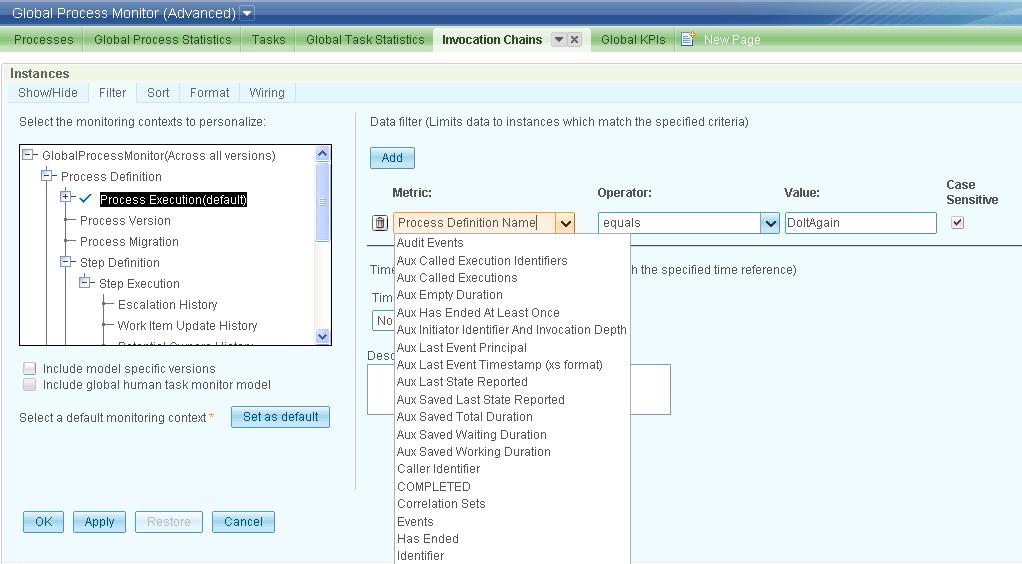 |
| Figure 18: Setting a filter in order to down-scope the process executions shown in the tabular view |
With the filter in effect, the dashboard looks like Figure 19.
Note that we also picked the Initiator Identifier _PI:90030124.c67acb33.8ce5c5f6.e9fc09f3 from the pull-down menu of the dimensional graph in order to get a matching dimensional view.
There is no automatic synchronization between the two widgets on this page.
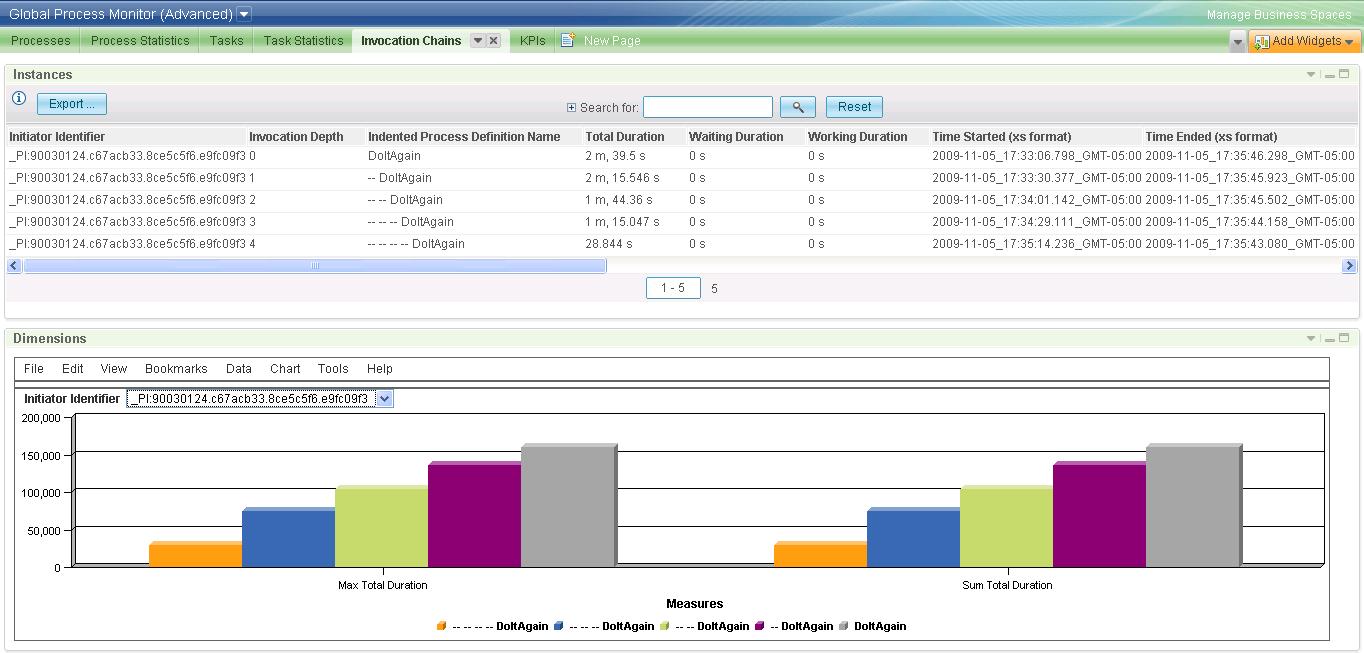 |
Figure 19: The dashboard after adding a filter for process name DoItAgain
and selecting Initiator Identifier _PI:90030124.c67acb33.8ce5c5f6.e9fc09f3 in the dimensional view |
Most of the metrics shown in the tabular view on this page have already been explained in the table for Process Execution MCs on The Processes Page, but as the selected set and the ordering is slightly different, they are listed again below. In the advanced dashboard view, the last column displays an auxiliary metric (Aux Called Execution Identifiers) which holds the execution identifiers of the sub-processes called by the process execution represented by this row. They can be used to reconstruct the exact calling sequence.
| ||||||||||||||||||||||||||||||||||||||||||||||||||||||||||||||||||||||||||||||||||||||||
| Table 23: The metrics of a Process Execution monitoring context | ||||||||||||||||||||||||||||||||||||||||||||||||||||||||||||||||||||||||||||||||||||||||
The views that can be reached via drill-down links are identical to the corresponding views on the Processes page. The Comment column above has hyperlinks to their descriptions.