This document explains the major steps required to import the FDL file;generate, augment, and deploy the monitoring model; and show the results on a Web-based dashboard. The following diagram summarizes the sample scenario.
Business flow:
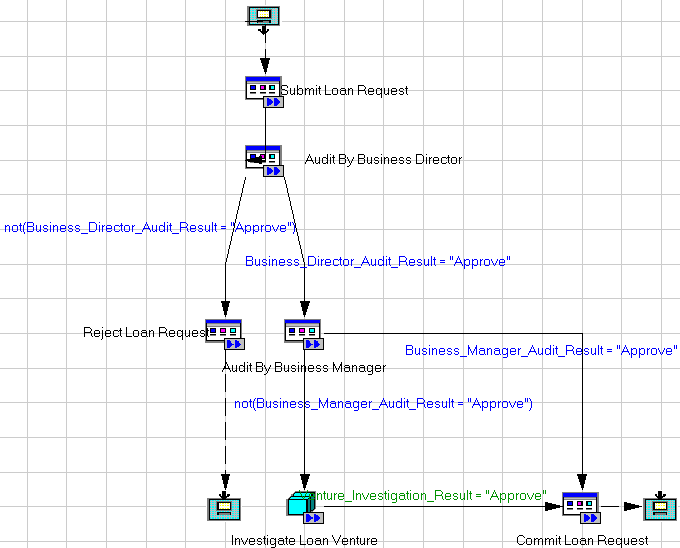
The following diagram shows the monitored business flow.
Root Process: Loan Request Process
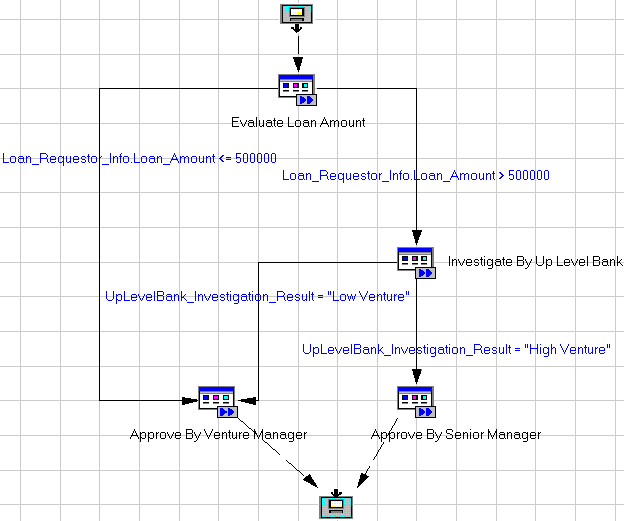
Block: Investigate Loan Venture
Data structure used in the FDL:
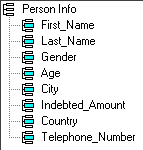
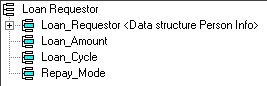
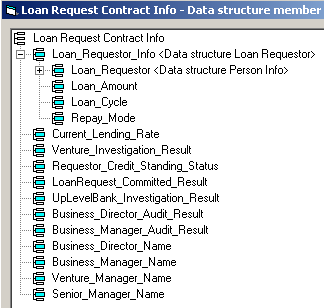
There are three types of data structures: Person Info, Loan Requestor, and Loan Request Contract Info. These data structures are used as the input or output data of every activity. Loan Requestor contains a member type of Person Info and Loan Request Contract Info contains a member type of Loan Requestor.
Person Info:
Loan Requestor:
Loan Request Contract Info:
Below are use cases of this scenario.
For the root process - Loan Request Process:
(The loan request needs venture investigation) The loan requestor submits the loan request and waits for the business director's approval. If the business director approves the loan request, the loan requestor continues waiting for the business manager's audit result. If the business manager does not approve the loan request, the venture of this loan request must be investigated and the process goes to block "Investigate Loan Venture". The "Commit Loan Request" activity will be executed only if the investigation result of venture is "Approve" or the block will be executed circularly.
For the block involved in the root process - Investigate Loan Venture:
(The loan request amount does not exceed the limitation) First, evaluate the loan amount. If the amount does not exceed the limitation ($500000), go to activity "Approve By Venture Manager". The block ends if the venture manager approves the loan request or goes to "Evaluate Loan Amount" activity again.
Fine-Grained setting:
Currently, only monitoring with MQ Audit is supported. The setting of MQ audit in this scenario is showed as follows. You can find a detailed explanation of how to set the MQ audit in the IBM WebSphere MQ Workflow Administration Guide.
|
UPDATE GROUP 'FMCGRP' DESCRIPTION "Default system group" // Set the MQ audit queue AUDIT_QUEUE_NAME 'FMC.FMCGRP.AUDITQ' AUDIT_QUEUE_MANAGER_NAME 'FMCQM' // ----------------------------- RELATED_DOMAIN 'DOMAIN' OPERATION SYSTEM_QUALIFIER "FMC" END 'FMCGRP' |
After enabling the audit, the fine-grained events setting is important to reduce the impact on performance of the monitored process. The following snippet is how we set fine-grained events for this sample. You can find a detailed explanation of how to set fine-grained events in the IBM WebSphere MQ Workflow Administration Guide.
|
PROCESS 'Loan Request Process' ( 'Loan Requestor', 'Loan Request Contract Info' ) CATEGORY 'Comsumable Loan Process' DO NOT PROMPT_AT_PROCESS_START FILTER AUDIT_TO_MQ AUDIT_FILTER_MQ "21000 21032 21017 21018 21025 21015 21016 21006 21007 21011" ...... |
The enabled events in this scenario are typical events and always needed for monitoring. The following table gives a description of each event.
| Event Code | Event Description | Condition of being emitted |
| 21000 | Process Started | When a process is created and started. |
| 21017 | Process Created |
When a process is created |
| 21018 | Process Created and Started | When a process is created and started. Start and create actions are done together. |
| 21025 | Process Ended Normally and Deleted | When a process ends normally without exceptions |
| 21015 | Block Started | When a block is started |
| 21016 | Block Ended |
When a block ends and exits |
| 21006 | Activity Ready | When an activity is ready, but not started. |
| 21007 |
Activity Started |
When an activity is started |
| 21032 | Activity Implementation Completed | When an activity or a block is implemented |
| 21011 | Activity Ended Normally | When an activity ends normally without exception |
The main steps for this sample are:
1. Import the FDL file to a project using FDL to Monitor Model Utility for WebSphere MQ Workflow and WebSphere Integrated DeveloperList of system and software required to run this sample:
1. WebSphere MQ Workflow3.6 with Service Pack 6 and SupportPac WA 6.1
2. WebSphere Business Monitor v6.1.0 including web dashboard and Alphablox installed
3. WebSphere Integrated Developer version 6.1.0 including Monitoring Model Editor and FDL to Monitor Model Utility for WebSphere MQ Workflow installed
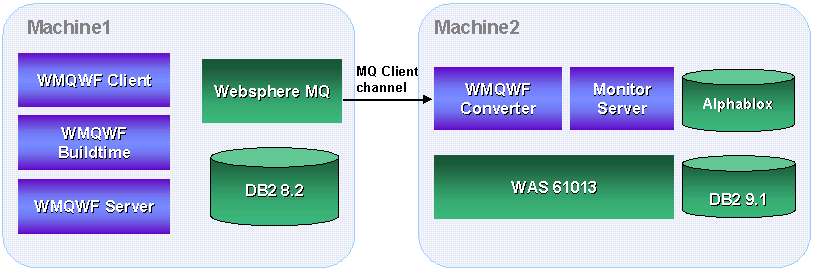
The figure below shows the topology of this sample senario.
1. WebSphere MQ Workflow is installed on machine 1.
2. WebSphere Business Monitor server and the SupportPac for WebSphere Application Server version 6.1 (displayed as "WMQWF Converter" in the following figure) are installed on machine 2.
3. After all components are started, the WebSphere MQ Workflow Converter running on system 2 fetches events from the message queue located on machine 1 through an MQ client channel.