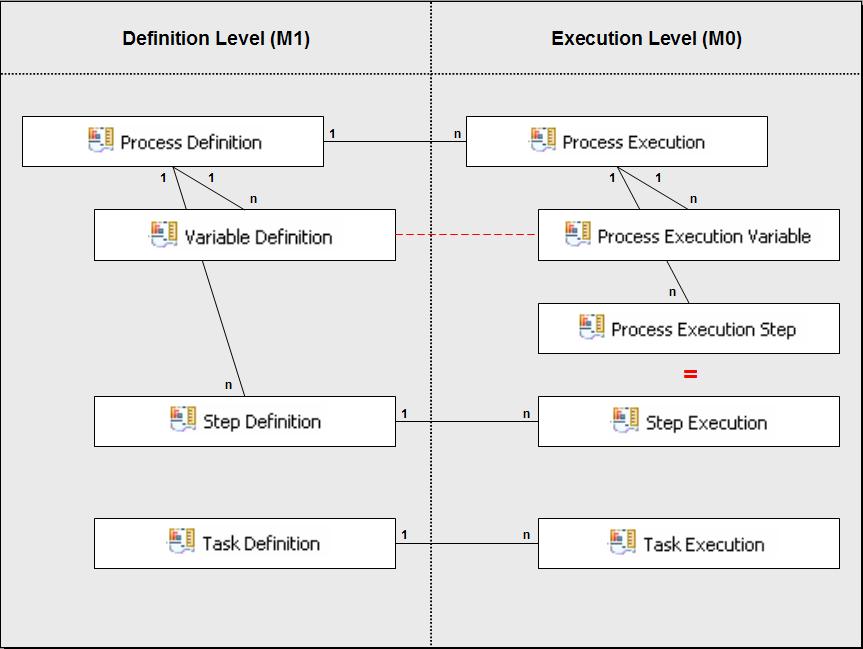
The principal structure of the monitor model is shown in Figure 1.
|
| Figure 1: Global Process Monitor Model — Overall Structure |
Here is the reasoning that led to this structure: We would like to monitor processes, along with their steps and their variables, both at the definition level (M1) and at the execution level (M0). A process definition can have many step definitions. It also can have many executions. A process execution can be broken down into step executions, but each step execution is also a logical child of a step definition. Hence, the perfect monitoring context (MC) structure for monitoring processes and their steps, both at the definition level and at the execution level, is a diamond as shown in Figure 2.
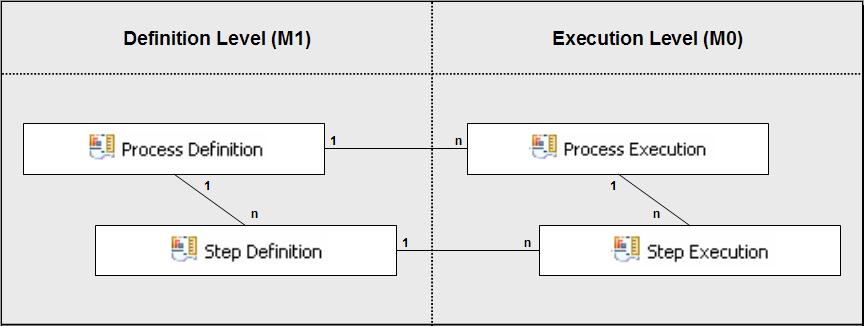 |
| Figure 2: Ideal Structure for Process Monitoring: A Diamond |
But the architecture of WebSphere Business Monitor requires that monitoring contexts form a tree. To cope with this restriction, two different techniques were applied to "break up" the diamond structure. They are indicated in red in Figure 1:
This explains the upper part of the model structure in Figure 1, which now indeed is a tree. The lower part shows a simple, two-level hierarchy for monitoring human task definitions and their executions. Since WebSphere Process Server allows human tasks to be defined as steps in a process as well as stand-alone, not all human tasks would be captured by a monitor model that only tracks processes. The lower part of the model was thus added to account for stand-alone tasks. For completeness however, the Task Definition and Task Execution MCs subscribe to events from both inline and stand-alone human tasks, so that inline tasks are monitored both as "process steps" in the upper part of the model and as "human tasks" in the lower part.
This concludes our overview of the monitor model structure. There are numerous other monitoring context definitions, which for the most part have auxiliary purposes: they hold data which really should be held in complex type metrics. With WebSphere Business Monitor only supporting simple metric types, complex type metrics, as well as sequences (arrays), must be realized using auxiliary MC definitions. Almost all of these auxiliary MCs capture timestamped histories, of execution states, task assignments, task escalations, model versions, instance migrations, variable values, etc.
The entire monitoring context hierarchy of the global process monitor model is show in Figure 3, with the principal monitoring context definitions emphasized. They represent the main navigation path, and you should not lose sight of it when exploring this model. Where parts of a monitoring context name are in brackets this indicates that the display names have been shortened accordingly.
Users who look at the monitor model source will find that there are monitoring context definitions whose names start with "Aux" and which are not shown in Figure 3; they will also find metrics whose names start with "Aux" in MCs that are shown in Figure 3. All of these are auxiliary constructs to support the monitor model logic. They should be ignored when setting up dashboard views, and are best considered hidden (like private fields in object-oriented programming).
Two business space configurations are shipped with this sample to provide for an out-of-the-box dashboard experience. You can use them as-is, customize them, or define your own dashboard for this monitor model from scratch.
A "basic" and an "advanced" dashboard configuration are provided. The advanced configuration is an extension of the basic: It shows some of the more detailed, technical data captured by this monitor model, like execution identifiers, milliseconds, timezones, process migrations, etc. In the tabular descriptions on the following pages, metrics that are only shown in the advanced dashboard are marked by (A), metrics that are only shown in the basic dashboard are marked by (B), and metrics shown in both are left unmarked.
Both versions of the dashboard have six pages
Each page will now be discussed in turn.