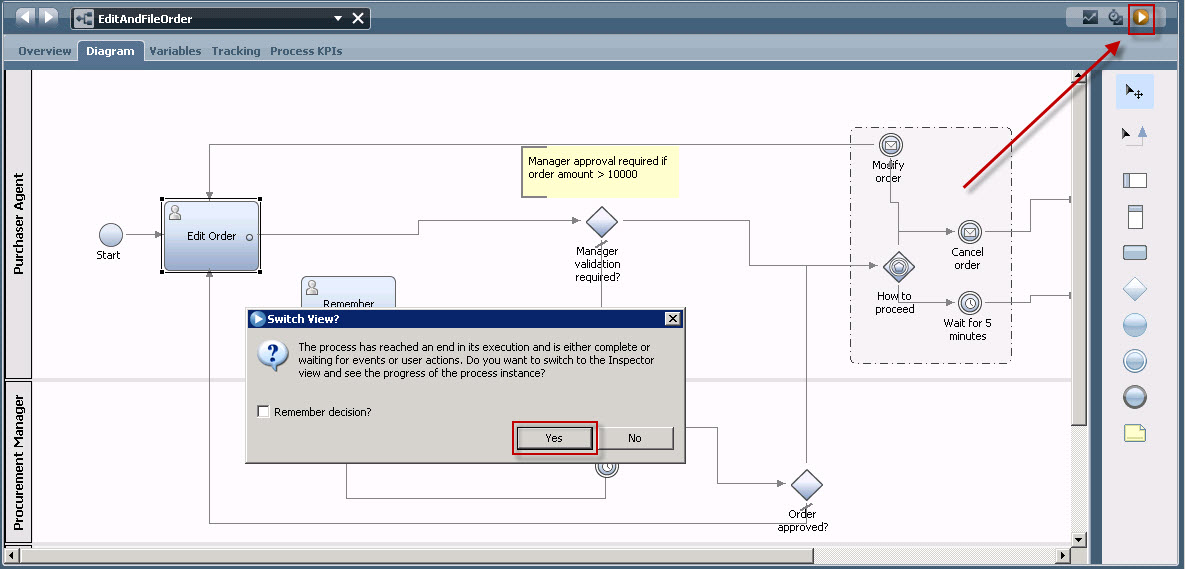
Before having a look at the performance warehouse, we need to have a few running instances. Therefore start at least five different EditAndFileOrder processes, simply by clicking the run botton 5 times, then complete the first task named ‘Edit Order’, and perform some more navigation for some of the instances. When asked for a userID and password to accept tasks during process execution, work with tw_admin for userID and password.
Only one thing is important: Be sure to have a different OrderID of each
process instance, and if you want to experience the event gateway, remember
this OrderID as it is required to modify or cancel the order via the second
process of the Process Application, named ‘ModifyOrder’.
Repeat this to finally have at least 5 instances running in various
states.
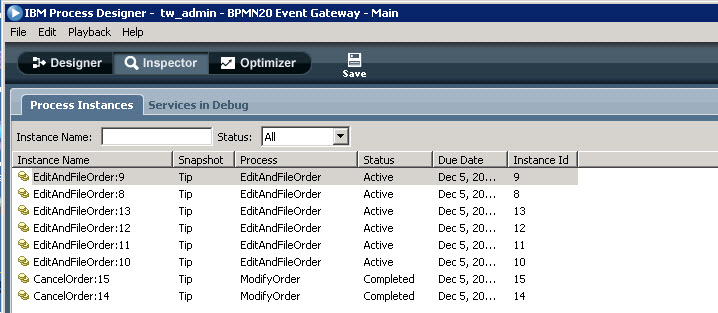
When done, in Inspector you will have a lost like that:
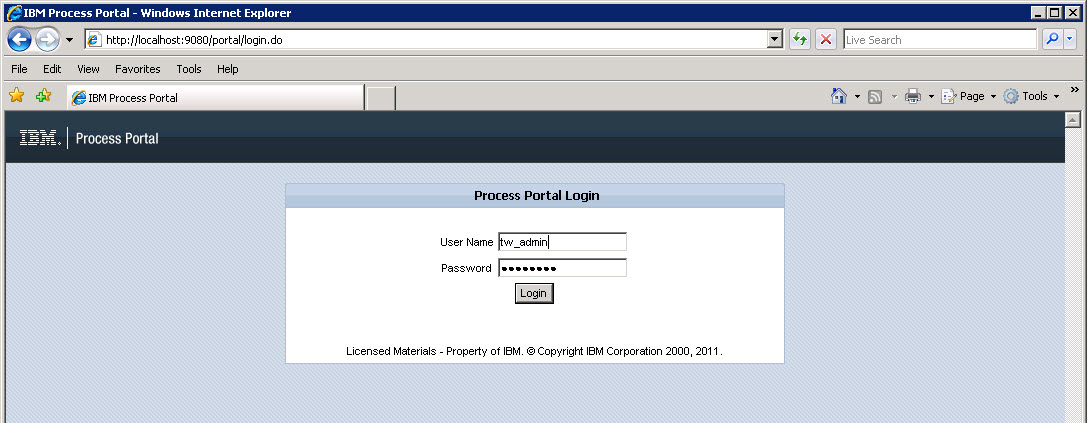
Now logon to Process Portal at http://localhost:9080/portal (use tw_admin for userID and password) to investigate the process instance execution performance:
Let’s take a quick tour on Process Portal:
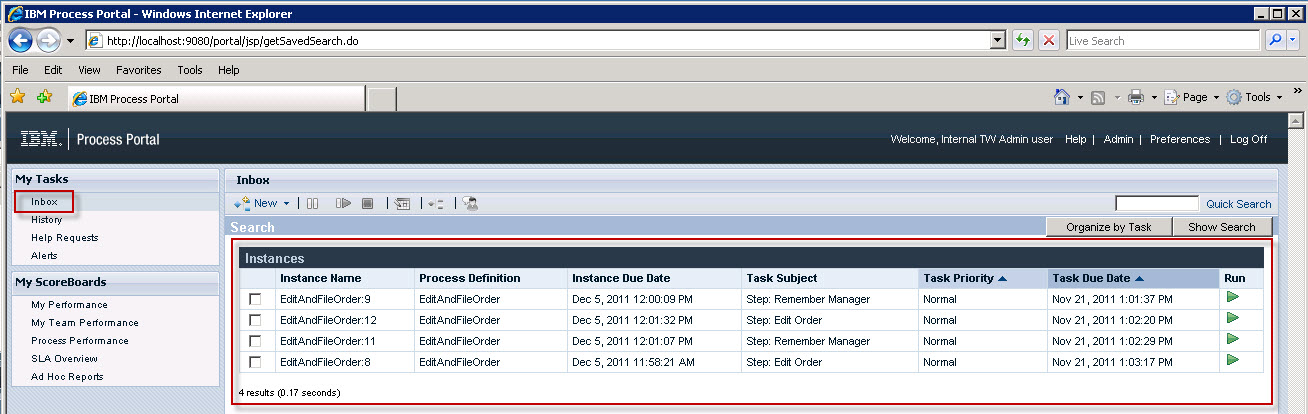
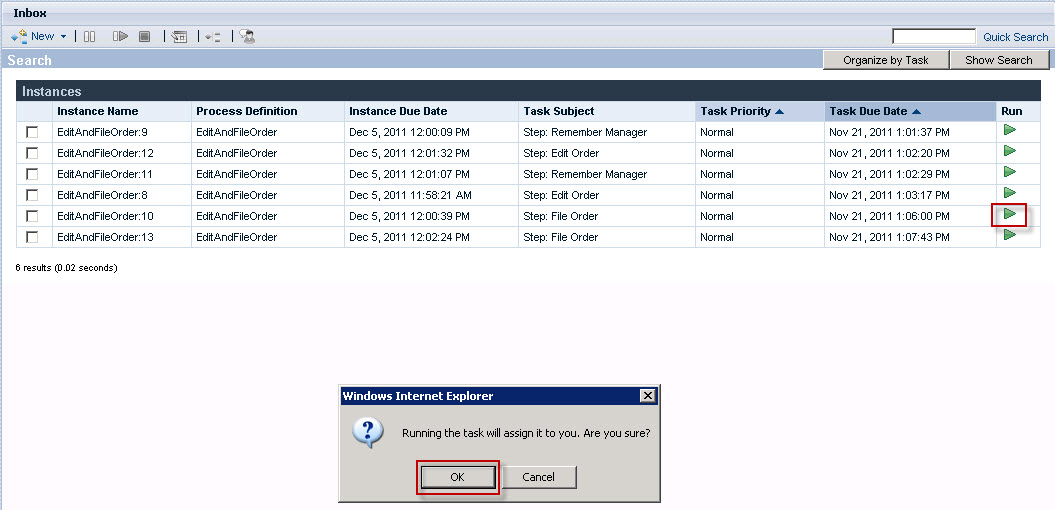
First, on the left hand side, your Inbox is shown presenting all active
process instances and their currently made ready task, which you could select
and run. If you want to run a task, simply click on the green run button
presented in the most right column.
Second, click on the History link on the left hand side. Here you do not
only see the active process instance, but the already completed instances as
well.
Now before we have a look at the process performance – accept to run a task from your Inbox. Switch back to the inbox, and for example select a process instance which waits for the completion of the ‘File Order’ task. Click the run button, accept the task assignment, and click OK:
Complete the task by clicking on the File Order button.
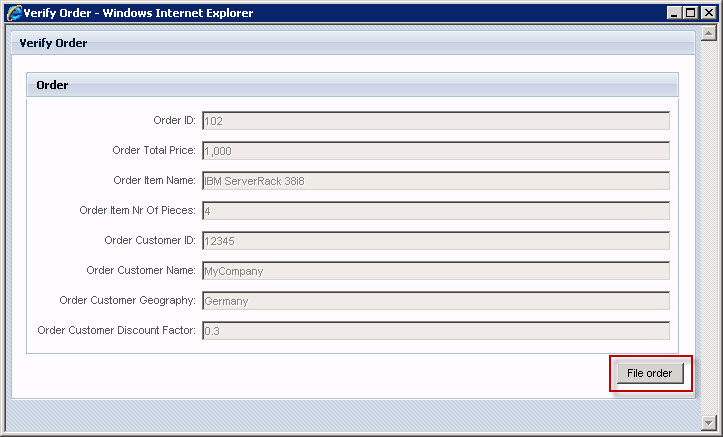
This was the last task of this process instance, and the process
instance will now be completed.
If you switch back to the History tab, you will see the first
EditAndFileOrder process instance to be completed, whereas all the others are
still active, and therefore running.
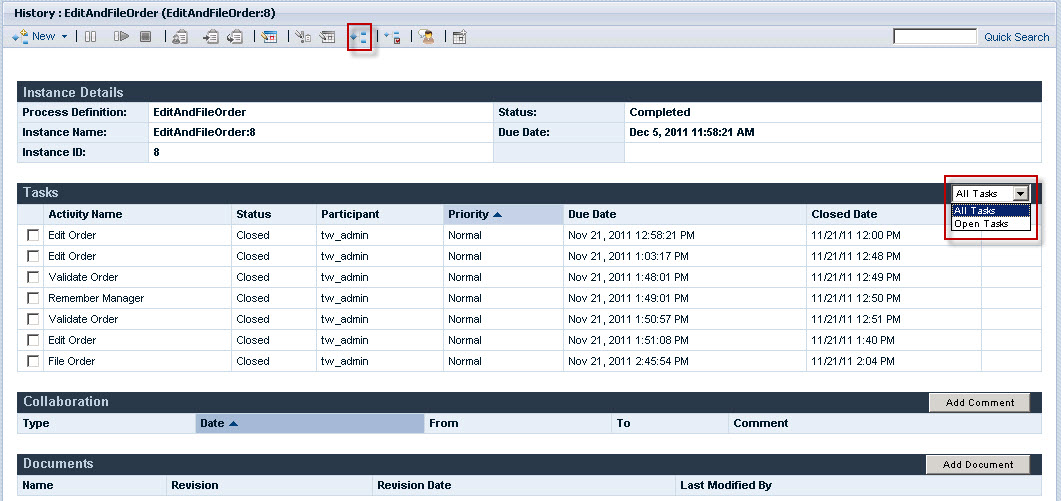
Now – click on a process instance listed in the ‘Instance Name’ tab in
the History view. More details about the process instance is displayed. In the
Tasks section, click on the right hand side to list details for all tasks.
Be it for completed instances or instances that are still running, you
can add comments and document to further detail out the process instance
history.
Now, open the process instance diagram by clicking on the little diagram icon at the top.
Now – let’s have a look at the performance tabs. And remember: The data
you see may be a little bit different compared to the images published here in
the sample.
Click on the ‘My Performance’ link on the left hand side to see your performance (which is the performance of the logged on user):
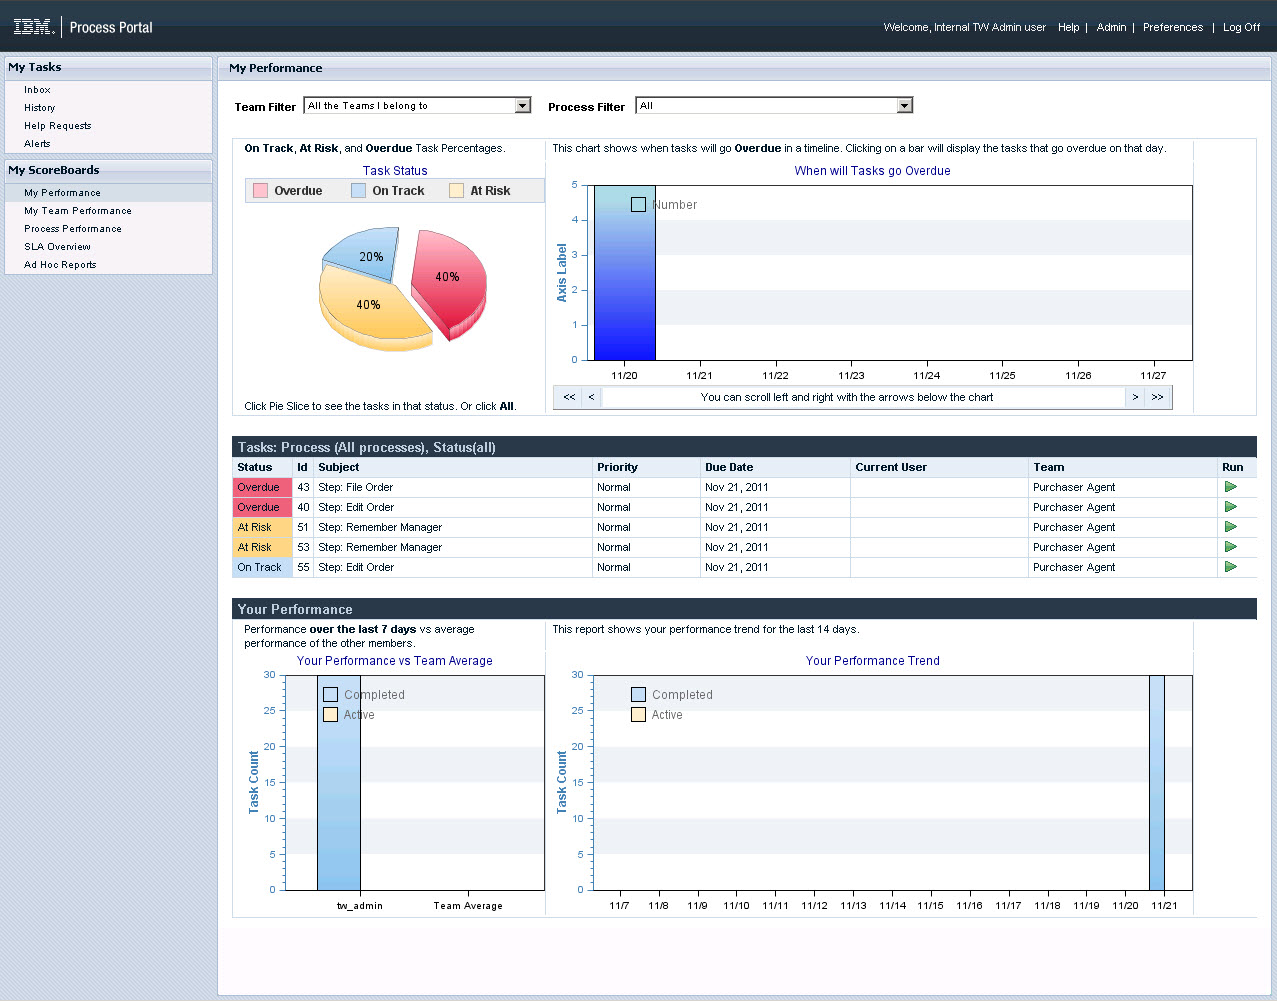
If the user is a member of a team then performance metrics are available
for the team. We have not set things up
in this lab to show team data in the My Team reports. As time continues, and
more and more process instances are started, worked on and then completed, the
statistics here will change in a real production environment. (In this sample
you are the only user working with the process instances….)
Now have a look at the Process Performance:
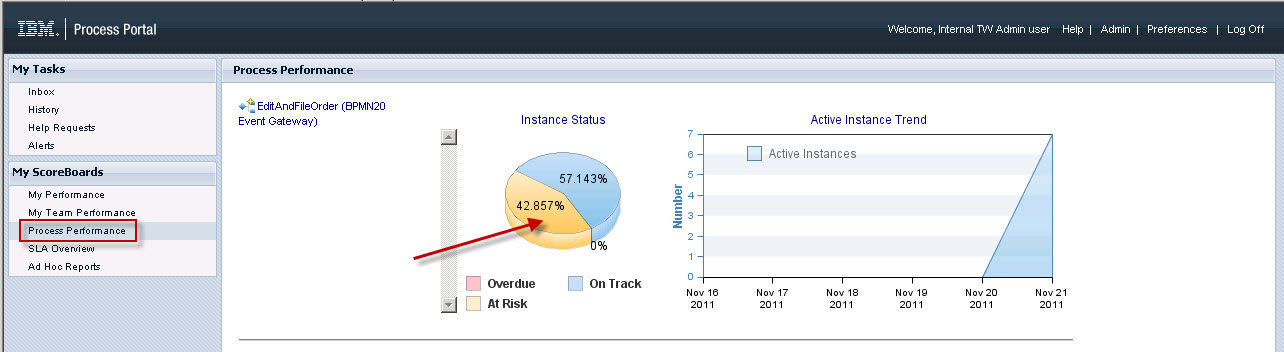
You will see how many processes instances are overdue, at risk or on
track, based on the settings of your Process Applications.
Now, click on the yellow part of the pie chart indicating the percentage
of process instances at risk to get some more details about this.
The process instance overview report is shown presenting more details. However as you do not have many instances, and all were started today, there is not much surprise.
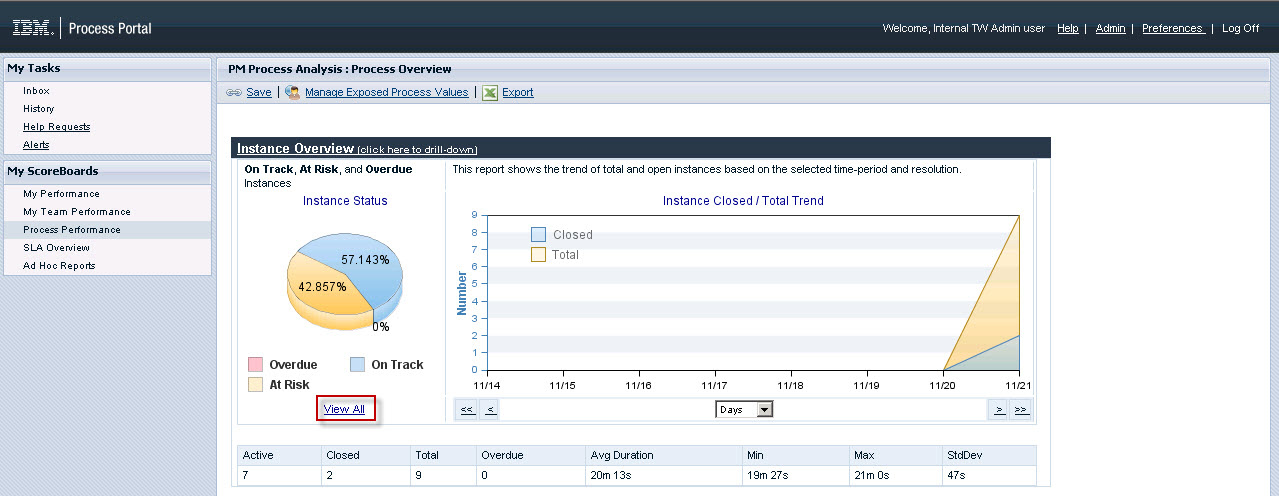
Nevertheless, click on the ‘View all’ button to get more information for each single process instance:
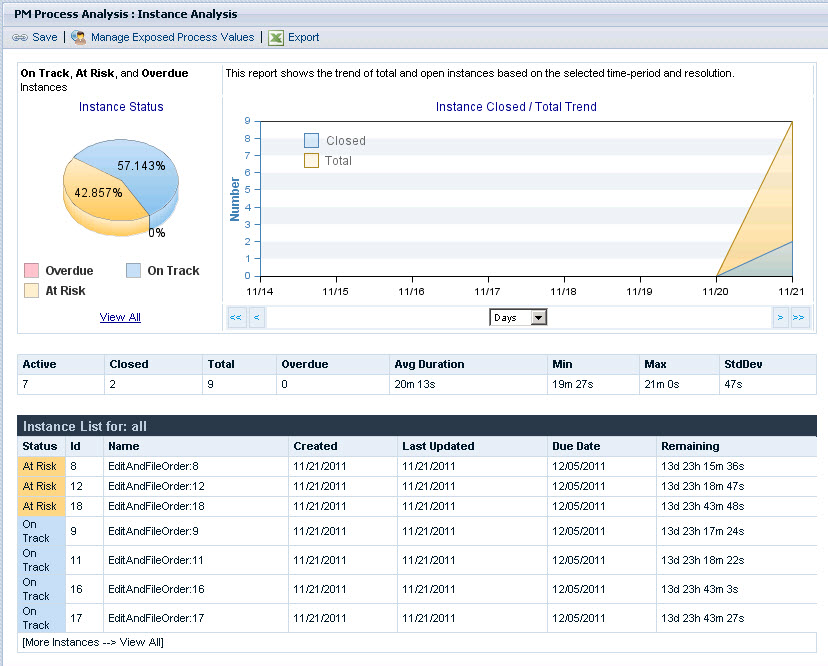
This shows per process instance start and due date, and how much time is
left for completion. Some process instances are flagged to be at risked because
the system anticipates to miss the process instance due date because some or
only one of its tasks are overdue.
Now, click again on Process Performance on the left hand side, then click on the blue part of the pie chart, and scroll down to look at the Activity Analysis:
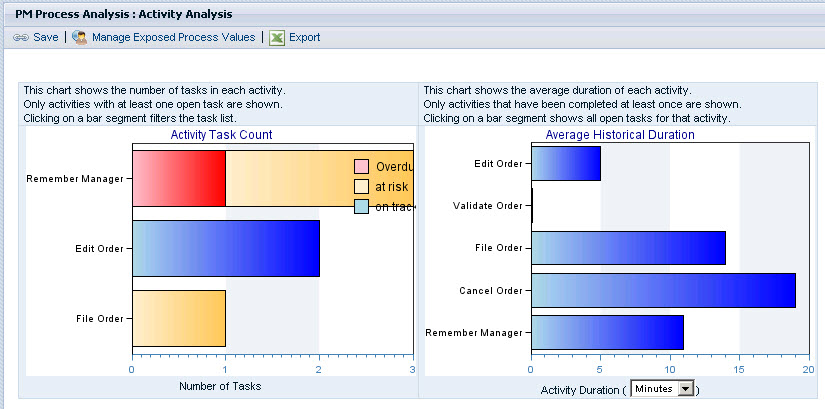
This analysis shows the average task completion per task, and how many
tasks of each type were executed.
However over the colored areas of the activities listed in the Activity Task Count diagram, and if you have an area in red, click on it, otherwise click on any other area.
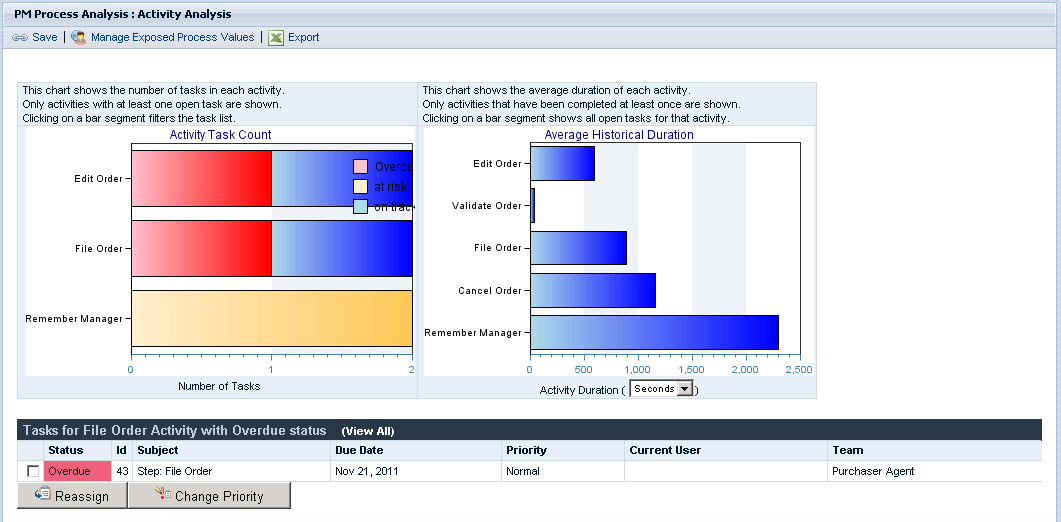
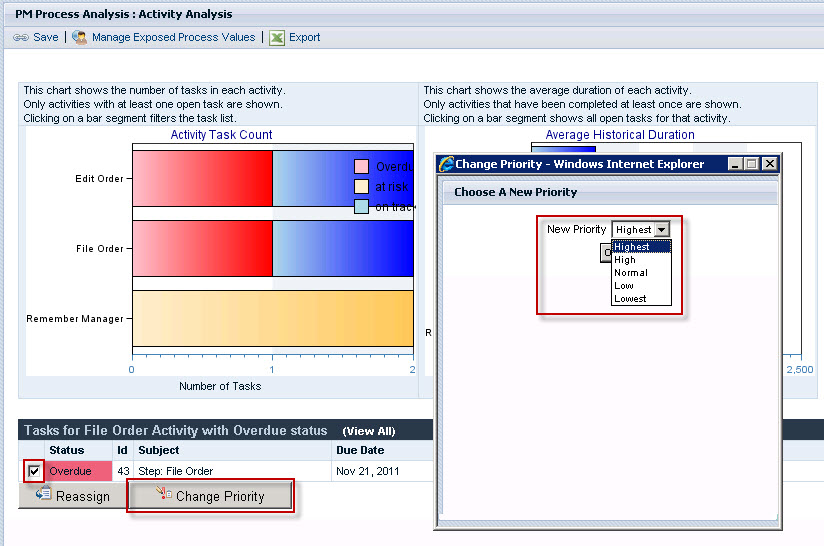
All tasks of the selected state are listed. You can select a task, and change its priority indicating that the task should be completed with higher priority than other tasks. Similar to this, the task can be assigned to other users or user groups.
Finally, let’s create some custom report looking at the process
variables.
To do so, click on the Ad Hoc Reports link on the left hand side. Now you can create a customized report based on the process variables you have selected for tracking.
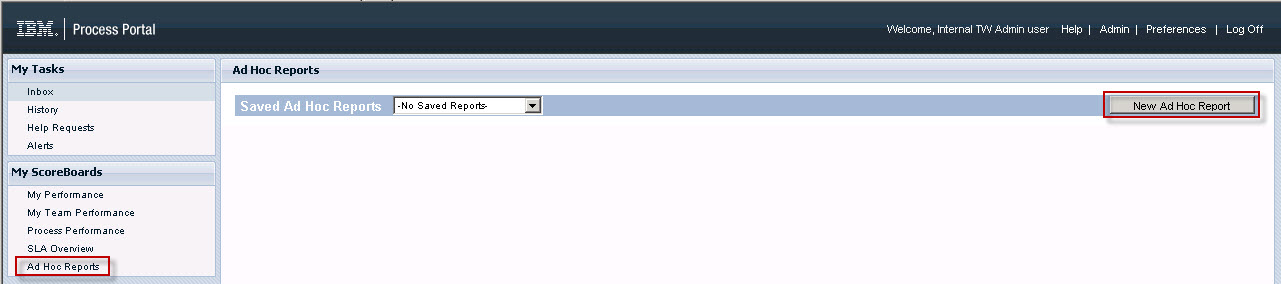
Click on ‘New ad hoc report’, then on the next panel select the ‘EditAndFileOrder’ process. After this, a new panel is presented allowing you to specify what variables should be included in your report. Click at all the drop down boxes to finally have selected what you see here:
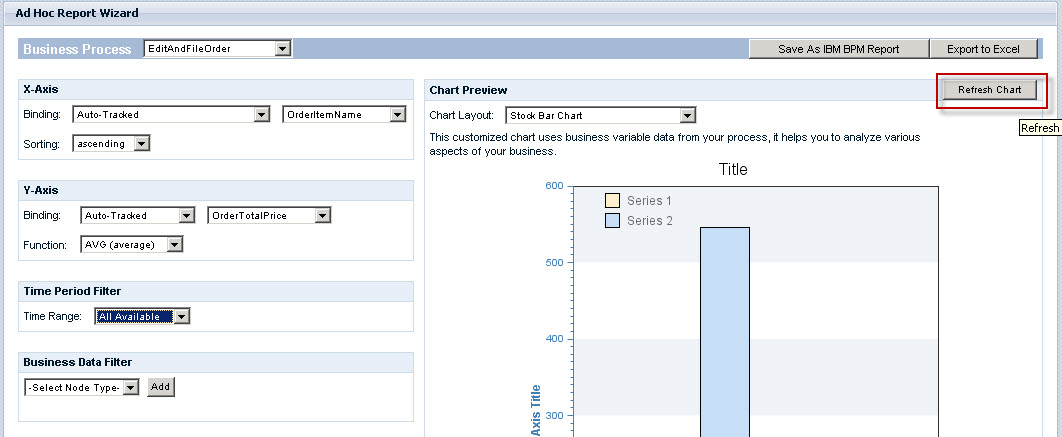
When done, click on ‘Refresh chart’
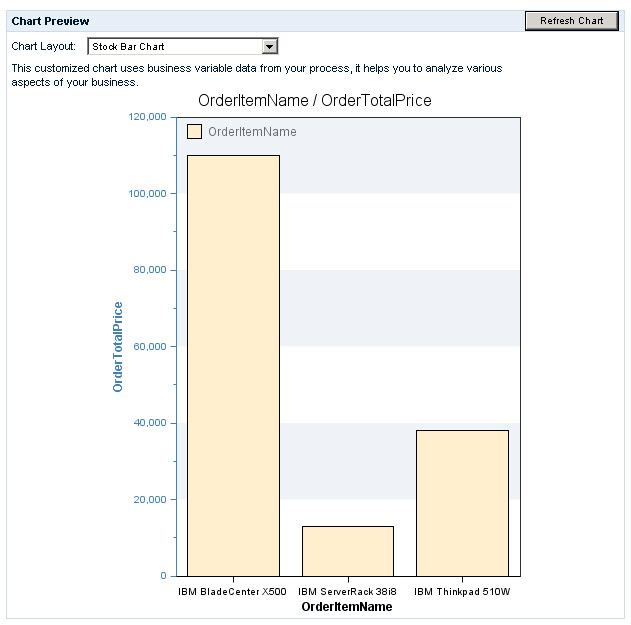
This chart shows you the average total order price per order item
ordered. (You only get this chart if you have created a number of process
instances with different order items used).
You can now save the report, run more instances, and then rerun the ad
hoc report then with new data extracted from newly executed and most likely
completed process instances.
With that this sample completes. You should remember from this sample
that basic process instances monitoring is almost immediately available simply
by defining that process execution should be tracked, and this basic monitoring
includes custom process variables that can be gathered during business process
execution.
However – in order to get to lunch (or dinner) – this is the end of the exercise.