gnuplot
This cookbook references scripts that use the open source gnuplot tool to generate graphs: http://www.gnuplot.info/
graphcsv.gpi
The primary gnuplot script used is at https://raw.githubusercontent.com/kgibm/problemdetermination/master/scripts/gnuplot/graphcsv.gpi
This is combined with the following script to generate the multiplot commands: https://raw.githubusercontent.com/kgibm/problemdetermination/master/scripts/gnuplot/graphcsv.sh
Some common things you may consider changing:
- Uncomment the following line in graphcsv.gpi to produce a text-based
graph to the console:
#set terminal dumb - Uncomment the following lines in graphcsv.gpi to produce a
PNG:
#set terminal png
#set output "output.png" - Remove "pause -1" from graphcsv.sh to disable the requirement to hit Ctrl+C after the graph is produced (this is particularly useful for #1 and #2 above)
Test Graphing
Test graphing with the following set of commands:
$ cat > data.csv
Time (UTC),CPU,Runqueue,Blocked,MemoryFree,PageIns,ContextSwitches,Wait,Steal
2014-10-15 16:12:11,20,0,0,12222172,0,2549,0,0
2014-10-15 16:12:12,27,1,0,12220732,0,3619,0,0
2014-10-15 16:12:13,30,0,0,12220212,0,2316,0,0
Ctrl+D
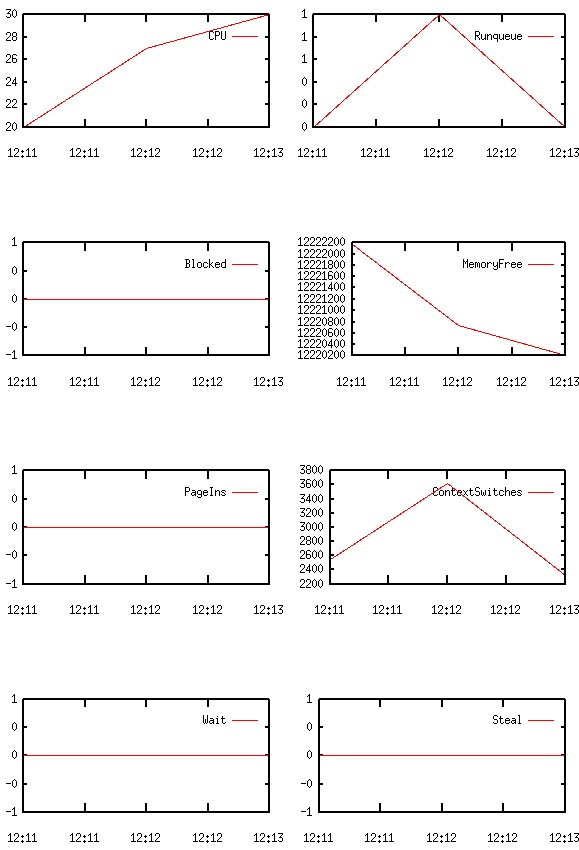
$ gnuplot -e "\
> set timefmt '%Y-%m-%d %H:%M:%S';
> set xdata time;
> set style data lines;
> set format y '%.0f';
> set datafile sep ',';
> set key autotitle columnhead;
> set multiplot layout 4,2 scale 1.0,0.8;
> plot 'data.csv' using 1:2;
> plot 'data.csv' using 1:3;
> plot 'data.csv' using 1:4;
> plot 'data.csv' using 1:5;
> plot 'data.csv' using 1:6;
> plot 'data.csv' using 1:7;
> plot 'data.csv' using 1:8;
> plot 'data.csv' using 1:9;
> unset multiplot;
> pause -1;"
Warning: empty y range [0:0], adjusting to [-1:1]
Warning: empty y range [0:0], adjusting to [-1:1]
Warning: empty y range [0:0], adjusting to [-1:1]
Warning: empty y range [0:0], adjusting to [-1:1]Example output:
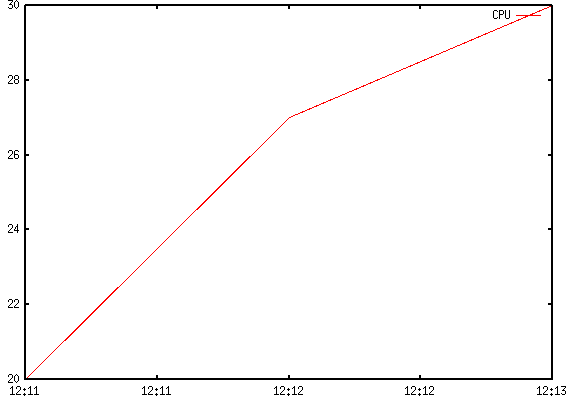
For a simpler, one-plot graph:
$ gnuplot -e "\
> set timefmt '%Y-%m-%d %H:%M:%S';
> set xdata time;
> set style data lines;
> set format y '%.0f';
> set datafile sep ',';
> set key autotitle columnhead;
> plot 'data.csv' using 1:2;
> pause -1;"
Output: