Troubleshooting Windows
Common Commands
- Query Windows Version: ver
- Query host name: hostname
- Show all processes: tasklist /svc
- Kill process: taskkill /PID %PID%
- Run a process as a system account: psexec -i -s ... (https://docs.microsoft.com/en-us/sysinternals/downloads/psexec)
Batch Scripts
Batch scripts execute a sequence of commands. They are files that
usually end in the .bat or .cmd
extensions.
Example Batch Script
:: Launcher script
:: Comments start with ::

@echo off

set TITLE=Tool Launcher
title %TITLE%
echo %TITLE%

set PATH=C:\Java\bin;%PATH%

echo Launching the tool. This may take a few minutes depending on available resources.

C:\Eclipse\eclipsec.exe -consoleLog

echo(

echo Tool completed. Press any key to end this prompt.

echo(

pause
Delayed variable expansion
Delayed environment variable expansion is disabled by default which
means that variable evaluation only occurs once. From
help set:
Delayed environment variable expansion is useful for getting around the limitations of the current expansion which happens when a line of text is read, not when it is executed.
To always evaluate the latest value, use
SETLOCAL ENABLEDELAYEDEXPANSION and then reference
environment variables with ! instead of %. For
example:
SETLOCAL ENABLEDELAYEDEXPANSION

set "workdir=!APPDATA!"

if "!USERDOMAIN!" == "MYDOMAIN" (
  set "workdir=E:\!USERNAME!"

  if not exist "!workdir!" mkdir "!workdir!"
)

pushd !workdir!

echo [!date! !time!] Current working directory is !workdir!

popd
PowerShell
Start
PowerShell from a command prompt: > PowerShell
Run a single command with -command and exit
examples:
powershell -command "gcim Win32_OperatingSystem"powershell -command "Get-WmiObject -Query \"Select PoolNonpagedAllocs, PoolNonpagedBytes, PoolPagedAllocs, PoolPagedBytes, PoolPagedResidentBytes from Win32_PerfRawData_PerfOS_Memory\""
gcim
Kernel Information
PS C:\Windows\system32> gcim Win32_OperatingSystem | fl *
Status                                    : OK
Name                                      : Microsoft Windows Server 2016 Datacenter|C:\Windows|\Device\Harddisk1\Partition2
FreePhysicalMemory                        : 29066692
FreeSpaceInPagingFiles                    : 2097152
FreeVirtualMemory                         : 30955508
[...]
LastBootUpTime                            : 10/18/2020 3:15:34 AM
LocalDateTime                             : 10/19/2020 12:13:26 PM
MaxNumberOfProcesses                      : 4294967295
MaxProcessMemorySize                      : 137438953344
[...]
TotalSwapSpaceSize                        :
TotalVirtualMemorySize                    : 35651016
TotalVisibleMemorySize                    : 33553864
Version                                   : 10.0.14393
BootDevice                                : \Device\HarddiskVolume2
BuildNumber                               : 14393
[...]
OSArchitecture                            : 64-bit
Memory Information
PS C:\Windows\system32> Get-WmiObject -Query "Select * from Win32_PerfRawData_PerfOS_Memory"
[...]
AvailableBytes                       : 29771300864
AvailableKBytes                      : 29073536
AvailableMBytes                      : 28392
CacheBytes                           : 94912512
CacheBytesPeak                       : 99270656
CacheFaultsPersec                    : 2821370
CommitLimit                          : 36506640384
CommittedBytes                       : 4798459904
DemandZeroFaultsPersec               : 27014186
Description                          :
FreeAndZeroPageListBytes             : 24855367680
FreeSystemPageTableEntries           : 12296228
Frequency_Object                     : 0
Frequency_PerfTime                   : 2045851
Frequency_Sys100NS                   : 10000000
LongTermAverageStandbyCacheLifetimes : 14400
ModifiedPageListBytes                : 89337856
PageFaultsPersec                     : 43331932
PageReadsPersec                      : 266395
PagesInputPersec                     : 1596682
PagesOutputPersec                    : 0
PagesPersec                          : 1596682
PageWritesPersec                     : 0
PercentCommittedBytesInUse           : 564533688
PercentCommittedBytesInUse_Base      : 4294967295
PoolNonpagedAllocs                   : 512164
PoolNonpagedBytes                    : 278237184
PoolPagedAllocs                      : 656935
PoolPagedBytes                       : 466354176
PoolPagedResidentBytes               : 458170368
StandbyCacheCoreBytes                : 0
StandbyCacheNormalPriorityBytes      : 2499997696
StandbyCacheReserveBytes             : 2415935488
SystemCacheResidentBytes             : 0
SystemCodeResidentBytes              : 0
SystemCodeTotalBytes                 : 0
SystemDriverResidentBytes            : 15638528
SystemDriverTotalBytes               : 18214912
Timestamp_Object                     : 0
Timestamp_PerfTime                   : 244291819761
Timestamp_Sys100NS                   : 132476163452030000
TransitionFaultsPersec               : 14197071
TransitionPagesRePurposedPersec      : 0
WriteCopiesPersec                    : 411112
Windows Management Instrumentation (WMI)
Windows Management Instrumentation (WMI) is an interface to access administrative information.
wmic
wmic is a command line interface to WMI.
wmic get free RAM
>wmic os get freePhysicalMemory
FreePhysicalMemory
29227280
Update the hosts file
- Start an editor such as Notepad as Administrator
- Open the file
%WinDir%\System32\Drivers\Etc\hosts(supercedes the holderlmhostsfile) - Edit and save
Request thread dump
See Troubleshooting IBM Java - in particular, you may use Java Surgery to take thread dumps on IBM Java.
Request core dump (also known as a "system dump" for IBM Java)
Additional methods of requesting system dumps for IBM Java are documented in the Troubleshooting IBM Java and Troubleshooting WAS chapters.
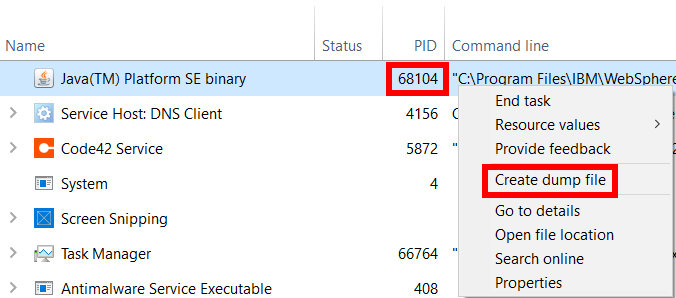
- On Windows, start Task Manager, right click on the process, click Create Dump File. You can find the right process by adding the PID column, and finding the PID from SystemOut.log or the %SERVER%.pid file in the logs directory.
- procdump: https://docs.microsoft.com/en-us/sysinternals/downloads/procdump
- On Windows, userdump.exe %PID%: http://www-01.ibm.com/support/docview.wss?uid=swg21138203#userdump
Minidump versus Full User Mode Dump
The name "minidump" is misleading, because the largest minidump files actually contain more information than the "full" user-mode dump. (https://msdn.microsoft.com/en-us/library/windows/hardware/ff552212(v=vs.85).aspx)
Request core dump from Task Manager
- Find the right process, e.g. by process ID (PID)
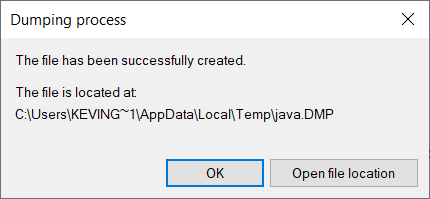
- Right click } Create dump file:
- Navigate to the dump file directory:
EXE has stopped working
If you receive the following popup with the message, "A problem caused the program to stop working correctly. Please close the program.":
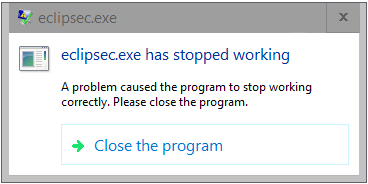
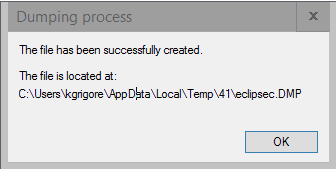
Then before clicking "Close the program," you may create a dump of the process:
- Open Task Manager
- Find the process } Right Click } Create dump file
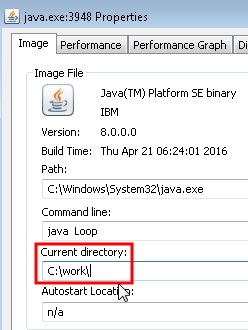
Determine the Current Working Directory of a Process
- Download Microsoft's free Process Explorer tool: https://technet.microsoft.com/en-us/sysinternals/processexplorer.aspx
- Unzip and start procexp.exe
- Find the java process, right click and click Properties:
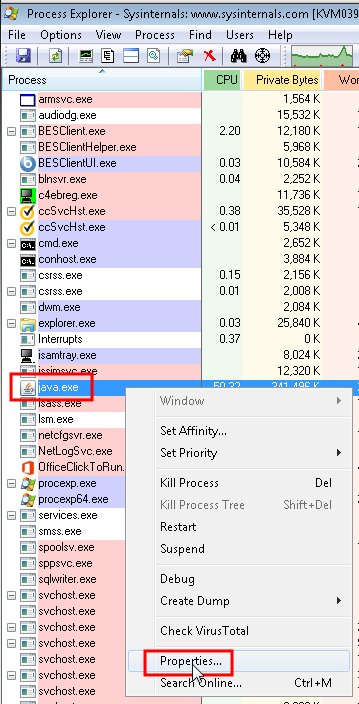
- Find the value of "Current directory":
Determine the File Locations of stdout and stderr
- Install Microsoft's free handle tool: https://technet.microsoft.com/en-us/sysinternals/handle.aspx
- Unzip and open a command prompt to the directory with the unzipped
files and run the tool to list all open handles for all processes:
> cd "C:\Downloads\Handle\"
> handle.exe - Search the output for the java.exe section for the target process
ID. For example:
java.exe pid: 4852 [...]
C: File (R--) C:\work\stderr.txt
[...] - The left-most value is a hexadecimal number representing the file handle. Stdin is A, Stdout is B, and Stderr is C (https://msdn.microsoft.com/en-us/library/windows/desktop/ms683231(v=vs.85).aspx); however, we have observed that sometimes stdout is not B, but instead there are multiple handles in the D to FF range (unclear why).
Find who killed a process
- Install gflags.exe from Microsoft
- Enable Silent process exit monitoring: https://docs.microsoft.com/en-us/windows-hardware/drivers/debugger/registry-entries-for-silent-process-exit
- Reproduce the issue
- Review the silent process exit monitoring entry in the Windows Event Log
Error: No buffer space available (maximum connections reached?)
This error can occur particularly around socket operations. The error is translated from the Winsock error code WSAENOBUFS, 10055. The most common cause of this error is that Windows is configured for the default maximum of 5,000 in-use ports. This can be monitored by watching netstat or Perfmon and can be changed with the MaxUserPort registry parameter.
A more advanced cause for this error is non-paged pool exhaustion. The paged and nonpaged pools are areas of memory for certain Windows kernel-mode allocations such as the Windows kernel itself (e.g. sockets, socket buffers, etc.), device drivers, etc. The nonpaged pool is particularly important as "it is the availability of nonpaged pool that determines how many processes, threads, and other such objects can be created" (MS link defunct). If these pools are exhausted, this can lead to crashes, poor performance, application problems, and paging.
If the system is using the /3GB mode, this comes at a cost of taking memory away from the kernel, including paged and non-paged pools.
To determine if this is the proximate cause, use Perfmon to monitor the Memory\Pool Nonpaged Bytes counter. If this is hitting the server's nonpaged pool limit (within a few MB since Perfmon is sampling on an interval), then this is the cause of the problem. However, this proximate cause may not be the root cause since the nonpaged pool exhaustion may be due to a nonpaged pool leak. A nonpaged pool leak can be determined using Microsoft's PoolMon.
To increase kernel memory, lower the user-mode address space limit (/USERVA=X). The /3GB switch is effectively the same as /USERVA=3072; for example, /USERVA=2800. This parameter would be used instead of /3GB. The documentation is not clear on how the additional space is allocated to the nonpaged pool and to what limits -- monitor your current and maximum nonpaged pool sizes with process explorer and work with Microsoft support to properly tune this value.
Query using PowerShell:
PS C:\Windows\system32> Get-WmiObject -Query "Select PoolNonpagedAllocs, PoolNonpagedBytes, PoolPagedAllocs, PoolPagedBytes, PoolPagedResidentBytes from Win32_PerfRawData_PerfOS_Memory"
[...]
PoolNonpagedAllocs     : 500237
PoolNonpagedBytes      : 276725760
PoolPagedAllocs        : 635578
PoolPagedBytes         : 461209600
PoolPagedResidentBytes : 453271552
windbg
Useful commands:
- Command help: .hh %COMMAND%
- Interrupt a long running command: Ctrl+Break
- Clear output: .cls
- Write output to file: .logopen %SOMEFILE%
- Show modules the process has in memory: lmf
- Confirm if symbols are loaded for MODULE.dll: ld MODULE
- If you see "Defaulted to export symbols for MODULE.dll," then symbols were not found or did not match.
- List all virtual memory regions: !address
- Virtual memory info: !address -summary
- List all native heaps: !heap -s
- List details of a heap (ID from first column in !heap -s): !heap -stat -h <Heap ID>
- Given a UserPtr and EXE has gflags +ust, dump stack: !heap -p -a <UserPtr>
- Was gflags set: !gflag
- Dump memory at an arbitrary address: db 0x123...
- Show where symbols are found: lm
- Show checksum: !lmi MODULE
- Module information: !dh MODULE
- Show why symbols can't be found: !sym noisy; .reload /f
- Try to load symbols for a particular module (take the name from lmf): ld %MODULE%
- See if DLL and PDB match: !chksym MODULE
- NOTE: If a DLL is compiled in "Release" mode (which most are), then you will not see line numbers or parameters even if the PDB has private symbols.
Symbols
The symbol path is a semicolon delimited list of directories containing symbol (PDB) files. A special case path is of the form srv*%DIR%*%WEBSERVER% which specifies an HTTP(S) symbol server. This is most often used to download Windows symbols from Microsoft. If the %DIR% does not exist, it is created.
Simple symbol path with just kernel symbols:
0:000> .sympath srv*C:\symbols\*http://msdl.microsoft.com/download/symbols
0:000> .reload /f
For example, a common path which includes WebSphere and Java symbols:
0:000> .sympath C:\Program
Files\IBM\WebSphere\AppServer\lib\native\win\x86_64\;C:\Program
Files\IBM\WebSphere\AppServer\java\8.0\jre\bin\compressedrefs\;C:\Program
Files\IBM\WebSphere\AppServer\java\8.0\jre\bin\j9vm\;C:\Program
Files\IBM\WebSphere\AppServer\bin\;srv*C:\symbols\*http://msdl.microsoft.com/download/symbols
0:000> .reload /f
It is common to see a checksum warning when loading modules:
*** WARNING: Unable to verify checksum for ...In general, this warning can be safely disregarded. If you would like
to resolve the warning, run editbin /release module.dll: https://msdn.microsoft.com/en-us/library/tst6zb25.aspx
To display detail symbol loading information:
0:000> !sym noisy
noisy mode - symbol prompts on
0:000> .reload /f
Check if symbols were correctly loaded for a module by searching for MATCH:
0:000> !chksym module
module.dll...
          pdb: ...\module.pdb
      pdb sig: EDD67653-11E7-483C-8D6D-E629DC820CC1
          age: 2

Loaded pdb is ...\module.pdb

module.pdb
      pdb sig: EDD67653-11E7-483C-8D6D-E629DC820CC1
          age: 2

MATCH: module.pdb and module.dll
If symbols were not loaded, you may various errors such as "sig MISMATCH." In the following example, the PDB file has a signature of E98..., whereas the DLL has a signature of 0.
0:000> !chksym mymodule

mymodule.dll
    Timestamp: 54415058
  SizeOfImage: 7000
      pdb sig: 0
          age: 0

Loaded pdb is ...\mymodule.pdb

getClasses.pdb
      pdb sig: E98AF532-F9C8-4205-9E83-0512360C6C93
          age: 0

sig MISMATCH: mymodule.pdb and mymodule.dll
Symbol loading options may be displayed:
0:000> .symopt
Symbol options are 0x30237:
Symbol loading options may be updated. For example, to use SYMOPT_LOAD_ANYTHING:
0:000> .symopt +0x40
Symbol options are 0x30277:
After changing symbol loading options, you may need to reload symbols
with .reload /f or reload a particular module with
.reload /f module.dll
Process and Thread Info
Show process information:
0:000> |List threads:
0:000> ~Current thread:
0:000> ~.Crashing thread:
0:000> ~#Display when a thread was created and how much user and kernel time it has used:
0:000> .ttime
Created: Fri Oct  6 05:13:34.194 2017 (UTC - 4:00)
Kernel:  0 days 0:00:00.046
User:    0 days 0:00:00.062
Current thread stack:
0:000> knStacks for all threads:
0:000> ~*knTo find the crashing thread from an IBM Java core dump, use jdmpview or IDDE:
> !gpinfo | grep Failing
Failing Thread: !j9vmthread 0x409e000
Failing Thread ID: 0xa048 (41032)
Take the hexadecimal thread ID (without 0x) and change
the current thread in windbg and then print the stack:
0:000> ~~[a048]s
0:000> kn
To switch to a particular frame and show its registers:
0:000> .frame /r 11To display locals:
0:000> dvTo dump details about a variable:
0:000> dt somevariableTo disassemble a function:
0:000> uf MODULE!SYMBOLNote that the registers on the frame that crashed might be strange because they may have been hijacked by the signal handler to create the core dump, so you'll have to check what the registers were on that frame in the javacore::
1XHREGISTERS   Registers:
2XHREGISTER      RDI: 0000D07C00000000
2XHREGISTER      RSI: 00000000000079D0
2XHREGISTER      RAX: 0000000000000000[...]
If needed, replace "2XHREGISTER" with "r" and ":" with "=" for all register lines except XMM* and apply them in windbg on the .frame:
0:000> r      RDI= 0000D07C00000000
0:000> r      RSI= 00000000000079D0
0:000> r      RAX= 0000000000000000 [...]
Crash Dump Analysis
0:000> !analyze -vVirtual Address Space (!address)
Use !address to print all virtual memory allocations. Only Windows symbols are required to execute this:
windbg.exe > File > Open Crash Dump... > Select .dmp file > Save Information for Workspace? = No
0:000> .sympath srv*C:\symbols\*http://msdl.microsoft.com/download/symbols
0:000> .reload /f
0:000> .logopen c:\windbg.txt
0:000> !address
        BaseAddress      EndAddress+1        RegionSize     Type       State                 Protect             Usage
----------------------------------------------------------------------------------------------------------------------
*       0`00000000        0`00010000        0`00010000             MEM_FREE    PAGE_NOACCESS                 Free
*       0`00010000        0`00020000        0`00010000 MEM_MAPPED  MEM_COMMIT  PAGE_READWRITE               Heap [Handle: 10000]...
The following script may be used to analyze the output of !address: https://raw.githubusercontent.com/kgibm/problemdetermination/master/scripts/windows/windbgaddress.pl
Native memory heaps (!heap)
Use !heap -s to print statistics on all native memory
heaps. Only Windows symbols are required to execute this:
windbg.exe > File > Open Crash Dump... > Select .dmp file > Save Information for Workspace? = No
0:000> .sympath srv*C:\symbols\*http://msdl.microsoft.com/download/symbols
0:000> .reload /f
0:000> !heap -s
LFH Key                   : 0x000000911bae555a
Termination on corruption : ENABLED
          Heap     Flags   Reserv  Commit  Virt   Free  List   UCR  Virt  Lock  Fast
                            (k)     (k)    (k)     (k) length      blocks cont. heap
-------------------------------------------------------------------------------------
0000000000260000 00000002 3593912 1920496 3593912 855294  6524  1953   66   72ea   LFH
    External fragmentation  44 % (6524 free blocks)
    Virtual address fragmentation  46 % (1953 uncommited ranges)
0000000000010000 00008000      64      4     64      2     1     1    0      0...
In general, "External fragmentation" is the most interesting fragmentation number and calculates how much free space is available between active allocations. In this example, 0.44 * 3,593,912 = 1.5GB.
Printing all heap segments for a particular heap identifier will show the address ranges of virtual allocations:
0:000> !heap -m -h 260000
Index   Address  Name      Debugging options enabled
  1:   00260000
    Segment at 0000000000260000 to 000000000035f000 (000ff000 bytes committed)
    Segment at 0000000001e70000 to 0000000001f6f000 (000ff000 bytes committed)...
Printing detailed heap statistics will show a histogram of free block sizes:
0:000> !heap -f -stat -h 260000
 0: Heap 0000000000260000
   Flags          00000002 - HEAP_GROWABLE
   Reserved memory in segments              5342216 (k)
   Commited memory in segments              1609368 (k)
   Virtual bytes (correction for large UCR) 1653528 (k)
   Free space                               576170 (k) (5196 blocks)

                    Default heap   Front heap       Unused bytes
   Range (bytes)     Busy  Free    Busy   Free     Total  Average
------------------------------------------------------------------
     0 -   1024     2253   2599   3610  24459  154847577  26410
  1024 -   2048     2192      8     74   1265 1685388810 743772
  2048 -   3072      132     40     48   4882     150789    837...
The output of !address will also print the heap for each of the virtual allocations. If investigating exhaustion of some space (e.g. underneath 4GB), then review the heaps used in that space.
Dump virtual memory
The db command accepts a start and end address:
0:000> db 0xffb1d000 0xffb24000
00000000`ffb1d000  00 00 00 00 00 00 00 00-36 dd f3 85 a6 da fc 00  ........6.......
00000000`ffb1d010  10 70 ac 57 00 00 00 00-30 20 65 1d 00 00 00 00 .p.W....0 e.....
Native Stack Sizes
It appears that Windows will allocate 1MB of virtual stack space for every thread even if a program requests less: "The default stack reservation size used by the linker is 1 MB." (https://msdn.microsoft.com/en-ca/library/windows/desktop/ms686774(v=vs.85).aspx).
For example, on recent versions of IBM Java, the default maximum stack size (-Xss) is 256KB or 512KB (http://www.ibm.com/support/knowledgecenter/SSYKE2_8.0.0/com.ibm.java.win.80.doc/diag/appendixes/cmdline/Xss.html); however, a userdump in windbg showed:
0:000> !address
        BaseAddress      EndAddress+1        RegionSize      Usage...
*       0`f0560000       0`f05a0000        0`00040000      Stack [338.55e0; ~1450]
*       0`f0660000       0`f06a0000        0`00040000      Stack [338.5be8; ~1448]...
For example, the stack @ 0xf0560000 has a region size of 256KB; however, the next stack doesn't start until 756KB later.
Thread stacks may also be printed with the !threads command:
0:000> !threads
Index                  TID                     TEB              StackBase              StackLimit                 DeAlloc               StackSize    ThreadProc...
1637    0000000000004c24    0x000007fff0736000    0x00000000f15c0000    0x00000000f15bc000    0x00000000f14c0000    0x0000000000004000    0x0
Total VM consumed by thread stacks 0x1997f000
In this example, we can also see that StackBase-DeAlloc = 1MB.
Module
List all loaded modules:
0:000> lmf
start             end                 module name
00000000`00400000 00000000`0042f000   java     C:\...\java\bin\java.exe
00000000`77750000 00000000`7786f000   kernel32 C:\Windows\System32\kernel32.dll...
Dump flags
The information in a dump is controlled with the MINIDUMP_TYPE enumeration: https://msdn.microsoft.com/en-us/library/windows/desktop/ms680519(v=vs.85).aspx
This may be queried on an existing dump with .dumpdebug (see the "Flags" line):
0:000> .dumpdebug
----- User Mini Dump Analysis
MINIDUMP_HEADER:
Version         A793 (6804)
NumberOfStreams 7
Flags           2
                0002 MiniDumpWithFullMemory
Native Memory Leaks
See details.
- User-Mode Dump Heap (UMDH): https://www.ibm.com/support/pages/mustgather-native-out-memory-windows#trackingWithUMDH
- UMDH consults an allocation database created by the kernel itself to track allocations using gflags
- Libraries must not be complied with frame point ommission (see below)
- DebugDiag: https://learn.microsoft.com/en-us/troubleshoot/developer/webapps/iis/site-behavior-performance/slow-page-response-hangs#generate-memory-dumps-manually-using-debugdiag
- Set symbol path
- Record call stacks immediately when monitoring for leaks
- Monitor for leaks
- Take snapshots over time with full user dump
- Analysis: Advanced Analysis } Memory Pressure Analyzers
- VMMap: https://learn.microsoft.com/en-us/sysinternals/downloads/vmmap
Frame Pointer Omission (FPO)
There is a compiler optimization called Frame Pointer Omission (/Oy) which speeds up function calls: https://msdn.microsoft.com/en-us/library/2kxx5t2c.aspx
However, this breaks stack walker. Microsoft Visual C++ 2005 enabled this optimization by default but it was later disabled by default in Visual C++ 2005 SP1, therefore, it is a best practice to avoid FPO.
Check if FPO is used by an EXE or DLL:
dumpbin.exe /fpo %MODULE%If there are "FPO Data" lines, then it is used.
Debug and Release Modules
In general, Microsoft compilers provide two compilation configurations: Debug and Release. These supply different compiler and linker parameters such as optimization levels and linking to different libraries. These are simply default sets of configurations, and it is possible to change all of the flags of a "release" build to make it a "debug" build. The salient point here is that a module such as a DLL or EXE may perform worse with Debug optimization flags (whether due to using the Debug configuration or by explicitly using /Od, /MTd, etc.). It is not easy to check a final DLL or EXE to understand its optimization level. One technique is to see if it links with debug versions of commonly used libraries such as VC, MFC, or ATL. For example, use a dependency walker to see if the module depends on MSVCRTD.DLL. However, this is not proof as it is possible to create a fully optimized module that links to a debug version of one of these libraries. Another technique is to search the module for references to functions only called with _DEBUG or NDEBUG #defined, such as assert.
Symbols
Symbols match hexadecimal addresses to human readable descriptions from the original source code, such as 0x12345678 is the function foo. Symbols are required when analyzing native artifacts such as process core dumps (userdumps). Windows EXEs and DLLs do not contain symbol information, but instead the symbols are placed into PDB files, normally with the same name and in the same directory as the EXE or DLL. PDBs should always be built, even for release-optimized modules:
"Generating PDB files for release executables does not affect any optimizations, or significantly alter the size of the generated files... For this reason, you should always produce PDB files, even if you don't want to ship them with the executable." (https://msdn.microsoft.com/en-us/library/ee416588(v=vs.85).aspx)
To generate symbols, add the /Zi compiler flag: https://msdn.microsoft.com/en-us/library/958x11bc.aspx
While not generally recommended, if you would like to name the PDB file something other than MODULE.pdb, use /Fd: https://msdn.microsoft.com/en-us/library/9wst99a9.aspx
If you have separate compile and link steps, in addition to the compiler /Zi flag, you must also add the linker /DEBUG flag: https://msdn.microsoft.com/en-us/library/xe4t6fc1.aspx. Note that the term "DEBUG" in this context has nothing to do with /D _DEBUG, /Od, /MTd or other "Debug" compiler configurations, but instead simply "puts the debugging information into a program database (PDB)." In fact, the linker will update the PDB file created by the compiler through the /Zi flag, so both are required.
Often, symbols will not be distributed with EXEs and DLLs simply to reduce the size of installer packages. Windows itself does not ship with PDBs. However, if the additional size of PDBs of EXEs and DLLs is marginal, then we recommend that you ship the PDBs with the EXEs and DLLs. IBM Java ships PDBs with each build (http://www-01.ibm.com/support/docview.wss?uid=swg1IV50063), and WAS is working on adding PDBs to all of its DLLs (http://www-01.ibm.com/support/docview.wss?uid=swg1PM85208).
While Windows symbols can be downloaded for a particular build (see retail symbols in https://msdn.microsoft.com/en-us/windows/hardware/gg463028), in general, it is better to use the Microsoft Symbol Server which will download any matching symbols on demand. If you are debugging a core dump from a machine other than your own that is running a different version of Windows, then using the Microsoft Symbol Server is the best approach:
The common Microsoft debugging tools use the SymSrv technology if you provide the correct symsrv syntax in the _NT_SYMBOL_PATH environment variable. These tools automatically include whatever you provide in the variable as the symbol path.
You can set this variable as a system variable or as a user environment variable. To do this from the desktop, right-click My Computer, and then click Properties. On the Advanced tab, click Environment Variables.
You can also set this variable temporarily at a command prompt. In this way, all applications that you start through the command prompt inherit this setting.
https://support.microsoft.com/kb/311503 and https://msdn.microsoft.com/en-us/library/windows/hardware/ff558829(v=vs.85).aspx
Example:
> set _NT_SYMBOL_PATH = SRV*c:\symbols\*http://msdl.microsoft.com/download/symbols
> windbg
In the above example, symbols downloaded from the symbol server will be cached locally in the c:\symbols\ folder for future use.
For WAS, assuming WAS in C:\Program Files\IBM\WebSphere\AppServer, an example sympath would be:
C:\Program Files\IBM\WebSphere\AppServer\bin;C:\Program Files\IBM\WebSphere\AppServer\java\jre\bin\;C:\Program Files\IBM\WebSphere\AppServer\java\jre\bin\j9vm\;C:\Program Files\IBM\WebSphere\AppServer\bin\;srv*C:\symbols\*http://msdl.microsoft.com/download/symbols
If the machine does not have internet access, you can run "symchk /om" to get a list of symbols that are needed, then download that set of symbols from a machine that does have internet access using "symchk /im" and then copy the symbols over.
If you do not want to ship PDB symbols, then you should still save PDBs for each build and make them available to support engineers. Ideally, these can be offered through a custom symbol server:
"Setting up a symbol server on your own local network is as simple as creating a file share on a server... To add, delete or edit files on a symbol server share, use the symstore.exe tool." (https://msdn.microsoft.com/en-us/library/ee416588(v=vs.85).aspx)
For external use, an HTTP symbol server can be setup using IIS on top of the symbol directory.
You can find all the PDBs in a directory using *.pdb in explorer.exe search or from a command line (https://technet.microsoft.com/pt-pt/library/cc754900(v=ws.10).aspx):
for /r %i in (*) do @echo %ftzai | findstr pdbAnother way to see if a PDB file is corrupt (https://msdn.microsoft.com/en-us/library/windows/hardware/ff560157(v=vs.85).aspx and https://msdn.microsoft.com/en-us/library/windows/desktop/ee416588(v=vs.85).aspx):
> "C:\Program Files (x86)\Windows Kits\8.0\Debuggers\x64\symchk.exe" /v module.dll /s DIRECTORYWITHPDB
Success: DBGHELP: private symbol & lines
Failure: FAILED - built without debugging information
See if a PDB file is corrupt:
> "C:\Program Files (x86)\Windows Kits\8.0\Debuggers\x66\pdbcopy.exe" somefile.pdb test.pdb -p
Can't open pdb file...Error: EC_CORRUPT
Desktop Heap
Windows Desktop Heaps are limited areas of virtual memory allocated for programs that use functions in user32.dll: "The desktop heap stores certain user interface objects, such as windows, menus, and hooks. When an application requires a user interface object, functions within user32.dll are called to allocate those objects. If an application does not depend on user32.dll, it does not consume desktop heap." (https://blogs.msdn.microsoft.com/b/ntdebugging/archive/2007/01/04/desktop-heap-overview.aspx, https://support.microsoft.com/kb/184802).
BIOS and UEFI
BIOS and UEFI are firmware for launching the operating system. BIOS is often accessed through a hotkey during boot. In some cases, UEFI cannot be access through a hotkey during boot and instead is accessed with:
- Windows 8: Start } Settings } Change PC Settings } General } Advanced startup } Restart Now } Troubleshoot } Advanced options } UEFI Firmware Settings } Restart
- Windows 10/11: Start } Settings } Update & Security } Recovery } Advanced startup } Restart now } Troubleshoot } Advanced options } UEFI Firmware Settings } Restart
Hosts file
The hosts
file is located at
%WinDir%\System32\drivers\etc\hosts
A non-comment line is an IP address followed by whitespace followed by the hostname.
Signals
Windows supports a subset of POSIX C signals:
- SIGINT (2)
- SIGILL (4)
- SIGABRT (6)
- SIGFPE (8)
- SIGSEGV (11)
- SIGTERM (15)
- SIGBREAK (21)