Message Driven Beans (MDBs)
You can choose Activation Specifications or Listener Ports for handling MDBs:
- Listener ports are "stabilized" and you should use Activation Specifications instead: https://www.ibm.com/support/knowledgecenter/SSAW57_8.5.5/com.ibm.websphere.nd.doc/ae/tmj_adm32.html
- Listener Ports follow the principle of the Application-Service-Facility (ASF) part of the JMS specification and thus they poll for messages from the destinations. Activation Specifications on the other hand work on the principle of callbacks and notifications, so there is no polling involved.
- Listener Ports are not portable, whereas Activation Specifications are portable across JEE environments.
- Activation Specifications are better in performance due to the nature of callbacks: the moment a message is available on the destination the message provider notifies the consumers. For Listener Ports, the thread has to constantly poll for messages. Once a message is found, it has to spawn a new thread, pass the message reference to the other thread so that the other thread can actually do a get.
Activation Specifications
MDB concurrency is the primary tuning variable, along with the thread pool on which MDBs execute:
- SIBus MDB concurrency set with: Maximum Concurrent MDB invocations per endpoint. Updates to this value require a restart of the messaging cluster.
- WebSphere MQ Messaging Provider concurrency set with: Advanced Properties } Maximum Server Sessions or maxConcurrency
The batch size is how many messages are queued up in front of each MDB.
Pause an Activation Specification using `wsadmin -lang jython`:
AdminControl.invoke(AdminControl.queryNames("*:type=J2CMessageEndpoint,ActivationSpec=jms/testactivationspec1,*"), "pause")
J2CA0524I: The Message Endpoint ... is deactivated.
Resume an Activation Specification using `wsadmin -lang jython`:
AdminControl.invoke(AdminControl.queryNames("*:type=J2CMessageEndpoint,ActivationSpec=jms/testactivationspec1,*"), "resume")
J2CA0523I: The Message Endpoint ... is activated.
Get status of an Activation Specification using `wsadmin -lang jython`:
GetStatus: AdminControl.invoke(AdminControl.queryNames("*:type=J2CMessageEndpoint,ActivationSpec=jms/testactivationspec1,*"), "getStatus")
1 (Active), 2 (Inactive), 3 (Stopped).
Listener Ports
MDB concurrency is the primary tuning variable, along with the thread pool on which MDBs execute:
- MDB concurrency set with: Maximum Sessions
Stop a listener port using `wsadmin -lang jython`:
AdminControl.invoke(AdminControl.queryNames("*:type=ListenerPort,name=LPNAME,process=server1,*"), "stop")
WMSG0043I: MDB Listener... stopped...
Start a listener port using `wsadmin -lang jython`:
AdminControl.invoke(AdminControl.queryNames("*:type=ListenerPort,name=LPNAME,process=server1,*"), "start")
WMSG0042I: MDB Listener... started successfully...
Print if a listener port is started or not via `wsadmin -lang jython`:
AdminControl.getAttribute(AdminControl.queryNames("*:type=ListenerPort,name=LPNAME,process=server1,*"), "getStatus")
Returns true or false
Background on how listener ports work:
- How message-driven bean listener ports use the connection pool: http://www.ibm.com/developerworks/websphere/library/techarticles/0707_titheridge/0707_titheridge.html
- How the maximum sessions property on the listener port affects WebSphere Application Server performance: http://www.ibm.com/developerworks/websphere/library/techarticles/0602_kesavan/0602_kesavan.html
- Get the most out of high performance message-driven beans and WebSphere Application Server: http://www.ibm.com/developerworks/websphere/library/techarticles/0508_parkinson/0508_parkinson.html
Service Integration Bus (SIB)
The Service Integration Bus is a pure Java JMS provider built into WAS:
- Bus: Group of messaging engines
- Bus Member: Hosts messaging engine
- Messaging Engine (ME): Handles destinations (queues, topics), connections, and messages
- ME Cluster Policy:
- High availability: ME(s) will failover to other available cluster members
- Scalability: Each cluster member runs an ME
- Both: Each ME may failover to one other cluster member
For Activation Specifications, messages are processed on the SIBJMSRAThreadPool thread pool. Network communication is processed on the SIBFAP*ThreadPool thread pool. Therefore, the sum of the maximum concurrent invocations per endpoint for all Activation Specifications should be less than or equal to the maximum size of the SIBJMSRAThreadPool thread pool.
For listener ports, messages are processed on the MessageListenerThreadPool thread pool. Therefore, the sum of the maximum sessions for all listener ports should be less than or equal to the maximum size of the MessageListenerThreadPool thread pool.
SIB properties set in the administrative console take precedence over properties set in the sib.properties file.
Tune the maximum concurrent endpoints and maximum batch sizes: https://www.ibm.com/support/knowledgecenter/SSAW57_8.5.5/com.ibm.websphere.nd.doc/ae/tjn0027_.html
Set IBM_CLUSTER_ENABLE_ACS_DELAY_POSTING=true (https://www.ibm.com/support/knowledgecenter/SSAW57_8.5.5/com.ibm.websphere.nd.doc/ae/tjs0100_.html)
Consider increasing various data buffer sizes: https://www.ibm.com/support/knowledgecenter/SSAW57_8.5.5/com.ibm.websphere.nd.doc/ae/tjm0220_.html
There are several factors that affect SIBus performance. The more destinations there are hosted on a messaging engine, the longer it takes for the engine to start... If the same number of destinations are apportioned over more than one bus member, the startup time improves considerably. However, the drawback is that there are more network connections between the bus members, more overall resource usage, and that the configuration becomes more complex.
If you have many disjoint destinations in your bus being used by different applications, consider creating different buses
You must tune the environment so that messages are consumed at a rate slightly higher than the rate that they are produced. If the producer produces messages at a faster rate, the messages will overload the bus.
On z/OS, the control region adjunct (CRA) address space runs SIBus messaging engines and the MDBs run in the servants (http://www-01.ibm.com/support/knowledgecenter/SSAW57_8.5.5/com.ibm.websphere.nd.multiplatform.doc/ae/cprf_tunezmdb.html?cp=SSAW57_8.5.5%2F3-2-9-2-7).
If you are using durable subscriptions, explicitly set the activation specification configuration in the Administrative Console within the cluster that hosts the durable subscription home ME to Target type = Messaging engine name, Target Significance = Required, and Target = Durable subscription home messaging engine. Otherwise, remote GETs may occur in some situations (particularly failover) and they are pointless overhead (both CPU and memory) for durable subscriptions. Background: http://www.ibm.com/developerworks/websphere/library/techarticles/0811_roberts/0811_roberts.html
If SIB is using a database message store, after SIB has started, it checks the database to ensure a lock every 20 seconds. If this check fails due to a fatal database exception and jdbcFailoverOnDBConnectionLoss = true (default), then this will lead to the JVM shutting itself down (through an HAM panic) to force a SIB failover to another JVM. If jdbcFailoverOnDBConnectionLoss = false, SIB will continue trying to get the lock every 20 seconds (during which there is a potential for data loss). If another highly available cluster member is running, the high availability manager will automatically start the messaging engine on another running server. During SIB startup, the properties jdbcInitialDatasourceWaitTimeout (default 15 minutes) and jdbcStaleConnectionRetryDelay (default 2 seconds) are used to retry errors during startup: http://www-01.ibm.com/support/knowledgecenter/SSAW57_8.5.5/com.ibm.websphere.nd.doc/ae/tjm_tunedbconn.html.
Message Reliability
The SIBus provides five different levels of reliability.
- Best effort non-persistent
- Express non-persistent
- Reliable non-persistent
- Reliable persistent
- Assured persistent
Persistent messages are always stored to some form of persistent data store, while non-persistent messages are generally stored in volatile memory. There is a trade-off here between reliability of message delivery and the speed with which messages are delivered. The further the reliability level decreases, the faster messages can be processed (http://www.ibm.com/developerworks/websphere/techjournal/0909_blythe/0909_blythe.html)
Non-persistent message reliability may cause a significant throughput improvement. In one benchmark, 29% (http://www.ibm.com/developerworks/websphere/techjournal/0909_blythe/0909_blythe.html).
If you are using mediations and not using assured persistent messages, consider skipping the well formed check: https://www.ibm.com/support/knowledgecenter/SSAW57_8.5.5/com.ibm.websphere.nd.doc/ae/tjp0032_.html
Message Store
Message store type (http://www.ibm.com/developerworks/websphere/techjournal/0909_blythe/0909_blythe.html)
- Local Derby database data store: With this option, a local, in-process Derby database is used to store the operational information and messages associated with the messaging engine. Although convenient for development purposes, this configuration uses valuable cycles and memory within the application server to manage the stored messages.
- File-based data store: (default) If the message engine is configured to use a file-based data store, operating information and messages are persisted to the file system instead of a database. This performs faster than the local Derby database and, when a fast disk such as a redundant array of independent disks (RAID) is used, can perform just as fast as a remote database. The test results shown below did not use a RAID device for the file-based data store and do not reflect this additional improvement.
- Remote database data store: In this configuration, a database residing on a remote system is configured to act as the message engine data store. This frees up cycles for the application server JVM process that were previously used to manage the Derby database or file-based stores, enabling a more performant, production level database server (such as IBM DB2® Enterprise Server) to be used. One technical advantage of using a database for the data store is that some J2EE™ applications can share JDBC connections to benefit from one-phase commit optimization. For more information see information on sharing connections to benefit from one-phase commit optimization. File store does not support this optimization.
Using a remote data store may cause a significant throughput improvement. In one benchmark, 55% (http://www.ibm.com/developerworks/websphere/techjournal/0909_blythe/0909_blythe.html).
IBM DB2: "To get the best performance from messages in the 3 KB to 20 KB range, you should consider putting the SIBnnn tables into a tablespace with 32 KB pages and adjusting the column width of the VARCHAR column to 32032 bytes." (https://www.ibm.com/support/knowledgecenter/SSAW57_8.5.5/com.ibm.websphere.nd.doc/ae/cjm0470_.html)
The File store log directory can be specified during the creation of an SIBus member using the -logDirectory option in the AdminTask addSIBusMember command or via the administration console SIBus Member creation panels. This should be moved to fast disks.
If statistics suggest a concurrency bottleneck on the SIBnnn tables for a data store, you might try to solve the problem by increasing the number of tables: https://www.ibm.com/support/knowledgecenter/SSAW57_8.5.5/com.ibm.websphere.nd.doc/ae/tjm0240_.html
Monitoring
The CWSID0016I message indicates the state of messaging engines. For example:
000000fe SibMessage    I   [:] CWSID0016I: Messaging engine ${NAME} is in state Starting.
000000fe SibMessage    I   [:] CWSID0016I: Messaging engine ${NAME} is in state Joining.
000000fe SibMessage    I   [:] CWSID0016I: Messaging engine ${NAME} is in state Joined.
000000fe SibMessage    I   [:] CWSID0016I: Messaging engine ${NAME} is in state Started.
000000fe SibMessage    I   [:] CWSID0016I: Messaging engine ${NAME} is in state Stopping.
000000fe SibMessage    I   [:] CWSID0016I: Messaging engine ${NAME} is in state Stopped.
The printSIBusSummary.py script may be used to print the details of all messaging engines in all buses: http://www-01.ibm.com/support/knowledgecenter/SSAW57_8.5.5/com.ibm.websphere.nd.multiplatform.doc/ae/tjo0060_.html?cp=SSAW57_8.5.5&lang=en
Important PMI metrics:
- JCA Connection Factory: PoolSize-FreePoolSize, UseTime, WaitTime
- SIB Service > SIB Messaging Engines > * > Destinations > Queues
- AvailableMessageCount: Number of messages available for consumption from this queue
- AggregateMessageWaitTime: Total amount of time spent in the bus by messages consumed from this queue
- UnavailableMessageCount: Number of messages on this queue but not available for consumption
- TotalMessagesProducedCount: Total number of messages produced to this queue
- LocalConsumerCount: Number of local consumers currently attached to this queue
- LocalProducerCount: Number of local producers currently attached to this queue
- LocalMessageWaitTime: Total amount of time spent on this queue by messages consumed from this queue
- TotalMessagesConsumedCount: Total number of messages consumed from this queue
- Enterprise Beans
- MessageBackoutCount: The number of backed out messages that failed to be delivered to the onMessage method of the bean (applies to: message-driven beans).
- MessageCount: The number of messages delivered to the onMessage method of the bean (applies to: message-driven beans).
- MethodResponseTime: The average response time in milliseconds on the remote methods of the bean.
- ActiveMethodCount: Average concurrently actively called methods.
- SIB Service > SIB Messaging Engines > * > Storage Management > Data Store
- JDBCTransactionTime: Total execution time of internal batches
- PersistentDispatcherAvoidanceCount: Measures the number of operations on reliable persistent data dispatched for writing to the data store but whose writing was subsequently unnecessary.
- SIB Service > SIB Messaging Engines > * > Storage Management > File Store
- FileStoreLogSpace: Space in bytes left in the file store log
- FileStorePermanentObjectStoreSpace: Space in bytes left in the file store permanent store
Message Visibility/Message Gathering
Message visibility/message gathering may be used to consume messages from all available queue points of a destination. This may be useful when cluster members have different configurations or processing speeds; however, message visibility itself has a very high performance overhead (http://www-01.ibm.com/support/knowledgecenter/SSAW57_8.5.5/com.ibm.websphere.nd.multiplatform.doc/ae/cjt0024_.html?lang=en). In general, using a single, highly available, clustered destination will probably perform better in the case of differing node performance.
Read ahead
Read ahead will preemptively mark messages so that they can be flowed down a client connection and made available for a consumer to receive before explicitly requested. The default behaviour is for this to be used for non-durable and unshared durable subscribers (where there can only be a single consumer receiving a subscription message at any one time). The reason for this is that in both these cases, once messages are assigned for a particular subscription, there should only be one consumer at a time that can attempt to receive those messages. So, if messages are marked, but for some reason the consumer doesn't receive them (for example, either because work is rolled back or the consumer is closed before receiving all the messages) then those messages can be unmarked on the destination without affecting any other consumers. While read ahead can provide some performance benefit in simple scenarios, it can be disabled if problems arise in more complicated scenarios.
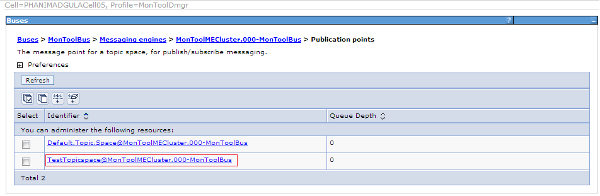
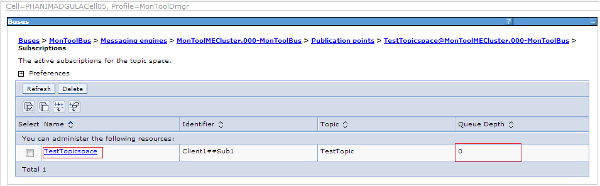
Administrative Console Monitoring
In recent versions of WAS, the administrative console provides basic monitoring on the Runtime tab of the Messaging Engine.
Publication point queue depth:
Subscription queue depth:
Service Integration Bus Destination Handler
The IBM Service Integration Bus Destination Handler tool is a free download that can view, move, copy, delete and restore messages: https://www.ibm.com/support/pages/ibm-service-integration-bus-destination-handler-version-11
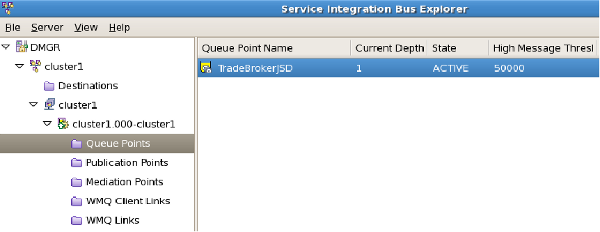
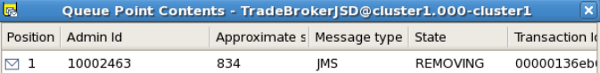
Service Integration Bus Explorer
SIB Explorer is a free download to monitor SIBus: https://www.ibm.com/support/pages/service-integration-bus-explorer
Service Integration Bus Performance
SIB Performance is a free download to monitor SIBus performance: https://www.ibm.com/support/pages/service-integration-bus-performance
Useful PMI Statistics
} SIB Service > SIB Messaging Engines > messaging_engine_name > Destinations > Queues
}} QueueStats.AggregateMessageWaitTime
}} QueueStats.AvailableMessageCount
}} QueueStats.TotalMessagesConsumedCount
}} QueueStats.TotalMessagesProducedCount
}} QueueStats.UnavailableMessageCount
} SIB Service > SIB Communications > Messaging Engines > Standard
}} MEStats.BufferedReadBytes
}} MEStats.BufferedWriteBytes
}} MEStats.MessageBytesRead
}} MEStats.MessageBytesWritten
} Enterprise Beans
}} MethodCallCount
}} MethodResponseTime
}} MessageCount \
} Thread Pools
}} ActiveCount
Advanced ME Tuning
You can also try these ME properties one by one (restart the ME each time). Remember to remove each property after each test if it's not helpful.
- sib.msgstore.cachedDataBufferSize=80000000
- sib.msgstore.jdbcWriteMaxBytesPerBatch=8000000
- sib.msgstore.jdbcWriteMaxTasksPerBatch=128
- sib.msgstore.jdbcWriteThreads=16
- sib.msgstore.transactionSendLimit=200
- sib.msgstore.jdbcWriteRate=160
Lightweight Tracing
To investigate activation specification maxConcurrency (search for maxWorkCount in the client):
- Client:
*=info:com.ibm.ws.sib.ra.inbound.impl.SibRaSingleProcessListener=all:com.ibm.ws.sib.ra.inbound.impl.SibRaDispatcher=all - ME:
*=info:com.ibm.ws.sib.comms.server.clientsupport.CATAsynchConsumer=all:com.ibm.ws.sib.comms.server.clientsupport.StaticCATConnection=all:com.ibm.ws.sib.processor.impl.ConsumerDispatcher=all
WebSphere MQ Messaging Provider
Messages are processed on the WMQJCAResourceAdapter thread pool. Therefore, the sum of the maximum concurrent invocations per endpoint for all Activation Specifications should be less than or equal to the maximum size of the WMQJCAResourceAdapter thread pool.
MDB Response Times
Request Metrics (covered earlier) can be used to track the response times of individual MDB transactions:
- Ensure "Prepare Servers for Request metrics collection" is checked
- Select "Custom" for "Components to be instrumented" and select "JMS" and any other relevant components
- Set "Trace level" to "Hops"
- Check "Standard Logs"
Simply save and synchronize the changes and request metrics is dynamically enabled.
Here is an example where a servlet calls a stateless session bean which puts a message on a queue. Then an Activation Specification reads from this service integration bus queue to parse the message and sleep one second. Here is the output in SystemOut.log:
[4/17/14 8:56:48:531 PDT] 00000028 SystemOut     O TestMDB received message
[4/17/14 8:56:48:529 PDT] 00000021 PmiRmArmWrapp I   PMRM0003I:  parent:ver=1,ip=127.0.0.1,time=1397749842692,pid=21621,reqid=8,event=1 - current:ver=1,ip=127.0.0.1,time=1397749842692,pid=21621,reqid=8,event=1 type=URI detail=/TestAdvancedWeb/Test elapsed=78
[4/17/14 8:56:49:563 PDT] 00000028 PmiRmArmWrapp I   PMRM0003I:  parent:ver=1,ip=127.0.0.1,time=1397749842692,pid=21621,reqid=8,event=1 - current:ver=1,ip=127.0.0.1,time=1397749842692,pid=21621,reqid=4097,event=1 type=JMS detail=queue1 elapsed=1034
The "type=JMS" line indicates that an MDB has finished processing, the detail field shows the WAS queue name, and the elapsed field shows it took 1034ms. Interestingly, I also had the Servlet component enabled in request metrics, and you can see that the "parent" of the JMS line is the "current" of the servlet line, which means the correlation crosses some boundaries and allows us to know that this message was processed from the same transaction as that particular servlet invocation. This is very useful for tracking asynchronous requests.
JMS Connections Explained
When an application obtains a J2EE Managed connection, which includes JMSConnections obtained from a (JCA managed) connection factory looked up in the J2EE app server's naming context, the J2C connection manager owns/manages the JMS Connection, what the application is given is a wrapper (an instance of the JMSConnectionHandle class which implements the JMS Connection interface). It is this connection handle that is 'closed' by the container/J2C - once it is closed further attempts to use the connection handle (for example to create a session) will fail with javax.jms.IllegalStateException: Connection closed
Once closed the connection handle cannot be re-opened.
When looking in the connection pool what they see are the JMS Connections that the J2C connection manager is managing (technically it actually manages javax.resource.spi.ManagedConnection objects which themselves are wrappers to the actual JMS Connection, and the connection handles). JMS Connections are not closed when the close is called (on the connection handle) but returned to the pool (...for unshared - for shared they are available for reuse until returned to the freepool when the transaction context ends).
NOTE that the handle is closed in compliance with the J2EE connector architecture specification. The close of the handle is NOT part of the transaction context (JTA or LTC) ending but performed by the container in concert with J2C as part of application component instance lifecyle management as per the JCA spec. While it is absolutely correct that JMS Connections are required by the JMS specification to be thread safe and are non-Transactional, they are still managed connections in a J2EE app server environment.
In other words, the issue here is NOT that managed JMS Connections cannot be reused under different LTCs, it is that the handles to the managed connections are closed, rendering them unusable, as part of the interaction between J2C and the container managing the lifecycle of the application component instance. It just looks like an LTC association is causing the issue (which is indeed non-sensical for JMS Connections and no such association exists in WAS) because LTCs tend to be associated with invocations of app component instances which themselves are associated with their lifecycle. (I note this contradicts an earlier update regarding connection handles being closed at LTC completion.
However, there is therefore scope for caching the connection handle inside a stateful session bean since the bean instance will persist over invocations of the SFSB - however passivation of the SFSB would need to be accounted for, as would connection failure handling.
The above approach is generally discouraged since J2C is managing connections and it is generally a bad idea for two entities to attempt to manage the same resource - which effectively is what the app would be attempting to do by caching+reusing the connection. It is also worth noting that JMS connections themselves may not map one-to-one with the actual TCP connections to the QMGR and a large number of them may not pose a resource issue, for example WMQ multiplexes a configurable number of multiple JMS connections and sessions down the same TCP connection though this will be JMS provider specific.
An alternative is to use J2SE JMS. Using this alternative means using a non JCA managed connection factory which will produce non-managed connections and non-managed sessions. Management
(caching/reuse/threading/connection failure etc) of the connections/sessions etc is then the sole responsibility of the application. Any work performed against the sessions would not be enlisted with transactions (LTC or JTA) - they would behave just as they would in a J2SE environment.
Sizing Thread Pools for Message Driven Beans
Whether you're using the older listener ports or the newer activation specifications, tuning the relevant thread pools is a key aspect of MDB performance. Thread pools are configured at a server level, while the number and concurrency of the MDBs is configured independently. Therefore, if your maximum thread pool size is too small, messages may queue unnecessarily. Below are equations for the most common setups which define how to setup the relevant thread pool maximums to avoid queuing. The x=1..n items are all the items of that type processing MDBs for that server (which may be configured at a higher scope). The thread pool maximum size is not the only variable -- the JVM heap, OS resources, etc. also have to be able to support the configured concurrency.
Default Messaging Provider (SIBus):

WebSphere MQ Messaging Provider:

Listener Ports:

Previous Section (EJBs) | Next Section (Web Services) | Back to Table of Contents