Diagnosing problems with WebSPhere requests
IBM HTTP Server 6.1 and WebSphere Application Server 6.1 plug-in and later contain new features for solving problems with web server/plug-in/app server requests. For older releases, please refer to this document.
Problems occasionally encountered with WebSphere applications include
unresponsive behavior
slow response times
failed requests
When WebSphere requests are routed through IBM HTTP Server using the WebSphere plug-in, the same symptoms may have different causes, such as:
problems with authentication modules used within IBM HTTP Server
network problems encountered by WebSphere plug-in when communicating with WebSphere
other issues within IBM HTTP Server which are unrelated to WebSphere
Often, the component encountering the failure is determined by increasing the log level in the WebSphere plug-in then checking the plug-in log after reproducing the problem. Understanding and using IBM HTTP Server serviceability features can decrease the need for more plug-in logging and reduce the time required to locate the cause of a problem for requests routed through IBM HTTP Server to WebSphere Application Server.
Monitoring active requests
The mod_status module provides a view into current web server processing using a web browser. The administrator requests a special URL from the web server to see the internal state. Typically this special URL is protected with some form of authentication or access control
Preparation
A typical configuration follows:
    #
    # ExtendedStatus controls whether Apache will generate "full" status
    # information (ExtendedStatus On) or just basic information (ExtendedStatus
    # Off) when the "server-status" handler is called. The default is Off.
    #
    LoadModule status_module modules/mod_status.so
    <IfModule mod_status.c>
    ExtendedStatus On
    </IfModule>

    ...

    #
    # Allow server status reports generated by mod_status,
    # with the URL of http://servername/server-status
    # Change the ".example.com" to match your domain to enable.
    #
    <Location /server-status>
        SetHandler server-status
        Order deny,allow
        Deny from all
        Allow from .example.com
    </Location>
Note the protection for this special page: any client with a client IP address as seen by the web server that resolves to *anything*.example.com will be allowed to request the page. Some environments will require a different form of protection, such as entering a user id or password. This URL can be protected using any available protection mechanisms, including LDAP and password files.
Using the status display
The status page is retrieved by loading
http://www.example.com/server-status/?showmodulestate in the browser.
Snapshots of the important part of the report are shown below.
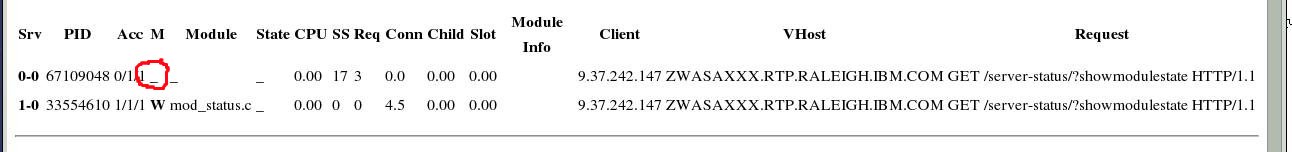
Viewing an unused thread
Look for a value of "_" for the M field. This request has finished and the thread is unused.
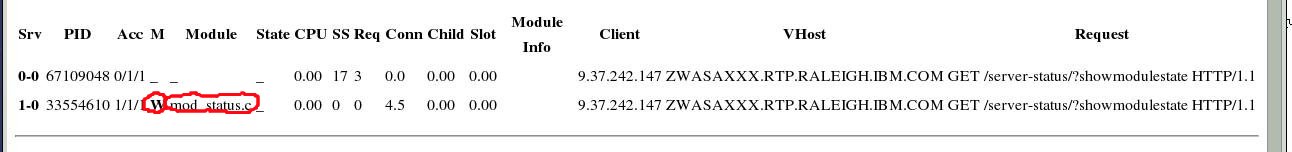
Viewing an active mod_status request
Look for a value of "W" for the M field and a value of mod_status.c for the Module field.
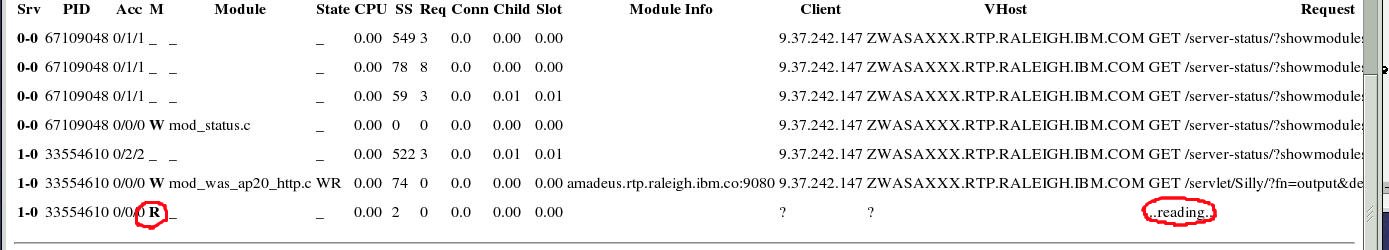
Viewing a request being read by the web server
Look for a value of "R" for the M field and a value of "..reading.." for the Request field.
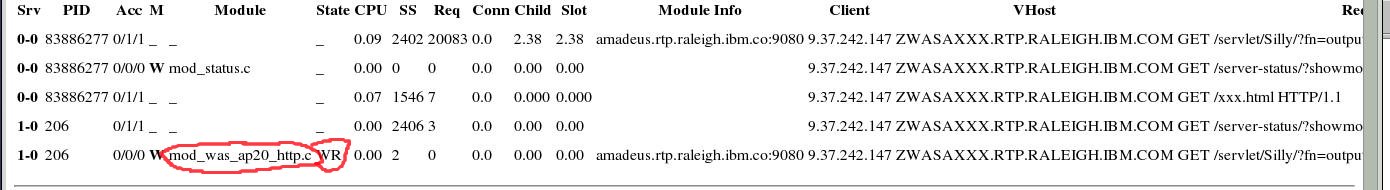
Viewing a request being processed by the WebSphere plug-in
Look for a value of "mod_was_ap20_http.c" for the Module field.
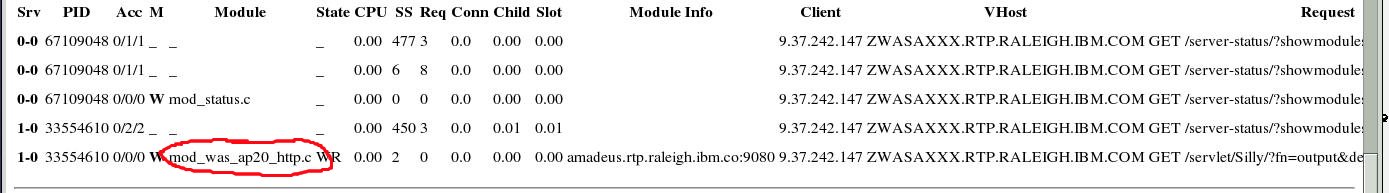
Viewing a request where the plug-in is waiting for a response from the application server
Look for "mod_was_ap20_http.c" for the Module field and "WR" for the State field.
Viewing a request where the plug-in is actively reading a response from the application server
Look for "mod_was_ap20_http.c" for the Module field and "RB" for the State field.

Other values for the State field:
- DQ
- Plug-in is performing DNS query for the IP address of the server
- CN
- Plug-in is connecting to the server
- SB
- Plug-in is sending the request body
- WR
- Plug-in is waiting for the response line (request has been sent but no response has been sent by the application server)
- RB
- Plug-in is busy reading and sending the response from the application server
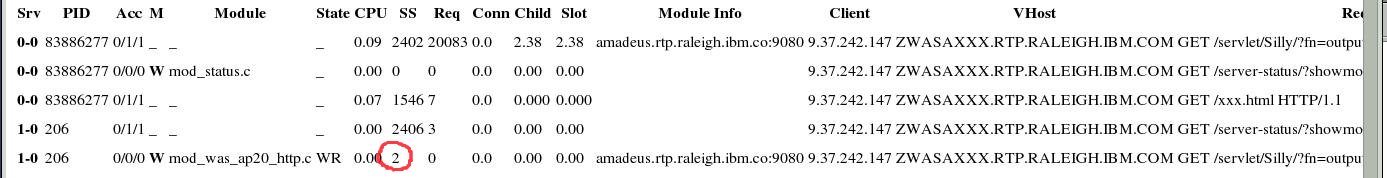
Determining how long the request has been active
See the SS field for the seconds since the start of the request.
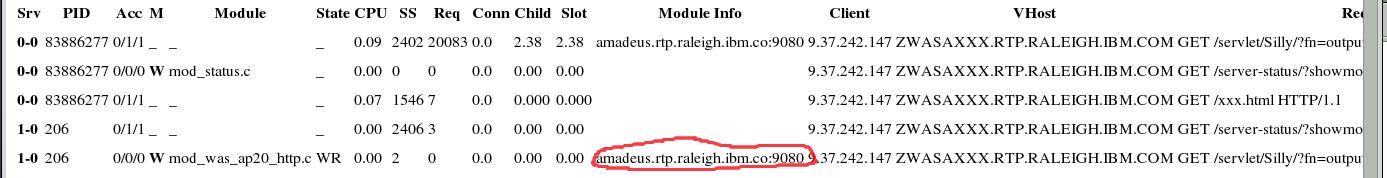
Determining which application server has been selected
Check the Module Info field. This is only valid for active requests where Module is "mod_was_ap20_http.c".
Checking the results of requests which have finished
The default access log format has been a standard for many years and is assumed by some log scanners. However, if the current log format can be extended without impacting log scanning scripts, additional information is recommended:
information about the module/plug-in handling the request
the name of the application server selected for this request
the response time in microseconds (not shown in examples below)
With this information, the adminstrator can often determine where the problem occurs (web server, application server) and whether the problem is specific to a particular application server.
Preparation
Here is a typical access log configuration:
    LogFormat "%h %l %u %t \"%r\" %>s %b" common
    ...
    CustomLog logs/access_log common
    ...
    <VirtualHost *:443>
    ...
    CustomLog logs/ssl_access_log common
    ...
    </VirtualHost>
Here is the updated configuration, which uses a different log format:
    LogFormat "%h %l %u %t \"%r\" %>s %b" common
    LogFormat "%h %l %u %t \"%r\" %>s %b %{RH}e %{WAS}e" was
    ...
    CustomLog logs/access_log was
    ...
    <VirtualHost *:443>
    ...
    CustomLog logs/ssl_access_log was
    ...
    </VirtualHost>
The %{RH}e field logs information about the module/plug-in which
handled the request.
The %{WAS}e field logs the name of the application server used for the
request.
The response time in microseconds can be logged by adding %D to the
format.
Using the additional access log information
mod_status request
The WAS field is "-" because this request isn't handled by the WebSphere plug-in.
9.37.242.147 - - [07/Nov/2006:14:21:56 -0500] "GET /server-status/?showmodulestate HTTP/1.1" 200 4668 (mod_status.c/0/handler) -
Normal 200 response from WebSphere request
The handling module is mod_was_ap20_http.c and the WAS field is set to the selected application server.
9.37.242.147 - - [07/Nov/2006:14:19:59 -0500] "GET /servlet/Silly/ HTTP/1.1" 200 418 (mod_was_ap20_http.c/-2/handler) amadeus.rtp.raleigh.ibm.co:9080
Client I/O error during WebSphere request
The handling module is mod_was_ap20_http.c and the WAS field is set to the selected application server. The plug-in sets the logged HTTP status code to 400 when I/O errors occur communicating with the client.
9.37.242.147 - - [07/Nov/2006:14:21:53 -0500] "GET /servlet/Silly/?fn=output&bytes=200000000 HTTP/1.1" 400 2490368 (mod_was_ap20_http.c/-2/handler) amadeus.rtp.raleigh.ibm.co:9080
File not found error for non-WebSphere request
The handling module is core.c instead of mod_was_ap20_http.c:
9.37.242.147 - - [07/Nov/2006:14:36:16 -0500] "GET /xxx.html HTTP/1.1" 404 326 (core.c/404/handler) -
File not found error for WebSphere request
The handling module is mod_was_ap20_http.c:
9.37.242.147 - - [07/Nov/2006:14:17:17 -0500] "GET /servlet/Silly/?fn=output&bytes=2000000" 404 59 (mod_was_ap20_http.c/-2/handler) amadeus.rtp.raleigh.ibm.co:9080