View the calculated information on a Monitor dashboard in the test
environment
- Right click on the Monitor Server on WebSphere ESB and
select WebSphere Business Monitor dashboard.
- Type admin for the user ID and admin for
the password and click Login.
- Click Dashboards and click New.
- Type MonitorAdapter for the name and then click OK.
- Add and configure and Instance items.
- Drag the 2nd palette icon (Instances)
to Add to Dashboard.
- Click Personalize and move some available
items to the Selected window and then click OK.
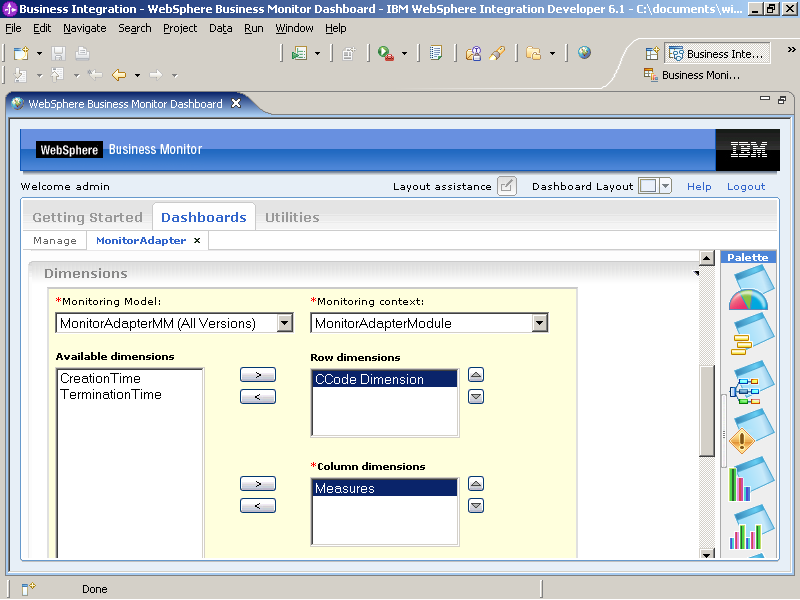
- Add and configure Dimensions item.
- Drag the 6th palette icon (Dimensions)
to Add to Dashboard.
- Click Personalize.
- In Available dimensions, select Measures and
move it to Column dimensions.
- In Available dimensions, select CCode Dimension and
move it to Row dimensions.
- Confirm that the window looks like the following example.
- Click OK.
- Double click All CCode Dimension.