The Processes Page

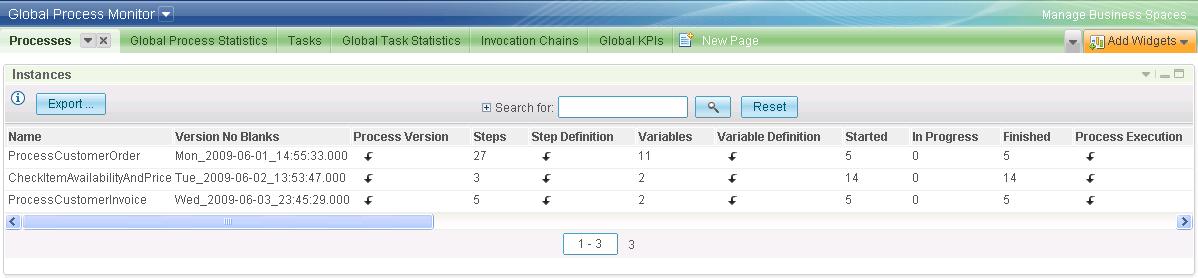
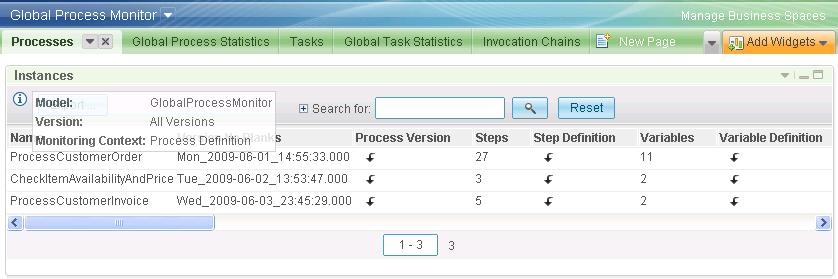
This page contains an Instances widget that allows to navigate the upper part of the monitor model shown in Figure 1. The first view shows the Process Definition level and may look like Figure 4.


Figure 4: First view of the Processes page (basic dashboard configuration)


There will be one row for each process definition that has been deployed and sends events. If events have arrived from several process versions, then the last version detected will be shown in the second column and earlier versions can be seen by following the Process Version link. The Step Definition, Variable Definition, and Process Execution links navigate downward from the root of the tree structure in Figure 1. The counts before each link indicate how many children will be found. For example, there are 27 different steps defined in the ProcessCustomerOrder process, and 11 different variables; 5 executions of this process have started and all 5 have finished. Detailed information about the 27 step definitions, the 11 variable definitions and the 5 process executions can be found by following the drill-down links. For example, clicking on the first Step Definition link may take you to a view like Figure 5.


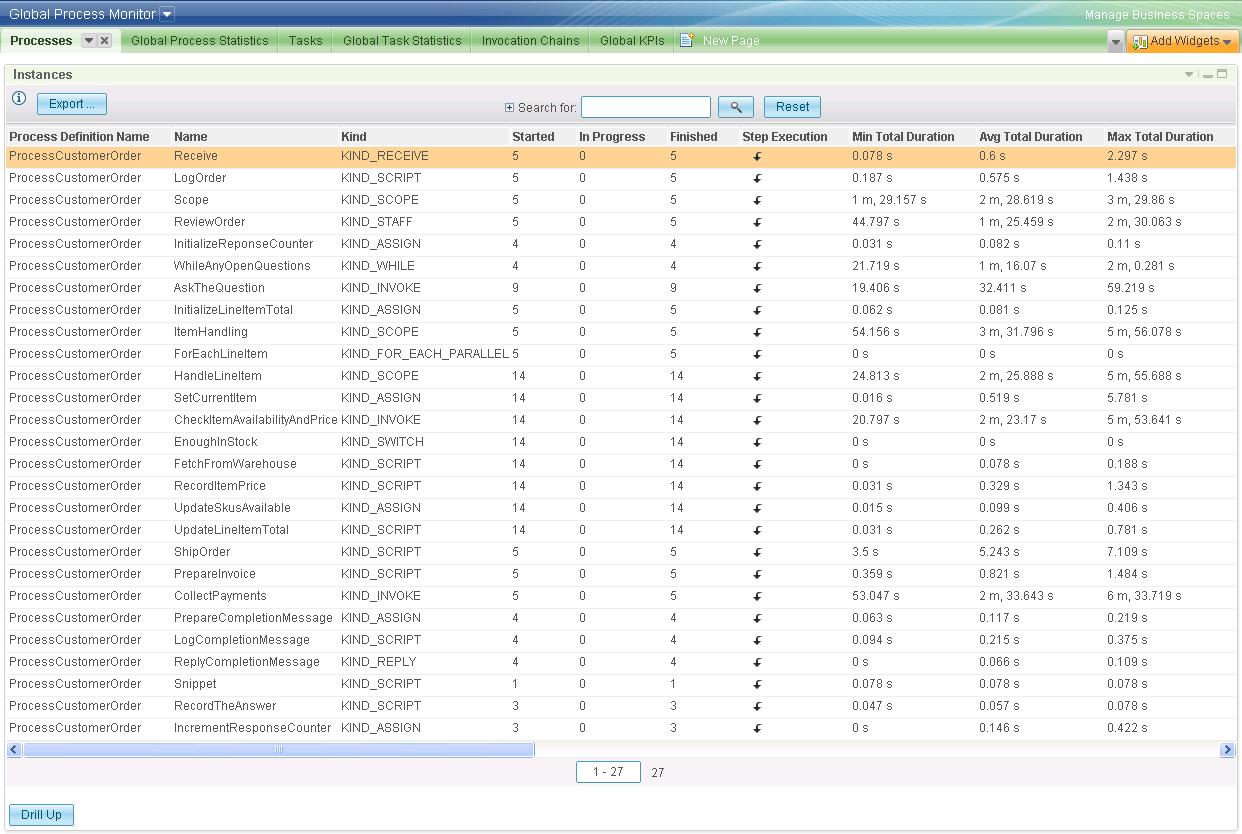
Figure 5: Drilling down to the Step Definition level (basic dashboard configuration)


One thing you see in Figure 5 is that the ProcessCustomerOrder process has run five times, but apparently not each of its steps has. Some steps, like InitializeResponseCounter, have run less than five times, because not all process runs follow the same path and steps are sometimes skipped. Other steps, like AskTheQuestion, have run more than five times because they are part of a loop. If you navigate to the Process Execution and then to the Process Execution Step level, you can see each step execution within a process run. Figure 6 for example shows an execution where AskTheQuestion ran three times in a row.


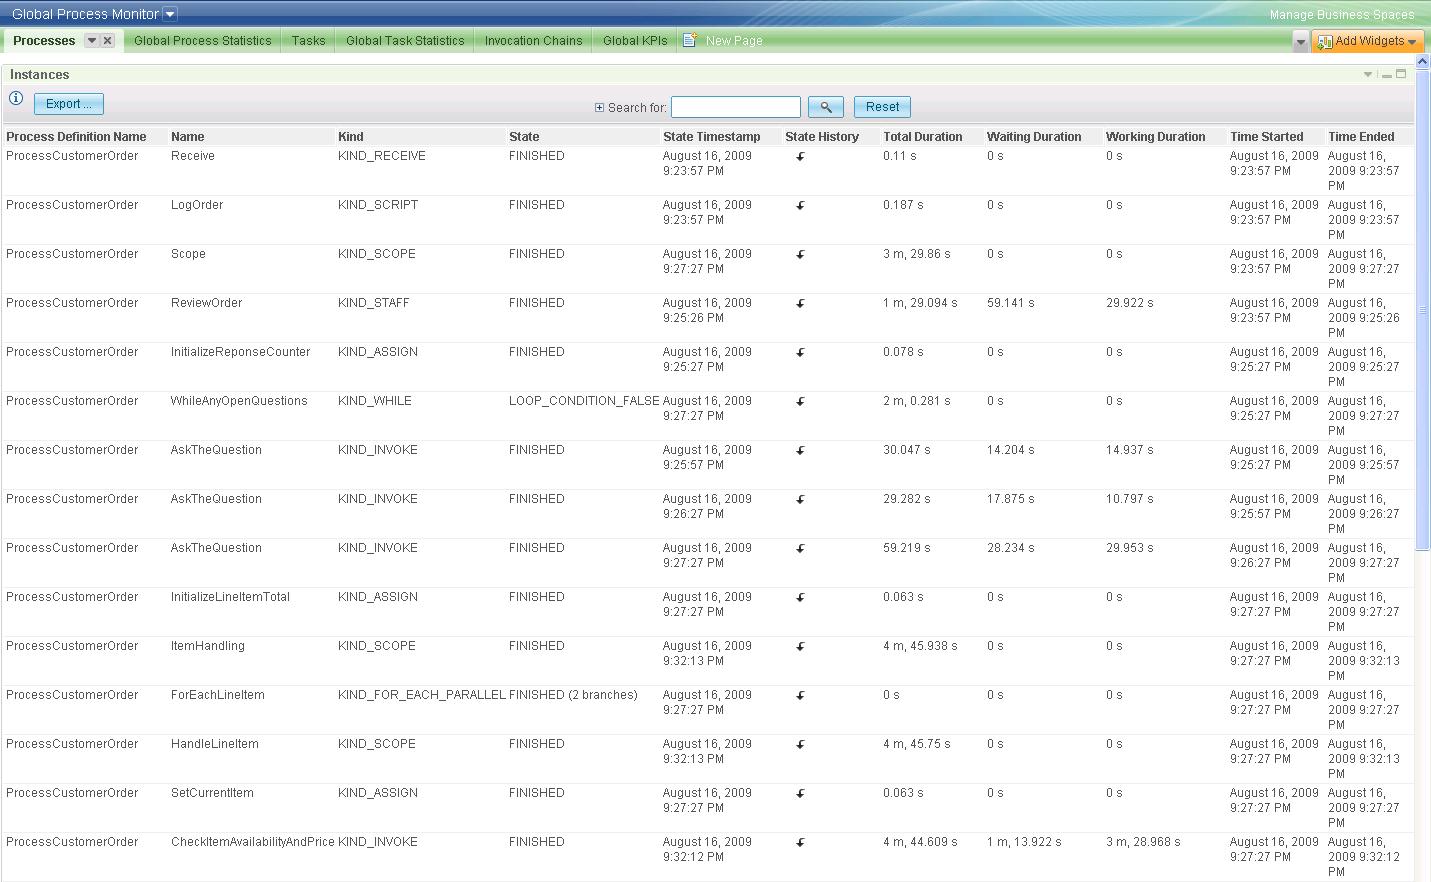
Figure 6: Drilling down to the Process Execution Step level (basic dashboard configuration)


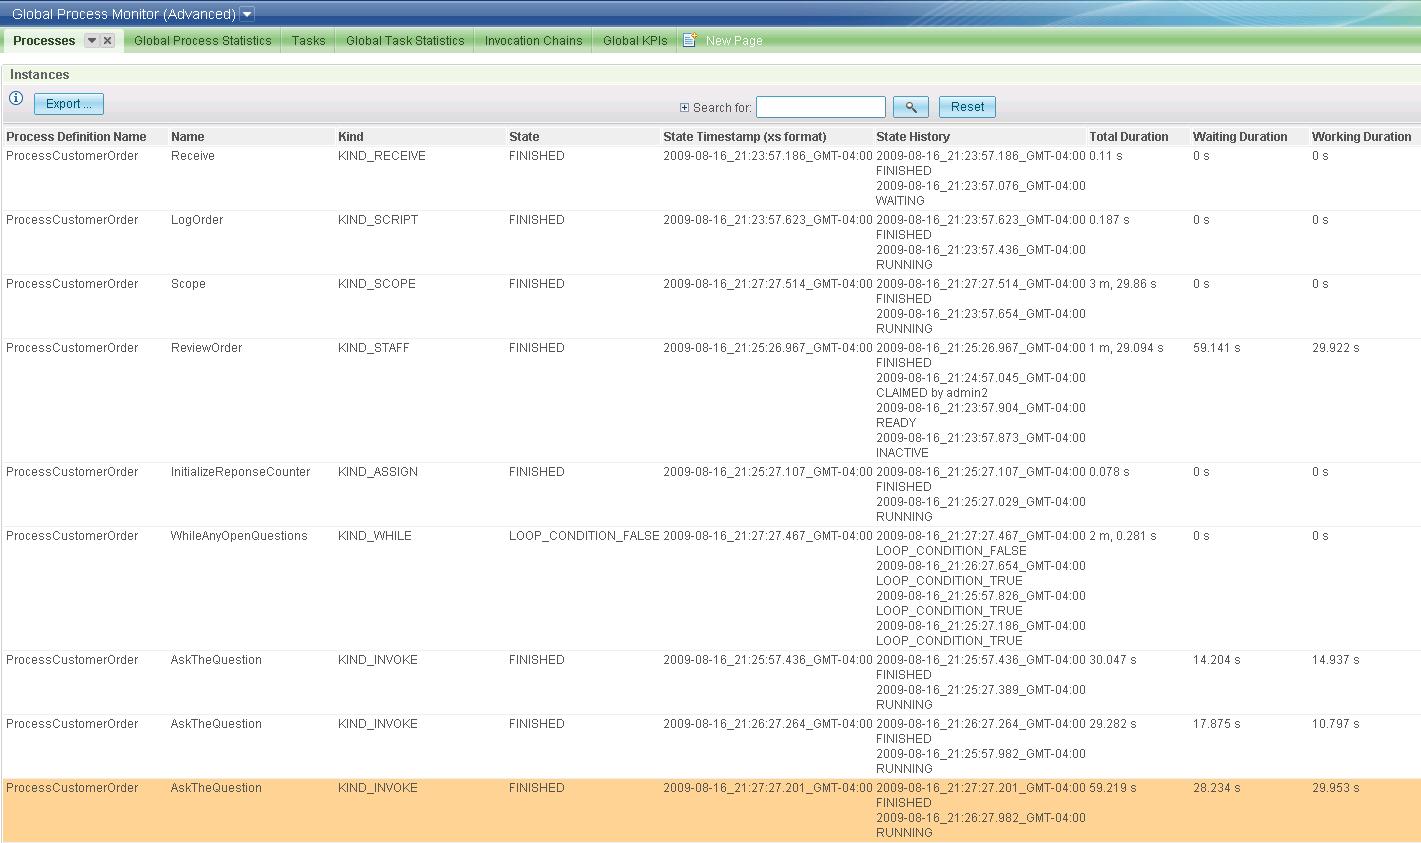
Figure 6 also brings out a slight formatting problem: unlike in preceding screen shots, rows are now several characters high. The reason is that blanks in the date/time fields cause them to wrap around and occupy several lines. To allow for a terser display, those blanks have been replaced by underscores in the advanced dashboard configuration (and for the same reason the Version No Blanks metric is shown instead of the Version metric in Figure 4). For comparison, the advanced dashboard equivalent of Figure 6 is shown in Figure 7. You should feel free to configure these views to your liking, replacing the locally formatted date/time metrics by their "xs format" versions, adding / dropping / rearranging columns, etc.


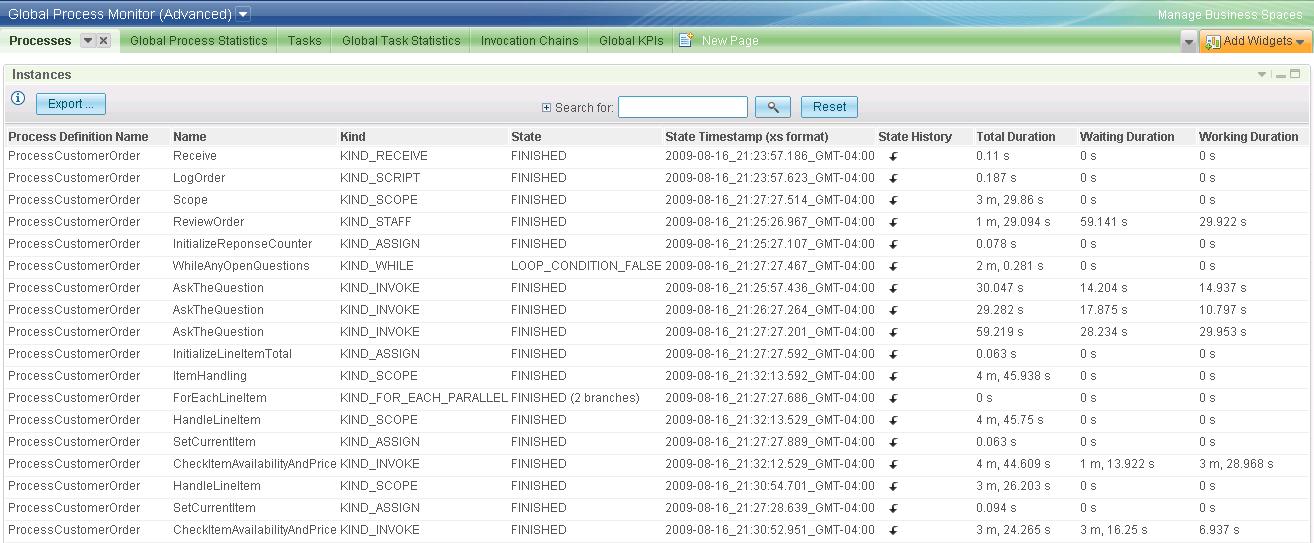
Figure 7: Advanced dashboard view of Figure 6


The examples above should give you a flavor of the kind of information that is available on the Processes page of the preconfigured dashboards. To cover everything would take over a dozen additional screen shots—besides the descriptions of metrics which has not even been started. Therefore, in order to document every monitoring context view that has been configured for the sample dashboards, the exposition will now switch from sample screen shots to using much more succinct, tabular views.


In the following tables, each monitoring context visible on the Processes page is described with all of its metrics. The Monitoring Context column shows the name of the monitoring context definition, which typically desginates the type of the monitored entity (Process Definition, Process Execution, etc.). Note that in dashboard views the monitoring context name is somwhat hidden: you can find it by hovering over the (i) symbol in the upper left hand corner, as shown in Figure 8.


Figure 8: Hovering over the (i) symbol to see the name of a monitoring context definition


The Metric column contains the names of all metrics defined for a monitoring context (some of those "metrics" are actually counters or timers, but those implementation details are not of interest here). Short, generic names, like Name, Kind, State, etc. should be read in conjunction with the name of the monitoring context. In Figure 6 and Figure 7 for example, the Name, Kind, and State metrics hold the name, kind, and current state of a process execution step (as those figures show Process Execution Step MCs). As mentioned previously, metrics marked by (B) in the tables that follow are only shown on the basic dashboard, metrics marked by (A) are only shown on the advanced dashboard, and metrics without any marker are shown on both. The Description column contains a short description of the metric, which often suffices to explain its meaning. The Comment column provides additional explanations or cross-references. The presentation follows the order of Figure 3.


As already mentioned, a Process Definition monitoring context is instantiated for each process definition that sends audit events. If the same process definition is deployed at different servers, the different deployed copies will be distinguished by the Deployed At metric. If events arrive from several versions of a given process deployed at a given server, then the last version will be shown in the Version No Blanks metric while earlier versions and their life spans can be seen by following the Process Version drill-down. Note that the monitor model also defines a Version metric, which contains the unaltered, original version timestamp. Feel free to reconfigure the dashboard and show that instead of Version No Blanks.

The waiting (working) duration of a process execution is the sum of the waiting (working) durations of all human tasks within that execution, and any sub-processes it invoked, recursively. Note that in processes where human tasks run in parallel, their aggregate waiting (working) durations can exceed the total duration of the process execution.

The meaning of the remaining metrics should be clear from their descriptions.


Monitoring Context

Metric

Description

Comment

Process Definition Name The name of this process definition. Sometimes called the process template name.
Version No Blanks The version timestamp with blanks replaced by underscores. Sometimes called the valid-from timestamp.
Process Version Drill-down link to a list of versions of this process definition. See table Process Version for details.
Deployed At The server on which the monitored process is running.
Steps The number of (known) steps of defined by this process. There could be more steps defined for this process, but steps that never run or don't emit audit events will not be detected.
Step Definition Drill-down link to a list of (known) steps of this process. See table Step Definition for details.
Variables The number of (known) variables of this process definition. There could be more variables defined for this process, but variables that are not used or don't emit audit events will not be detected.
Variable Definition Drill-down link to a list of (known) variables of this process. See table Variable Definition for details.
Started The number of process executions that have started.
In Progress The number of process executions that are in progress.
Finished The number of process executions that have finished.
Process Execution Drill-down link to a list of executions of this process. The number of child contexts will match the value of Started. See table Process Execution for a description of their metrics.
Min Total Duration The miminum total duration of all completed executions.
Avg Total Duration The average total duration of all completed executions.
Max Total Duration The maximum total duration of all completed executions.
StdDev Total Duration (A) The standard deviation of the total durations of all completed executions.
Sum Total Duration The summed up (aggregate) total duration of all completed executions.
Min Waiting Duration The miminum waiting duration of all completed executions.
Avg Waiting Duration The average waiting duration of all completed executions.
Max Waiting Duration The maximum waiting duration of all completed executions.
StdDev Waiting Duration (A) The standard deviation of the waiting durations of all completed executions.
Sum Waiting Duration The summed up (aggregate) waiting duration of all completed executions.
Min Working Duration The miminum working duration of all completed executions.
Avg Working Duration The average working duration of all completed executions.
Max Working Duration The maximum working duration of all completed executions.
StdDev Working Duration (A) The standard deviation of the working durations of all completed executions.
Sum Working Duration The summed up (aggregate) working duration of all completed executions.
Process Migration (A) Drill-down link to a list of process migrations. See table Process Migration for details.
Audit Events (A) The total number of audit events received about this process.
Earliest Audit Event (xs format) (A) The timestamp of the earliest audit event received about this process.
Latest Audit Event (xs format) (A) The timestamp of the latest audit event received about this process.
Time Since First Active (A) The elapsed time (duration) since monitoring started for this process. This is a timer, which is started when this monitoring context is created and keeps running.
Time Since Last Active (A) The elapsed time (duration) since the last event was received about this process. This is a timer, which is restarted from zero each time an event is received in this monitoring context. It also triggers its termination when no events have been received for more than 90 days.
Table 1: The metrics of a Process Definition monitoring context


The content of the Process Version monitoring context is largely self-explanatory: it represents a deployed version of a process definition. It records the earliest and latest audit event received for that process version, which are the best estimates available for its life span.


Monitoring Context

Metric

Description

Comment

Process Version Process Definition Name The name of the versioned process definition. Copied from the parent monitoring context for convenience.
Version The version of a process definition. While the no-blanks version is shown in most other places, both the original and the no-blanks version are shown in this view, for completeness and for reference.
Version No Blanks The 'Version' metric with blanks replaced by underscores.
Earliest Audit Event (B) The timestamp of the earliest event received about this process definition version.
Earliest Audit Event (xs format) (A) The 'Earliest Audit Event' metric in XML Schema data format.
Latest Audit Event (B) The timestamp of the latest event received about this process definition version.
Latest Audit Event (xs format) (A) The 'Latest Audit Event' metric in XML Schema data format.
Table 2: The metrics of a Process Version monitoring context


A Process Migration monitoring context represents two versions of a process definition between which instance migrations have occurred (that is, in-flight process executions have been migrated from the first version to the second). Process executions can be migrated from one version to the next at different points in time. These individual migrations are captured by a Process Execution Migration monitoring context, discussed below. A Process Migration monitoring context by contrast presents an aggregate view of these migrations: it shows a pair of process versions between which migrations have happened, when the first migration started, when the first migration ended, when the last migration started, and when the last migration ended.


Monitoring Context

Metric

Description

Comment

Process Migration (A) Process Definition Name (A) The name of the process definition whose executions are migrated to a new version. Copied from the parent monitoring context for convenience.
Process Definition Version Migrated From No Blanks (A) The version of the migrated-from process definition. Blanks replaced by underscores to avoid line wrapping.
Process Definition Version Migrated To No Blanks (A) The version of the migrated-to process definition. Blanks replaced by underscores to avoid line wrapping.
Process Definition Identifier Migrated From (A) The identifier of the migrated-from process definition. A unique identifier of a versioned process definition. This could be a combination of the process template id and version, a machine-generated identifier, etc.
Process Definition Identifier Migrated To (A) The identifier of the migrated-to process definition. A unique identifier of a versioned process definition. This could be a combination of the process template id and version, a machine-generated identifier, etc.
Earliest Time Migration Started (xs format) (A) The first time this migration was started for an execution of this process.
Earliest Time Migration Completed (xs format) (A) The first time this migration was completed for an execution of this process.
Latest Time Migration Started (xs format) (A) The last time this migration was started for an execution of this process.
Latest Time Migration Completed (xs format) (A) The last time this migration was completed for an execution of this process.
Table 3: The metrics of a Process Migration monitoring context


A Variable Definition monitoring context represents a variable defined in a deployed process. It would be the logical place to hold aggregates (min/max/average values) of variable values. However, only numeric variables lend themselves to such aggregations, and from a technical standpoint this is inhibited by the "broken link" (red dashed line) in Figure 1: variable values are not monitored in child contexts of the one representing the variable definition, but such parent-child relationships are needed for metric-level aggregation. As a result, these monitoring contexts only hold a variable's name and no further information. (Type information could also be held here, but is not reported in the audit events sent by WebSphere Process Server.)


Monitoring Context

Metric

Description

Comment

Variable Definition Qualified Name The name of the process variable, preceded by an identifier for the process defining it. The process identifier is constructed by concatenating the process definition name, version, and deployment location. It should uniquely identify a particular executable deployed at a particular server.
Name The name of a process variable.
Table 4: The metrics of a Variable Definition monitoring context


A Step Definition monitoring context represents a step (activity, task, scope, loop, etc.) defined in a process. Of course only steps that have run at least once and sent audit events are detected. A Step Definition monitoring context also holds statistical information about the step executions, like the minimum / maximum / average execution time etc.


Monitoring Context

Metric

Description

Comment

Step Definition Process Definition Name The name of the process defining this step. Copied from the parent monitoring context for convenience.
Name The name of this step definition.
Kind The kind of activity/task represented by this step.
Started The number of step executions that have started.
In Progress The number of step executions that are in progress.
Finished The number of step executions that have finished.
Step Execution Drill-down link to a list of executions of this step definition. The number of child contexts will match the value of Started. See table Step Execution for a description of their metrics.
Min Total Duration The minimum total duration of all completed executions.
Avg Total Duration The average total duration of all completed executions.
Max Total Duration The maximum total duration of all completed executions.
StdDev Total Duration (A) The standard deviation of the total durations of all completed executions.
Sum Total Duration The summed up (aggregate) total duration of all completed executions.
Min Waiting Duration The minimum waiting duration of all completed executions.
Avg Waiting Duration The average waiting duration of all completed executions.
Max Waiting Duration The maximum waiting duration of all completed executions.
StdDev Waiting Duration (A) The standard deviation of the waiting durations of all completed executions.
Sum Waiting Duration The summed up (aggregate) waiting duration of of all completed executions.
Min Working Duration The minimum working duration of all completed executions.
Avg Working Duration The average working duration of all completed executions.
Max Working Duration The maximum working duration of all completed executions.
StdDev Working Duration (A) The standard deviation of the working durations of all completed executions.
Sum Working Duration The summed up (aggregate) working duration of all completed executions.
Earliest Audit Event (xs format) (A) The timestamp of the earliest event received about this step (in XML Schema data format).
Latest Audit Event (xs format) (A) The timestamp of the latest event received about this step (in XML Schema data format).
Identifier (A) A unique identifier of this step definition (unique within the process definition).
Table 5: The metrics of a Step Definition monitoring context


A Step Execution monitoring context represents an execution of a process step (activity, task, scope, loop, etc.). Step executions can go through various states during their lifetime (ready, claimed, suspended, running, finished, ...) and perhaps the most important aspect tracked by this context is a step execution's state history (which is actually held in its State History child contexts, but those are mere auxiliary constructs for the lack of complex type / sequence support).


Monitoring Context

Metric

Description

Comment

Step Execution Process Definition Name The name of the process defining this step. Copied from the grandparent monitoring context for convenience.
Name The name of this step. Copied from the parent monitoring context for convenience.
Kind The kind of activity/task represented by this step. Copied from the parent monitoring context for convenience.
State The current state of this step execution.
State Timestamp (B) The timestamp of the last event used to set the 'State' metric.
State Timestamp (xs format) (A) The 'State Timestamp' metric in XML Schema data format.
State History Drill-down link to a timestamped history of state changes of this step execution. See table [Step Execution] State History for details.
Total Duration The duration of this step execution so far. The time since it started while it is in progress, and the elapsed time from start to end after it has ended.
Waiting Duration The aggregate duration for which this step execution has waited for a human task to be claimed.
Working Duration The aggregate duration for which this step execution has waited for a claimed human task to be completed.
Time Started (B) The timestamp of the earliest event received about this step execution. If the step execution sends a start event, then this metric will represent its start time.
Time Started (xs format) (A) The 'Time Started' metric in XML Schema data format.
Time Ended (B) The time when this step execution ended.
Time Ended (xs format) (A) The 'Time Ended' metric in XML Schema data format.
Owner The user who has claimed this step execution (for steps that are human tasks).
Potential Owners The users and/or groups eligible to claim this step execution (for steps that are human tasks).
Potential Owners History Drill-down link to a timestamped history of potential owners of this step execution (for steps that are human tasks). See table [Step Execution] Potential Owners History for details.
Work Item Update The last work item update for this step execution (for steps that are human tasks).
Work Item Update History Drill-down link to a timestamped history of work item updates for this step execution (for steps that are human tasks). See table [Step Execution] Work Item Update History for details.
Escalations The number of escalations of this step execution (for steps that are human tasks).
Escalation History Drill-down link to a timestamped history of escalations of this step execution (for steps that are human tasks). See table [Step Execution] Escalation History for details.
Identifier (A) A unique identifier of this step execution.
Called Execution Identifier (A) The identifier of the process or task execution that was called. Only for steps that represent invocations.
Table 6: The metrics of a Step Execution monitoring context


A [Step Execution] State History monitoring context records a timestamped state change of a running process step. The timestamp shows when this state was entered.


Monitoring Context

Metric

Description

Comment

[Step Execution] State History Time The time this state was entered.
Time (xs format) (A) The 'Time' metric in XML Schema data format. You may consider adding the 'xs format' timestamp to the basic dashboard view. Step state changes are the lowest (most precise) level at which progress is tracked for a process execution, and showing milliseconds may make sense.
State The state being recorded.
Principal The principal associated with this state change.
Table 7: The metrics of a [Step Execution] State History monitoring context


A [Step Execution] Potential Owners History monitoring context is instantiated as work items are created, deleted, refreshed, or transferred for a human task execution. Each instance records a new list of potential owners for the task execution.


Monitoring Context

Metric

Description

Comment

[Step Execution] Potential Owners History Time The time the list of potential owners of a task execution was changed.
Time (xs format) (A) The 'Time' metric in XML Schema data format.
Potential Owners The list of potential owners of a task execution (users that may claim it). In this case the list is maintained in a single string metric, which for this simple case (just a list of names) made more sense than adding yet another level of child monitoring contexts.
Principal The principal associated with this change of potential owners.
Table 8: The metrics of a [Step Execution] Potential Owners History monitoring context


A [Step Execution] Work Item Update History monitoring context, similarly to the [Step Execution] Potential Owners History monitoring context, is instantiated as work items are created, deleted, refreshed, transferred, or escalated for a human task execution. Each instance records a change that was made to the task's list of work items.


Monitoring Context

Metric

Description

Comment

[Step Execution] Work Item Update History Time The time of this work item update.
Time (xs format) (A) The 'Time' metric in XML Schema data format.
Work Item Update The work item update being recorded. Work item updates being recorded include: work item create, work item delete, work item transfer, work item list refresh, and work item escalation.
Principal The principal associated with this work item update.
Table 9: The metrics of a [Step Execution] Work Item Update History monitoring context


A [Step Execution] Escalation History monitoring context records an escalation of a human task execution.


Monitoring Context

Metric

Description

Comment

[Step Execution] Escalation History Time The time of this escalation.
Time (xs format) (A) The 'Time' metric in XML Schema data format.
Escalation The name of the escalation being recorded.
Principal The principal associated with this escalation.
Table 10: The metrics of a [Step Execution] Escalation History monitoring context


A Process Execution monitoring context represents an execution of a process. It is instantiated as soon as the first event about a process execution is detected, and tracks the execution's state and progress until it is finished. A few more remarks may be in order:


Monitoring Context

Metric

Description

Comment

Process Execution Process Definition Name The name of the process definition whose execution is being monitored. Copied from the parent monitoring context for convenience.
Process Definition Version No Blanks The current version of the process definition being executed, with blanks replaced by underscores. If this execution is migrated to a different process definition, the migration, as well as the earlier version, will be documented in a Process Execution Migration child context.
Invocation Depth (A) The invocation depth of this process execution. Starting at 0 for "main" or "top-level" process executions.
State The current state of this process execution.
State Timestamp (B) The timestamp of the last event used to set the 'State' metric.
State Timestamp (xs format) (A) The 'State Timestamp' metric in XML Schema data format.
State History Drill-down link to a timestamped history of state changes of this process execution.
Steps The number of steps started for this process execution.
Process Execution Step Drill-down link to a list of steps of this process execution. See table Process Execution Step for details.
Variables The number of variables detected for this process execution. Only variables that are accessed by this process execution, and for which audit events are enabled, will be detected.
Process Execution Variable Drill-down link to a list of variables of this process execution. See table Process Execution Variable for details.
Correlation Sets (A) A serialization of any correlation sets initialized for this process execution, preceded by their initialization timestamps.
Events The number of events detected for this process execution. These are "process events", which are received by an event handler of this process execution, and not to be confused with audit events, which are sent from this process execution to Monitor.
Process Execution Event Drill-down link to a list of events received by this process execution. See table Process Execution Event for details.
Total Duration The duration of this process execution. The time since it started while it has not ended, and the total time from start to end after it has ended.
Waiting Duration The aggregate duration for which this process execution has waited for human tasks to be claimed. Note that it can exceed the process execution's total duration when human tasks are executed in parallel.
Working Duration The aggregate duration for which this process execution has waited for claimed human tasks to be completed. Note that it can exceed the process execution's total duration when human tasks are executed in parallel.
Time Started (B) The timestamp of the earliest event received about this process execution. If a 'process started' event is sent, it will be the time when the execution started.
Time Started (xs format) (A) The 'Time Started' metric in XML Schema data format.
Time Ended (B) The time when this process execution ended.
Time Ended (xs format) (A) The 'Time Ended' metric in XML Schema data format.
Process Execution Migration (A) Drill-down link to a list of migrations (to new process definition versions) for this process execution. See table Process Execution Migration for details.
Initiator Identifier (A) Identifier of the process execution that initiated the invocation chain that the current process execution is part of ("main" or "top-level" process execution).
Caller Identifier (A) Unique identifier of the caller of this process execution.
Identifier (A) A unique identifier of this process execution.
Audit Events (A) The number of audit events received from this process execution.
Table 11: The metrics of a Process Execution monitoring context


A [Process Execution] State History monitoring context records a timestamped state change of a running process execution. The timestamp shows when this state was entered. The metrics are the same as for a [Step Execution] State History monitoring context.


A Process Execution Event monitoring context is created when a process event (one-way message) is received by an event handler of the process execution represented by its parent monitoring context. The monitoring context represents the arrival of the process event at the process execution, and its processing by either a scope-level event handler or a process-level event handler. Depending on the type of the event handler, only a subset of the metrics is populated as indicated in the Comment column.


Monitoring Context

Metric

Description

Comment

Process Execution Event Time Received The timestamp of the audit event reporting the receipt of a process event.
Time Received (xs format) (A) The 'Time Received' metric in XML Schema data format.
Receiving Scope Name The name of the scope, one of whose event handlers received the event. This metric is populated when the process event is received by a scope-level event handler, and empty when the event is received by a process-level event handler.
Porttype Namespace The port type namespace name of the operation that received the process event. This metric is only populated when the process event is received by a process-level event handler, because audit events from scope-level event handlers do not currently report this information.
Porttype Name The port type name of the operation that received the process event. This metric is only populated when the process event is received by a process-level event handler, because audit events from scope-level event handlers do not currently report this information.
Operation Name The name of the operation that received the process event.
Message The message carried by the process event.
Principal The principal associated with this process event.
Table 12: The metrics of a Process Execution Event monitoring context


A Process Execution Migration monitoring context is created when a running process execution is migrated from one process definition version to the next. The name of the process definition remains unchanged (Process Definition Name) but its version changes (Process Definition Version Migrated From → Process Definition Version Migrated To) as does its identifier (Process Definition Identifier Migrated From → Process Definition Identifier Migrated To).


Monitoring Context

Metric

Description

Comment

Process Execution Migration (A) Process Definition Name (A) The name of the process definition whose instances are being migrated. Copied from the grandparent monitoring context for convenience.
Process Definition Version Migrated From No Blanks (A) The version of the migrated-from process definition. Blanks have been replaced by underscores to avoid line-wrapping. The original version is held by the Process Definition Version Migrated From metric.
Process Definition Version Migrated To No Blanks (A) The version of the migrated-to process definition. Blanks have been replaced by underscores to avoid line-wrapping. The original version is held by the Process Definition Version Migrated To metric.
Process Definition Identifier Migrated From (A) The identifier of the migrated-from process definition.
Process Definition Identifier Migrated To (A) The identifier of the migrated-to process definition.
Time Migration Started (xs format) (A) The time when this process execution migration was triggered.
Time Migration Completed (xs format) (A) The time when this process execution migration was completed.
Principal (A) The principal associated with this process execution migration.
Table 13: The metrics of a Process Execution Migration monitoring context


A Process Execution Variable monitoring context is instantiated for each process variable (instance) that has been detected. It holds its current value and the time this value was set. A list of historical values is held in a child sequence of [Process Execution Variable] Value History monitoring contexts.


Monitoring Context

Metric

Description

Comment

Process Execution Variable Name The name of the process variable being monitored.
Value Timestamp The timestamp of the current variable value.
Value Timestamp (xs format) (A) The 'Value Timestamp' metric in XML Schema data format.
Value The latest variable value, after stripping off any wrappers. We spend some effort to format variable values for browser display. There is also a metric 'Unformatted Value', which holds the unchanged values, as reported by a variable change event.
Historical Values The number of historical values on record (size of the value history).
Value History Drill-down link to a list of timestamped, historical values of this process variable.
Table 14: The metrics of a Process Execution Variable monitoring context


A [Process Execution Variable] Value History monitoring context holds a timestamped value (snapshot) of a process variable. It is instantiated each time a monitored process variable is changed, and initialized with the new value and the time when it was set.


Monitoring Context

Metric

Description

Comment

[Process Execution Variable] Value History Name The name of the process variable of which a snapshot was taken.
Time The time of this process variable snapshot.
Time (xs format) (A) The 'Time' metric in XML Schema data format.
Value A snapshot of a process variable value, after stripping off any wrappers. We spend some effort to format variable values for browser display. There is also a metric 'Unformatted Value', which holds the unchanged values, as reported by a variable change event.
Principal The principal associated with this variable value update.
Table 15: The metrics of a [Process Execution Variable] Value History monitoring context


A Process Execution Step monitoring context represents a step of a process execution (running activity, task, scope, loop, etc.). It monitors the same thing as a Step Execution monitoring context, and has a very similar set of metrics. The main difference between these two context types is their grouping:


Monitoring Context

Metric

Description

Comment

Process Execution Step Process Definition Name The name of the process defining this step. Copied from the grandparent monitoring context for convenience.
Name The name of this step. If an in-flight activity is renamed as part of a Process Execution Migration, then this metric will have the form  NewName ← OldName [ ← OlderName … ]
Kind The kind of activity/task represented by this step.
State The current state of this process execution step.
State Timestamp (B) The timestamp of the last event used to set the 'State' metric.
State Timestamp (xs format) (A) The 'State Timestamp' metric in XML Schema data format.
State History Drill-down link to a timestamped history of state changes of this process execution step. See table [Step Execution] State History for details.
Total Duration The duration of this process execution step so far. The time since it started while it is in progress, and the elapsed time from start to end after it has ended.
Waiting Duration The aggregate duration for which this process execution step has waited for a human task to be claimed.
Working Duration The aggregate duration for which this process execution step has waited for a claimed human task to be completed.
Time Started (B) The timestamp of the earliest event received about this process execution step. If a start event is sent, then this metric will represent its start time.
Time Started (xs format) (A) The 'Time Started' metric in XML Schema data format.
Time Ended (B) The time when this process execution step ended.
Time Ended (xs format) (A) The 'Time Ended' metric in XML Schema data format.
Owner The user who has claimed this process execution step (for steps that are human tasks).
Potential Owners The users and/or groups eligible to claim this process execution step (for steps that are human tasks).
Potential Owners History Drill-down link to a timestamped history of potential owners of this process execution step (for steps that are human tasks). See table [Step Execution] Potential Owners History for details.
Work Item Update The last work item update for this process execution step (for steps that are human tasks).
Work Item Update History Drill-down link to a timestamped history of work item updates for this process execution step (for steps that are human tasks). See table [Step Execution] Work Item Update History for details.
Escalations The number of escalations of this process execution step (for steps that are human tasks).
Escalation History Drill-down link to a timestamped history of escalations of this process execution step (for steps that are human tasks). See table [Step Execution] Escalation History for details.
Identifier (A) A unique identifier of this process execution step.
Called Execution Identifier (A) The identifier of the process or task execution that was called. Only for steps that represent invocations.
Table 16: The metrics of a Process Execution Step monitoring context


For a description of the remaining four monitoring context definitions in Figure 3 please refer to the equivalent monitoring contexts already described above:


Finally, please note that all of the timestamped sequences captured in these auxiliary monitoring contexts are also available as string metrics. The dashboard can be configured to use these metrics instead of the drill-down links. How this might look is shown in Figure 9, which displays the same information as Figure 7 except that the State History information has been "pulled up" from a list of child monitoring contexts to a string metric and is shown at the same level as the remaining properties of the process execution steps. Obviously, Figure 7 makes more efficient us of the screen real estate than Figure 9, but Figure 9 gives a better first-glance view of each step's lifecycle.


Figure 9: The same information as in Figure 7 with the State History drill-down replaced by a string metric