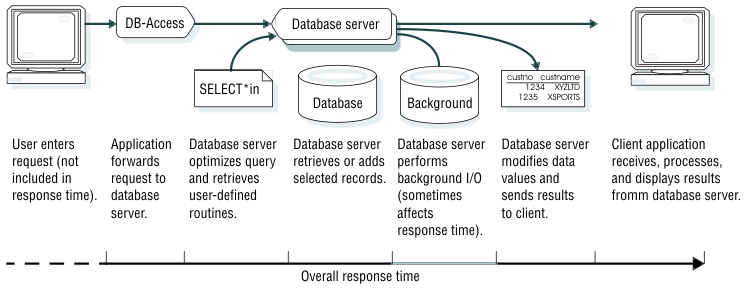
Response time measures the performance of an individual transaction or query. Response time is typically treated as the elapsed time from the moment that a user enters a command or activates a function until the time that the application indicates the command or function has completed. The response time for a typical Dynamic Server application includes the following sequence of actions. Each action requires a certain amount of time. The response time does not include the time that it takes for the user to think of and enter a query or request:
Figure 1 contains a diagram that shows how the actions just described in steps 1 through 6 contribute to the overall response time.

Response time and throughput are related. The response time for an average transaction tends to decrease as you increase overall throughput. However, you can decrease the response time for a specific query, at the expense of overall throughput, by allocating a disproportionate amount of resources to that query. Conversely, you can maintain overall throughput by restricting the resources that the database allocates to a large query.
The trade-off between throughput and response time becomes evident when you try to balance the ongoing need for high transaction throughput with an immediate need to perform a large decision-support query. The more resources that you apply to the query, the fewer you have available to process transactions, and the larger the impact your query can have on transaction throughput. Conversely, the fewer resources you allow the query, the longer the query takes.
You can use either of the following methods to measure response time for a query or application:
Your operating system typically has a utility that you can use to time a command. You can often use this timing utility to measure the response times to SQL statements that a DB–Access command file issues.
If you have a command file that performs a standard set of SQL statements, you can use the time command on many systems to obtain an accurate timing for those commands. For more information about command files, see the IBM Informix: DB–Access User's Guide. The following example shows the output of the UNIX time command:
time commands.dba
...
4.3 real          1.5 user              1.3 sys
The time output lists the amount of elapsed time (real), the user CPU time, and the system CPU time. If you use the C shell, the first three columns of output from the C shell time command show the user, system, and elapsed times, respectively. In general, an application often performs poorly when the proportion of system CPU time exceeds one-third of the total elapsed time.
The time command gathers timing information about your application. You can use this command to invoke an instance of your application, perform a database operation, and then exit to obtain timing figures, as the following example illustrates:
time sqlapp
   (enter SQL command through sqlapp, then exit)
10.1 real          6.4 user           3.7 sys
You can use a script to run the same test repeatedly, which allows you to obtain comparable results under different conditions. You can also obtain estimates of your average response time by dividing the elapsed time for the script by the number of database operations that the script performs.
Operating systems usually have a performance monitor that you can use to measure response time for a query or process.
You can often use the Performance Monitor that the Windows operating system supplies to measure the following times:
Most programming languages have a library function for the time of day. If you have access to the source code, you can insert pairs of calls to this function to measure the elapsed time between specific actions.
For example, if the application is written in IBM Informix ESQL/C, you can use the dtcurrent() function to obtain the current time. To measure response time, you can call dtcurrent() to report the time at the start of a transaction and again to report the time when the transaction commits.
Elapsed time, in a multiprogramming system or network environment where resources are shared among multiple processes, does not always correspond to execution time. Most operating systems and C libraries contain functions that return the CPU time of a program.
Enterprise Edition Home | Express Edition Home | [ Top of Page | Previous Page | Next Page | Contents | Index ]