Java Profilers
Major Profilers
General Profiler Notes
There are two broad categories of profilers: statistical/sampling profilers which sample call stacks, and tracing profilers which record method entry/exit times. In general, sampling profilers are very low overhead and suitable for production (e.g. IBM Health Center is less than 1%), whereas tracing profilers may be up to 50% or more overhead and generally aren't suitable for production. Imagine that sampling profilers are like taking javacores at a high frequency (with less overhead since the profiler is only sampling call stacks). Tracing profilers are more accurate but produce a lot more data and have to hook deeply into the JVM to get their data, causing the additional overhead.
Whether or not your tests are going well, it is important to plan in at least some basic profiling tests, both for a single user (either sampling or tracing profiler) and for a full stress test (sampling profiler).
Java Profilers Recipe
- In most cases, sampling profilers are used first and tracing profilers are only used for fine grained tuning or deep dive analysis.
- Analyze any methods that use more than 1% of the reported time in themselves.
- Analyze any methods that use more than 10% of the reported time in themselves and their children.
- Analyze any locks that have large contention rates, particularly those with long average hold times.
Statistical/Sampling Profilers
IBM Java Health Center
The IBM Java Health Center tool is covered in depth in the Major Tools chapter.
Java Mission Control (Formerly JRockit Mission Control)
This tool has been moved into the Major Tools chapter under OpenJDK Mission Control.
HotSpot HPROF
HPROF is a sampling JVMTI profiler that ships with Java (and therefore with WebSphere). Restart the JVM with -agentlib:hprof=cpu=samples
When the program stops gracefully, the sample counts will be printed to stdout/stderr.
Example output:
CPU SAMPLES BEGIN (total = 126) Fri Oct 22 12:12:14 2004
rank   self  accum   count trace method
   1 53.17% 53.17%      67 300027 java.util.zip.ZipFile.getEntry
   2 17.46% 70.63%      22 300135 java.util.zip.ZipFile.getNextEntry
   3  5.56% 76.19%       7 300111 java.lang.ClassLoader.defineClass2
   4  3.97% 80.16%       5 300140 java.io.UnixFileSystem.list
   5  2.38% 82.54%       3 300149 java.lang.Shutdown.halt0
   6  1.59% 84.13%       2 300136 java.util.zip.ZipEntry.initFields
   7  1.59% 85.71%       2 300138 java.lang.String.substring
   8  1.59% 87.30%       2 300026 java.util.zip.ZipFile.open
   9  0.79% 88.10%       1 300118 com.sun.tools.javac.code.Type$ErrorType.<init>
  10  0.79% 88.89%       1 300134 java.util.zip.ZipFile.ensureOpen
http://docs.oracle.com/javase/7/docs/technotes/samples/hprof.html
HotSpot VisualVM
VisualVM (http://docs.oracle.com/javase/7/docs/technotes/guides/visualvm/) is shipped with Java (${JAVA}/bin/jvisualvm) and therefore with WebSphere. It provides both a sampling and tracing profiler. VisualVM does not have a headless mode, so you must run the GUI client on the same machine as the target JVM (http://docs.oracle.com/javase/7/docs/technotes/tools/share/jstatd.html). jvisualvm through jstatd does not support remote profiling: "Java VisualVM... cannot profile remote applications." (http://docs.oracle.com/javase/7/docs/technotes/guides/visualvm/applications_remote.html). The only way to use it remotely would be to export DISPLAY to another machine.
Once you've connected to the JVM, click on Sampler and click the CPU button to start sampling. By default, when VisualVM samples a stack, it will skip over stack frames in the packages java.*, javax.*, sun.*, sunw.*, and com.sun.* (https://blogs.oracle.com/nbprofiler/entry/profiling_with_visualvm_part_2). You can setup a profiling preset under Tools > Options and specify a blank string for the "Do not profile packages" textbox to override this.
It does not appear that VisualVM data can be cropped to a particular time period, making it difficult to use for problems during a specific period.
VisualVM supports a plugin that can track DirectByteBuffer usage: https://blogs.oracle.com/nbprofiler/entry/new_memory_buffer_plugin_for
Tracing Profilers
IBM Java -Xtrace
For simple tracing profiler usage on IBM Java, -Xtrace is very easy to use: http://www-01.ibm.com/support/docview.wss?uid=swg21657391
Rational Application Developer (RAD) Profiler
The Rational Application Developer profiling platform provides three different analyses of application behavior:
- Memory-usage analysis
- Method-level execution analysis
- Thread analysis
Suited when you have an eclipse based IDE installed and are using RAD to develop software.
Profiling agents are executed alongside the JVM (and inside the JVM process) when that JVM is run with special JVMTI-specific VM arguments. When the profiling agents run, they collect data from the JVM in the form of execution, heap, or thread events. Within the Rational Application Developer profiling sphere, these agents are referred to as the Execution Analysis, Heap Analysis, and Thread Analysis agents.
The following tutorial walks you through how to go about setting up the profiling agent and collecting data
http://www.ibm.com/developerworks/rational/tutorials/profilingjavaapplicationsusingrad/
You can also profile outside of RAD using the standalone mode.
Rational Agent Controller (RAC)
The Rational Agent Controller (RAC) has a really broad set of supported operating systems: AIX, Linux, Linux s/390 (zLinux), Windows, Solaris, and z/OS: http://www-01.ibm.com/support/docview.wss?uid=swg27013420#v8. Once you've got the agent controller installed and the JVM instrumented, you can either gather data in headless mode which you load into Rational Application Developer, or start/pause monitoring remotely from RAD.
The RAC comes with a JVMTI profiling agent which has to be attached to the JVM. This profiler has a lot of native components which makes this a bit tricky. First, you'll need to add a generic JVM argument, such as:
"-agentpath:/opt/IBM/SDP/AgentController/plugins/org.eclipse.tptp.javaprofiler/libJPIBootLoader.so=JPIAgent:server=controlled,format=binary,file=log.trcbin;CGProf"Note that the argument has to be specified with double quotes to avoid any issues with the semicolon in the Linux launcher. So if you already had some arguments, such as -Xgcpolicy:gencon, then your final generic JVM arguments would be:
-Xgcpolicy:gencon "-agentpath:/opt/IBM/SDP/AgentController/plugins/org.eclipse.tptp.javaprofiler/libJPIBootLoader.so=JPIAgent:server=controlled,format=binary,file=log.trcbin;CGProf"Next, we need to tell Linux how to load native library dependencies for libJPIBootLoader.so. To do this, we need to tell WAS to start with a specific LD_LIBRARY_PATH environment variable. Envars can be set through the Environment Entries option (http://www-01.ibm.com/support/docview.wss?uid=swg21254153):
Name = LD_LIBRARY_PATH
Value = /opt/IBM/SDP/AgentController/plugins/org.eclipse.tptp.javaprofiler/:/opt/IBM/SDP/AgentController/lib
WAS is smart enough to append the library path you specify to the library path that it needs itself.
Use the server=controlled option in which case the JVM will not start until RAD connects to it (http://www.eclipse.org/tptp/home/downloads/4.5.0/documents/installguide/agentcontroller_45/linux/getting_started.html#Java_15). The reason we did this was so that we can control what gets profiled, since we weren't interested in profiling JVM startup. This option is recommended over server=enabled for high volume profiling (http://www-01.ibm.com/support/docview.wss?uid=swg21414403). Here are the basic steps we followed:
- Start the RAC agent (RAStart.sh) before launching the application server
- Launch the application server (it will immediately enter a wait state)
- Connect to the JVM using RAD: http://www.ibm.com/developerworks/rational/tutorials/profilingjavaapplicationsusingrad/index.html
- In some versions of RAD, this will immediately start profiling, in which case you'll probably want to click Pause - the JVM will continue to start but profiling will not be active
- When you're ready, resume the actual profiling and continue as long as necessary
- You'll probably want to select the option in RAD to save the data to a local file for post-analysis in addition to streaming it into RAD itself
There is also the option of using server=standalone which writes the profiling data to a local file and avoids the RAC itself and needing to connect in remotely from RAD. However, startup may take very long and create a lot of data which would have been cumbersome to analyze.
There are many ways to analyze the captured data: http://www.ibm.com/developerworks/rational/tutorials/profilingjavaapplicationsusingrad/index.html
For example, capture top -b -H -d 1800 -p $PID to gather accumulated CPU time per thread at the start of profiling and at the end and take the difference to find the threads that accumulated CPU and sort by that number. Next, within RAD's Execution Time Analysis, select the Call Tree tab and find these threads. Expand the threads and follow down the largest paths of cumulative time. Note that there may be some rows with very large cumulative times that are probably just the frames of the thread that are "waiting for work," such as a call to getTask or await, and these can be disregarded.
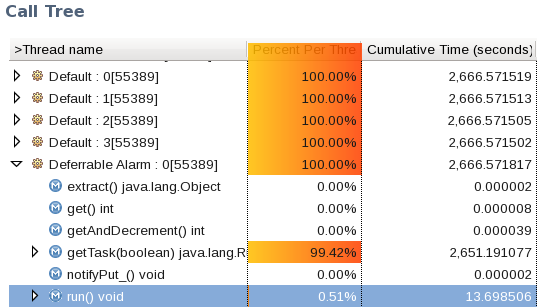
Once you find a high level method of interest (the art of profiling!), right click it and select Show Method Invocation Details. In the third table, "Selected Method Invokes," sort by Cumulative CPU Time, descending (if you don't have this column, you will need to make sure you have this option selected in one of the RAD attach/profiling screens when starting to profile). This will give the accumulated CPU time from a high level. You can then "drill down" further if you'd like to by doing the same procedure with rows from this table.
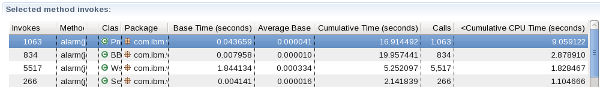
Note: Cumulative CPU time in the method invocation details is for the whole tracing profile, not from within the context of the call tree thread stack that you get here from.
Performance Inspector
Performance inspector is a suite of profilers including sampling and tracing profilers and other tools for various operating systems. An open source version still exists but it is not actively maintained: http://perfinsp.sourceforge.net/