IBM Java Health Center
IBM Monitoring and Diagnostics for Java - Health Center is a profiler for IBM Java. It includes a statistical CPU profiler that samples Java stacks that are using CPU. Recent versions generally have an overhead of less than 1% and are suitable for production use and may be enabled dynamically without restarting the JVM.
Client Installation
See the download instructions.

Agent Installation
The Health Center agent is pre-packaged with IBM Java 8 (on Linux, AIX, Windows, and z/OS) and IBM Semeru Runtimes 11 (on z/OS). See the informal instructions for other versions of IBM Semeru Runtimes.
Agent Usage
There are two ways to enable the Health Center agent: 1) a live socket mode or 2) a headless mode that produces HCD files. In general, we recommend the headless mode at startup (optionally for a limited duration) or dynamically enabled at runtime (optionally for a limited duration).
Health Center Recipe
- Open Garbage Collection View } Right Click } Change units } X axis } Date
- Observe the garbage collection to see roughly when there was significant activity and mouse over the start and end times. Take these times and crop the data in the menu } Data } Crop Data
- Observe the proportion of time spent in garbage collection % in the GC Summary view
- Switch to the CPU view and observe the average and maximum CPU %
- Switch to the Locking view and sort by Slow. If the number of gets or average hold times are high for the top hitters, review the lock Name
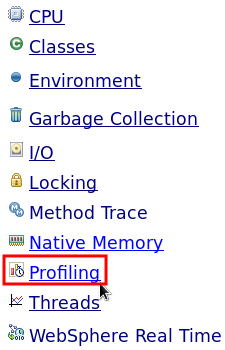
- Switch to the Profiling view
- Sort by self % (default sort) and observe the top 10 methods or so. If a single method self % is greater than 5-10%, this is concerning. Click on each one and observe the Invocation paths.
- Sort by tree %. Usually the first one will be something like Thread.run or Worker.run. Select this and change to the Called methods view. Expand the largest tree items until there is a large "drop;" for example, if methods are 100, 99, 100, 100, etc., and then suddenly there is a drop to one method with 60% and one with 40%, this is usually an indication of a major divergence in general application activity. Continue as needed until something interesting comes up (this is an art more than a science).
Overhead
In general, the overhead of Health Center is between 0.4 to 3%, depending on the mode. In the headless mode, the overhead is about 1%; however, if files roll over, this involves zipping files together and that has a momentary impact, which averaged out can increase overhead up to 3%. The socket mode has the lowest overhead of about 0.4%.
Gathering Data
There are two ways to gather HealthCenter data:
- Headless mode: writes data to local .hcd files with the HealthCenter agent enabled in headless mode.
- Socket mode: direct TCP connection from a HealthCenter client to a JVM with the HealthCenter agent enabled and data is streamed to the client (there is an option to export streamed data to an hcd file).
In general, headless mode is preferred for production usage to avoid connectivity/firewall issues and doesn't require direct human involvement.
Review Health Center agent configuration properties.
Warning: Health Center enables J9 -Xtrace
under the covers which uses additional native memory on each thread
based on -Xtrace:buffers.
If you have a lot of threads and native memory constraints (RAM or
virtual), this may cause native OutOfMemoryErrors, so it's always best
to test Health Center with a stress test in a test environment before
using in production. This risk may be exacerbated with Liberty which
defaults to an unlimited
maximum thread pool designed to maximize throughput, so Liberty
users should consider capping this with
<executor maxThreads="N" /> based on available native
memory.
Headless mode
See the four different recipes of enabling headless mode:
- Enable at Startup
- Enable at Startup of Limited Duration
- Enable at Runtime
- Enable at Runtime of Limited Duration
Socket mode
Socket mode may be enabled during restart or dynamically similar to
above although omit level=headless.
When using the socket mode, by default Health Center uses CORBA as
the communication protocol. Another option is to use JRMP with
-Dcom.ibm.java.diagnostics.healthcenter.agent.transport=jrmp.
Both methods are similar in performance although JRMP has a built-in
reaper thread that runs approximately once an hour which calls
System.gc.
Enabling Health Center Dynamically
As partly covered in the above topics, Health Center may be enabled dynamically.
Disabling Health Center
After data collection has started, there are two ways to disable data collection:
When configuring headless mode (either on restart or dynamically), use the configuration properties to stop collection after some point. For example (in minutes):
-Dcom.ibm.java.diagnostics.healthcenter.headless.run.duration=30 -Dcom.ibm.java.diagnostics.healthcenter.headless.run.number.of.runs=1To skip some amount of profiling (e.g. startup), use, for example (in minutes):
-Dcom.ibm.java.diagnostics.healthcenter.headless.delay.start=5In socket mode, in the HealthCenter client, open the "Configure Collection of Data" screen and uncheck all boxes which will send a command to the agent to turn off most collection.
Analyzing Data
- Start Eclipse with Health Center installed
- In Eclipse } Window } Perspective } Open Perspective } Other... } Health Center Status Summary
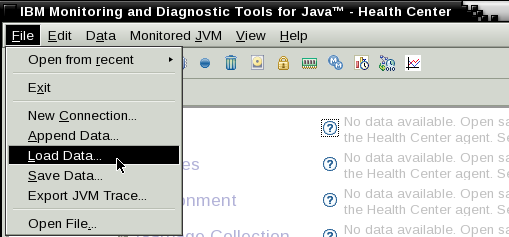
- Click File } Load Data... to load an HCD file, or File } New
Connection... to connect to a running Health Center agent.
WARNING: The HealthCenter client may quietly drop older data if its Java heap is nearly full, so use a very large heap when analyzing. (This is because it was originally designed for socket mode which streams data in).
Profiling View
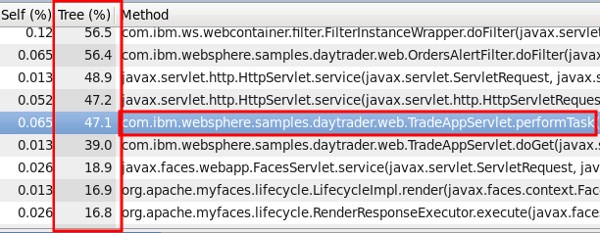
Click the Profiling link. By default, the list is sorted by self percentage which will show very hot methods.
The Self (%) column reports the percent of samples where a method was at the top of the stack. The Tree (%) column reports the percent of samples where a method was somewhere else in the stack. In this example, WAS NCSA access logging was sampled more than 2% of the time, and the next largest single sample is java.lang.String.regionMatches. If we click on this row, we can expand the "Invocation Paths" to see which methods call this method. In this example, this 1% of samples was mostly called by JSF HTML rendering from the application.
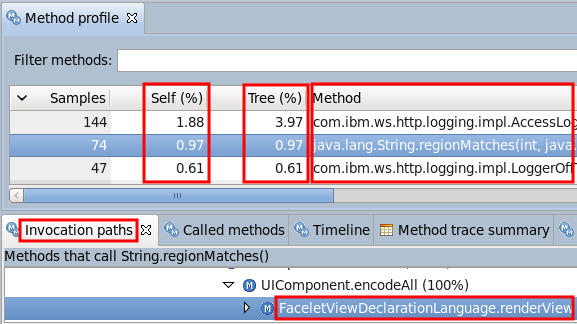
If you sort by Tree %, skip the framework methods from Java and WAS, and find the first application method. In this example, about 47% of total samples was consumed by com.ibm.websphere.samples.daytrader.web.TradeAppServlet.performTask and all of the methods it called. The "Called Methods" view may be further reviewed to investigate the details of this usage.
Updating to the latest agent
- Stop the application servers and node agents (and DMGR if on that node).
- Install the Health Center Eclipse client and access the local help content to download the latest agent.
- After updating the files, make sure to chown them to the user that runs WAS.
- Re-start the application servers.
Platform-Specific Agent Update Notes
On AIX, if you had previously run Health Center, even if you stop all JVMs, you will probably see this error extracting libhealthcenter.so:
tar: 0511-188 Cannot create ./jre/lib/ppc64/libhealthcenter.so: Cannot open or remove a file containing a running program.By default, AIX will keep shared libraries in memory even after all JVMs referencing that library have stopped. To remove the shared library from memory, you may either reboot the box or more simply, run the slibclean command (see also genkld and genld). This should be safe to run because it only affects shared libraries that have no current load or use counts:
The slibclean command unloads all object files with load and use counts of 0. It can also be used to remove object files that are no longer used from both the shared library region and in the shared library and kernel text regions by removing object files that are no longer required.
Now you should be able to overwrite
libhealthcenter.so.
You may also find that healthcenter.jar has open file
handles (e.g. lsof) in Java processes even if healthcenter
was not enabled. This is because healthcenter.jar is in the
ext JRE directory which is searched as part of some
classpath operations. If you take a system dump, you will find a
java.util.jar.JarFile object with a name field that
includes healthcenter.jar, and this JarFile
object probably has a native file handle open (although you will not
find a java.io.File object with that path). In theory, it
should be safe to overwrite healthcenter.jar even if
running processes have open file handles to it because the JAR file will
not be read by those JVMs that do not have healthcenter enabled.
Point to a different agent installation directory
It is possible to update to the latest agent without modifying the binaries in the WAS folder:
- Extract the agent ZIP into any directory; for example,
/opt/healthcenter/agent/ - Take a javacore of the running target server and find the last value
of
-Djava.ext.dirs(note that there may be multiple instances, so always take the last value). For example:-Djava.ext.dirs=/opt/local/was85/tivoli/tam:/opt/local/was85/java/jre/lib/ext - Prepend the path to the ext folder under the expanded HealthCenter
agent directory to
-Djava.ext.dirs. For example:-Djava.ext.dirs=/opt/healthcenter/agent/jre/lib/ext:/opt/local/was85/tivoli/tam:/opt/local/was85/java/jre/lib/ext - Append this parameter as well as the following parameters (replacing
the path to the HealthCenter agent) to the generic JVM arguments:
-Djava.ext.dirs=/opt/healthcenter/agent/jre/lib/ext:/opt/local/was85/tivoli/tam:/opt/local/was85/java/jre/lib/ext -agentpath:/opt/healthcenter/agent/jre/bin/libhealthcenter.so -Dcom.ibm.java.diagnostics.healthcenter.agent.properties.file=/opt/healthcenter/agent/jre/lib/healthcenter.properties - Append this parameter to the "Claspath" textbox on the same page as
the generic JVM arguments (replacing the path to the HealthCenter
agent):
/opt/healthcenter/agent/jre/lib/ext/healthcenter.jar - Add the necessary HealthCenter arguments described above to enable it.
- Restart the JVM.
Low mode
-Xhealthcenter:level=low disables method profiling since
this has the highest overhead and creates the most data. This would be
useful if you wanted something else from health center (e.g. garbage
collection, native memory, etc.) with less overhead.
You may also disable thread stack capturing to reduce overhead
further:
-Dcom.ibm.diagnostics.healthcenter.data.threads=off
Low mode cannot be combined with headless (e.g.
-Xhealthcenter:level=low,level=headless), so the way to do
it is to use headless mode and then: In jre/lib/ext there
is a file called healthcenter.jar. If you unpack that you
will find a file called TRACESourceConfiguration.properties
and this is what defines which data is switched on by trace. When we run
in low mode, we turn off one of the profiling trace points. You can do
this manually by editing this file and finding the entry
j9jit.16=on and then changing it to
j9jit.16=off. If you repackage the jar up you should find
that the amount of trace generated is a lot less (but you won't get
method profiling).
Hexadecimal Method Names
Sometimes you may see addresses (0x0123ABCD) instead of
method names. This usually occurs for methods loaded very early in the
JVM such as classloading methods.
This issue is generally resolved by starting HealthCenter from JVM startup or by using newer agents, so test upgrading the agent.
Warning: Health Center is sometimes recommended with
-Xtrace:buffers={2m,dynamic} to reduce the probability of
losing method name translations but note that this further increases
native memory demands.
To investigate, use the option
-Dcom.ibm.diagnostics.healthcenter.logging.methodlookup=debug
and upload stdout/stderr.
Health Center Details
In one of the largest customer production situations, health center wrote about 5GB per hour of data to the filesystem.
Docker
To use Health Center through Docker with JRMP and the GUI client,
java.rmi.server.hostname=9.140.104.32 which is the IP address of the
machine doing the docker run and run with:
docker run -p 1972:1972 myDockerContainer
FROM ibmjava:sdk
RUN mkdir /opt/app
COPY HelloWorld.java /opt/app
WORKDIR /opt/app
RUN javac  HelloWorld.java
EXPOSE 1972
CMD ["java","-Dcom.sun.management.jmxremote","-Dcom.sun.management.jmxremote.authenticate=false","-Dcom.sun.management.jmxremote.ssl=false","-Dcom.sun.management.jmxremote.rmi.port=1972","-Djava.rmi.server.hostname=9.140.104.32","-Dcom.sun.management.jmxremote.local.only=false","-Xhealthcenter:transport=jrmp","HelloWorld"]
Gathering HCD at Runtime
- Go to the current working directory (cwd) of the process. For
example, for tWAS, that's normally
/opt/IBM/WebSphere/AppServer/profiles/${PROFILE}/ - Underneath the cwd, there should be a temporary directory that
HealthCenter created. This is normally named
tmp_${NUMBER1}_${NUMBER2}_. If this directory is not found under the profiles directory, check under/tmp. If it's still not found, uselsofto search for the trace file:lsof -p ${PID} | grep "trace$" - Copy the contents of this directory to a temporary directory. For
example:
mkdir /tmp/hc cp tmp*_/* /tmp/hc/ - Go to the temporary directory. For example:
cd /tmp/hc/ - Zip up the files in this directory (if you don't have the zip
utility, you can use the jar utility in the JDK which also creates a zip
file):
zip hctmp.hcd *
HCD File Name
The HCD file name is of the form
${dir}/${prefix}healthcenter${startday}${startmonth}${startyear}_${starthour}${startminutes}${startsseconds}_${pid}_${filenumber}.hcd.
The temporary directory name is of the form
${dir}/tmp_${startday}${startmonth}${startyear}_${starthour}${startminutes}${startsseconds}_.
By default, ${dir} is the current working directory but
may be overridden with
-Dcom.ibm.java.diagnostics.healthcenter.headless.output.directory=somedir.
By default, ${prefix} is blank but may be set with
-Dcom.ibm.java.diagnostics.healthcenter.headless.filename=someprefix.
If this is set, an _ is automatically appended to the
prefix; therefore, the file will be
${prefix}_healthcenter.... On WAS traditional, if this is
set in the generic JVM arguments, the name of the WAS JVM may be set
with
-Xhealthcenter:level=headless -Dcom.ibm.java.diagnostics.healthcenter.headless.filename=${WAS_SERVER_NAME}.
Agent Version
To find out the agent version from the JDK, extract
hcversion.properties (version.properties on
older JDKs) from healthcenter.jar:
$ jar xf healthcenter.jar hcversion.properties && cat hcversion.properties && rm hcversion.properties
jar.version=3.0.17.20190121
Disabling Components
Particular Health Center components
may be disabled with off system properties. For
example:
-Dcom.ibm.diagnostics.healthcenter.data.classes=off
-Dcom.ibm.diagnostics.healthcenter.data.cpu=off
-Dcom.ibm.diagnostics.healthcenter.data.gc=off
-Dcom.ibm.diagnostics.healthcenter.data.io=off
-Dcom.ibm.diagnostics.healthcenter.data.jit=off
-Dcom.ibm.diagnostics.healthcenter.data.memory=off
-Dcom.ibm.diagnostics.healthcenter.data.profiling=off
-Dcom.ibm.diagnostics.healthcenter.data.threads=off
Diagnostic Traces
- Log trace engine configuration processing:
-Dcom.ibm.diagnostics.healthcenter.logging.TraceDataProvider=debug - Headless file processing:
-Dcom.ibm.diagnostics.healthcenter.logging.headless=debug - Investigating MBean
authentication/authorization:
Then set diagnostic trace using the product trace mechanism, or-Dcom.ibm.java.diagnostics.healthcenter.agent.debug=true-Djava.util.logging.config.file:com.ibm.java.diagnostics.healthcenter.agent=allcom.ibm.java.diagnostics.healthcenter.agent.mbean.HCLaunchMBean=all
- Others:
-Dcom.ibm.diagnostics.healthcenter.logging.Port=debug
-Dcom.ibm.diagnostics.healthcenter.logging.ClassHistogram=debug
-Dcom.ibm.diagnostics.healthcenter.logging.cpuplugin=debug
Large Memory Allocations
Health Center may be configured to track large memory allocations based on a number of bytes. For example, to track allocations greater than 10MB:
-Dcom.ibm.java.diagnostics.healthcenter.allocation.threshold.low=10485760Note that, under the covers, this will cause Health Center to configure -Xdump. For example:
-Xdump:silent:events=allocation,filter=#10485760...This will not produce any output files and will only be tracked by Health Center; however, this will silently increment the diagnostic artifact ID every time such an allocation occurs. This may explain very large artifact numbers in other produced files such as javacores, etc.
Health Center Thread Stacks
The profiler in Health Center is only aware of threads that use CPU, so if a thread is waiting on a database, for example, it will not show up in Health Center. However, starting with the Health Center agent version 2.2, it periodically captures every thread stack. The Health Center client has minimal capabilities to display this information; however, you can use the Health Center API to read an HCD file and print these stacks:
import java.io.File;
import java.io.PrintWriter;
import java.lang.Thread.State;
import java.lang.management.LockInfo;
import java.lang.management.MonitorInfo;
import java.text.SimpleDateFormat;
import java.util.ArrayList;
import java.util.Comparator;
import java.util.Date;
import java.util.HashMap;
import java.util.List;
import java.util.Map;
import java.util.Map.Entry;

import com.ibm.java.diagnostics.healthcenter.api.HealthCenter;
import com.ibm.java.diagnostics.healthcenter.api.factory.HealthCenterFactory;
import com.ibm.java.diagnostics.healthcenter.api.threads.ThreadData;
import com.ibm.java.diagnostics.healthcenter.api.threads.ThreadsData;

public class HealthCenterThreadDumpAnalyzer {
  private static final SimpleDateFormat threadDumpDate = new SimpleDateFormat("yyyy-MM-dd HH:mm:ss");

  public static void main(String[] args) throws Throwable {
    if (args == null || args.length == 0) {
      System.err.println("usage: HealthCenterThreadDumpAnalyzer ${HCDFILE}");
      return;
    }

    File file = new File(args[0]);

    message("Loading " + file.getAbsolutePath());

    HealthCenter hc = HealthCenterFactory.connect(file);

    message("Getting all thread dumps");

    ThreadsData threadsData = hc.getThreadsData();
    HashMap<Long, ThreadData[]> threadDumps = threadsData.getAllThreads();
    List<Entry<Long, ThreadData[]>> sortedThreadDumps = new ArrayList<>();
    for (Entry<Long, ThreadData[]> entry : threadDumps.entrySet()) {
      sortedThreadDumps.add(entry);
    }
    sortedThreadDumps.sort(new Comparator<Entry<Long, ThreadData[]>>() {
      @Override
      public int compare(Entry<Long, ThreadData[]> x, Entry<Long, ThreadData[]> y) {
        return x.getKey().compareTo(y.getKey());
      }
    });

    message("Processing all " + sortedThreadDumps.size() + " thread dumps");

    try (PrintWriter out = new PrintWriter(new File(file.getParentFile(), file.getName() + "_threads.txt"))) {
      for (Entry<Long, ThreadData[]> threadDump : sortedThreadDumps) {
        out.println(threadDumpDate.format(new Date(threadDump.getKey())));
        out.println("Full thread dump Java:");
        out.println();

        ThreadData[] threads = threadDump.getValue();
        Map<String, String> contendedMonitorOwners = new HashMap<>();
        for (int i = 0; i < threads.length; i++) {
          ThreadData thread = threads[i];
          if (thread.getContendedMonitor() != null && !thread.getContendedMonitor().isEmpty()
              && thread.getContendedMonitorOwner() != null
              && !thread.getContendedMonitorOwner().isEmpty()) {
            contendedMonitorOwners.put(thread.getContendedMonitorOwner(), thread.getContendedMonitor());
          }
        }

        for (int i = 0; i < threads.length; i++) {
          ThreadData thread = threads[i];
          String threadName = thread.getName();

          String nid = String.format("%08x", threadName.hashCode());
          nid = "0" + nid.substring(1);

          out.println("\"" + threadName + "\" #" + i + " daemon prio=9 os_prio=0 tid=0x"
              + String.format("%016x", threadName.hashCode()) + " nid=0x" + nid + " "
              + getThreadDumpThreadState(thread.getState()) + " [0x0000000000000000]");

          out.println("   java.lang.Thread.State: " + thread.getState());

          StackTraceElement[] threadStack = thread.getStackTrace();

          if (threadStack != null) {
            boolean firstFrame = true;
            for (StackTraceElement frame : threadStack) {
              out.println("   at " + frame);

              if (firstFrame) {
                firstFrame = false;

                if (thread.getContendedMonitor() != null && !thread.getContendedMonitor().isEmpty()) {
                  String contendedMonitor = thread.getContendedMonitor();
                  writeContendedMonitor(out, contendedMonitor, true);
                }
              }
            }

            for (MonitorInfo monitor : thread.getLockedMonitors()) {
              out.println("   - locked " + monitor);
              throw new IllegalStateException("Not implemented " + monitor);
            }

            for (LockInfo lock : thread.getLockedSynchronizers()) {
              out.println("   - locked " + lock);
              throw new IllegalStateException("Not implemented " + lock);
            }

            for (String ownedMonitor : thread.getOwnedMonitors()) {
              int space = ownedMonitor.indexOf(' ');
              if (space != -1) {
                ownedMonitor = ownedMonitor.substring(0, space);
              }
              out.println("   - locked <0x" + String.format("%016x", ownedMonitor.hashCode()) + "> (a "
                  + ownedMonitor + ")");
            }

            String contendedMonitor = contendedMonitorOwners.get(threadName);
            if (contendedMonitor != null) {
              writeContendedMonitor(out, contendedMonitor, false);
            }
          }

          out.println();
        }

        out.println();
      }
    }

    message("Finished processing");
    System.exit(0);
  }

  private static void writeContendedMonitor(PrintWriter out, String contendedMonitor, boolean waiting) {
    String className = contendedMonitor.substring(0, contendedMonitor.indexOf('@'));
    String identityHashCode = contendedMonitor.substring(contendedMonitor.indexOf('@') + 1);
    out.println("   - " + (waiting ? "waiting to lock" : "locked") + " <0x"
        + String.format("%016x", Long.parseLong(identityHashCode, 16)) + "> (a " + className + ")");
  }

  public static String getThreadDumpThreadState(State threadState) {
    switch (threadState) {
    case BLOCKED:
      return "waiting for monitor entry";
    case NEW:
      return "new";
    case RUNNABLE:
      return "runnable";
    case TERMINATED:
      return "terminate";
    case TIMED_WAITING:
      return "waiting on condition";
    case WAITING:
      return "waiting on condition";
    default:
      throw new IllegalStateException("Not implemented for " + threadState);
    }
  }

  public static void message(String message) {
    System.out.println("[" + new Date() + "] " + message);
  }
}
By default, Health Center captures full stacks. If this appears to be
a performance impact, you can limit this with
-Dcom.ibm.java.diagnostics.healthcenter.thread.stack.depth=${MAXDEPTH}
The default thread stack collection interval is 30 seconds. This can
be changed with
-Dcom.ibm.java.diagnostics.healthcenter.thread.collection.interval=${SECONDS}
To disable collection of thread stacks:
-Dcom.ibm.diagnostics.healthcenter.data.threads=off