Troubleshooting WAS Traditional
Troubleshooting WAS Traditional Recipe
Review all warnings and errors in System*.log (or using logViewer if HPEL is enabled) before and during the problem. A regular expression search is
" [W|E] ". One common type of warning is an FFDC warning which points to a matching file in the FFDC logs directory.If you're on Linux or use cygwin, use the following command:
find . -name "*System*" -exec grep " [W|E] " {} \; | grep -v -e known_error
Review all JVM* messages in native_stderr.log before and during the problem. This may include things such as OutOfMemoryErrors. The filename of such artifacts includes a timestamp of the form YYYYMMDD.
Review any strange messages in native_stdout.log before and during the problem.
If verbose garbage collection is enabled, review verbosegc in native_stderr.log (IBM Java), native_stdout.log (Oracle Java), or any verbosegc.log files (if using -Xverbosegclog or -Xloggc) in the IBM Garbage Collection and Memory Visualizer Tool and ensure that the proportion of time in garbage collection for a relevant period before and during the problem is less than 10%
Review any javacore*.txt files in the IBM Thread and Monitor Dump Analyzer tool. Review the causes of the thread dump (e.g. user-generated, OutOfMemoryError, etc.) and review threads with large stacks and any monitor contention.
Review any heapdump*.phd and core*.dmp files in the IBM Memory Analyzer Tool
Server Start
When the server is started or a log file is rolled, the following messages will be written to SystemOut and trace logs. For example:
************ Start Display Current Environment ************
WebSphere Platform 9.0.5.1 [BASE 9.0.5.1 f5011934.01] [JAVA8 8.0.6.0 pxa6480sr6-20191107_01] running with process name DefaultCell01\DefaultNode01\server1 and process id 1522
Full server name is DefaultCell01\DefaultNode01\server1-1522
Host Operating System is Linux, version 4.19.76-linuxkit
[...]
************* End Display Current Environment *************
Initial Trace Setting
When the server is started or a log file is rolled, unless the message has been disabled, the following message is written to SystemOut and trace logs. For example:
[4/15/20 10:47:01:227 EST] 00000001 ManagerAdmin I TRAS0017I: The startup trace state is *=info.Open for e-business
When the server has fully started, unless the message has been disabled, the following message will be written to SystemOut and trace logs. For example:
[4/15/20 10:47:02:577 EST] 00000001 WsServerImpl A WSVR0001I: Server OpServer11 open for e-businessTrace State Changed
When the state of diagnostic trace changes, unless the message has been disabled, the following message will be written to SystemOut and trace logs. For example:
[4/15/20 10:45:02:005 EST] 00000159 ManagerAdmin I TRAS0018I: The trace state has changed. The new trace state is *=info:com.ibm.ws.cache.*=all.WAS and Java
When upgrading WAS fixpacks, the Java fixpack should also be upgraded: https://www-304.ibm.com/support/docview.wss?uid=swg27005002
The Java SDK can be upgraded to any version available for that WAS major version. For example, if you are on WAS 6.1.0.21 but you want to run the 6.1.0.29 Java SDK, that is supported, although this is obviously a less tested configuration. You cannot use a WAS 7 SDK on WAS 6.1, for example.
Diagnostic plans: https://www.ibm.com/support/knowledgecenter/en/SSAW57_9.0.5/com.ibm.websphere.nd.multiplatform.doc/ae/ttrb_diagplan.html
PID File
It is possible to automate finding the process ID of particular application server through scripts. Each application server writes a file named ${SERVER}.pid into its log folder on startup. For example, on POSIX systems:
$ someScript.sh `cat /opt/IBM/WebSphere/AppServer/profiles/profile1/logs/server1/*.pid`Stopping Servers
There are four ways to stop a WAS server (http://www-01.ibm.com/support/knowledgecenter/SSAW57_8.5.5/com.ibm.websphere.nd.multiplatform.doc/ae/urun_rsvr.html?lang=en):
- WAS Stop: Quiesce the server so that no new work is allowed in, allow existing work tracked by WAS to finish, then gracefully stop all applications, shutdown WAS components, and attempt to gracefully exit the Java process. By default, WAS will wait up to 3 minutes for the quiesce to complete. This can be changed with com.ibm.ejs.sm.server.quiesceTimeout: http://www-01.ibm.com/support/knowledgecenter/SSAW57_8.5.5/com.ibm.websphere.nd.multiplatform.doc/ae/xrun_jvm.html?cp=SSAW57_8.5.5%2F3-18-6-481&lang=en
- WAS Immediate Stop: This is the same as a WAS Stop, except that it does not wait for existing work to finish. Based on tests on V9, ImmediateStop still waits for in-flight requests to finish just like the Stop function.
- WAS Terminate: Unlike the stop and immediate stop methods, this method does not attempt to gracefully exit the Java process, but instead uses operating system commands to kill the process.
- Operating system signal: Depending on the type of signal, either the process will end without any handling within WAS (destructive signal, e.g. SIGKILL) or as a WAS Immediate Stop (e.g. SIGTERM). WAS accomplishes the latter through a shutdown hook (http://docs.oracle.com/javase/7/docs/api/java/lang/Runtime.html#addShutdownHook%28java.lang.Thread%29).
It is recommended to first try a WAS Stop, wait 3 minutes, then try a WAS Immediate Stop, and finally try a WAS Terminate.
In the case of a WAS Terminate or a destructive operating system signal, the following are examples of some possible effects:
- Transaction log: If an application uses transactions and the process ended during an in-flight transaction, the transaction log may need to be processed.
- OSGi cache: If the process ended during OSGi activity, the OSGi cache may need to be reset with osgiCfgInit and clearClassCache.
- IBM Java shared class cache: If the process ended during IBM Java shared class cache activity, the cache may need to be reset with Java commands.
- HTTP sessions: If HTTP sessions are configured for distribution or persistence, some sessions may not have been committed and their states will be lost.
Request Thread Dump
Additional methods of requesting thread dumps are documented in the Troubleshooting Java chapters.
- On IBM Java, use `wsadmin -lang jython` and run the following command, replacing server1 with the server name:
AdminControl.invoke(AdminControl.completeObjectName("type=JVM,process=server1,*"), "dumpThreads") - On Windows, use the windows_hang.py script which essentially does the same as #1 with much more flexibility: http://www-01.ibm.com/support/docview.wss?rs=180&uid=swg21111364
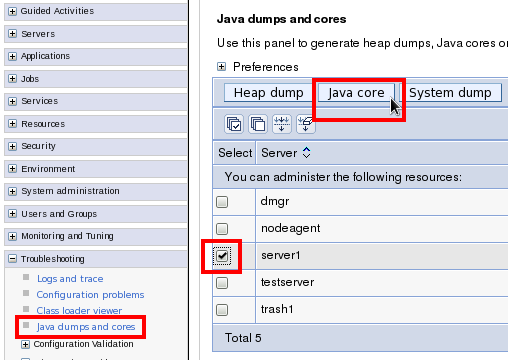
- On IBM Java and WAS >= 8, use the administrative console, Java dumps and cores pane:
- On Windows, generate an attached start server script with `startServer.bat -script`, start the server using the generated script, and now since you have an attached console, you can type Ctrl+Break to request a thread dump.
JVM.dumpThreads
The dumpThreads functionality is different depending on the operating system:
- POSIX (AIX, Linux, Solaris, etc.): kill(pid, SIGQUIT)
- Windows: raise(SIGBREAK)
- z/OS: In recent versions, produces a javacore, heapdump, and SYSTDUMP by default
For any customers that have changed the behavior of the JVM (-Xdump) in how it responds to SIGQUIT/SIGBREAK (i.e. kill -3), then dumpThreads will respond accordingly (unless running z/OS, in which case use wsadmin_dumpthreads* properties).
Request Heap Dump
Additional methods of requesting heap dumps are documented in the Troubleshooting Java chapters.
- On IBM Java, use `wsadmin -lang jython` and run the following command, replacing server1 with the server name:
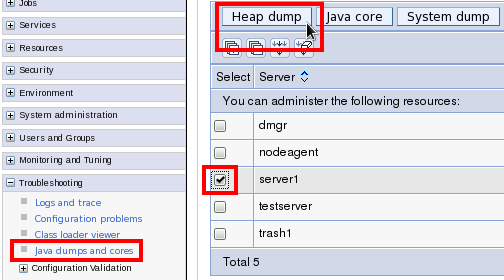
AdminControl.invoke(AdminControl.completeObjectName("type=JVM,process=server1,*"), "generateHeapDump") - On IBM Java and WAS >= 8, use the administrative console, Java dumps and cores pane:
Request System Dump
Additional methods of requesting system dumps are documented in the Troubleshooting Operating Systems and Troubleshooting Java chapters.
- On IBM Java and WAS >= 8, use `wsadmin -lang jython` and run the following command, replacing server1 with the server name:
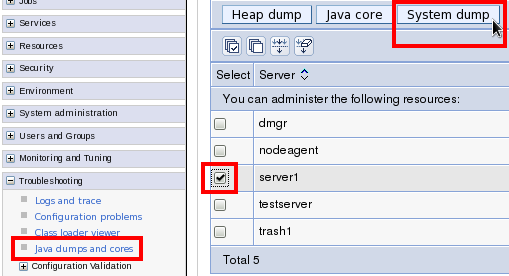
AdminControl.invoke(AdminControl.completeObjectName("type=JVM,process=server1,*"), "generateSystemDump") - On IBM Java and WAS >= 8, use the administrative console, Java dumps and cores pane:
ClassLoader Leaks
ClassLoader leaks become most evident when an application is restarted and its old classes are not available for garbage collection. This may induce longer garbage collection times, Java OutOfMemoryErrors, and native OutOfMemoryErrors.
- The IBM Extensions for Memory Analyzer in the IBM Memory Analyzer Tool provide two classloader leak detection queries.
- WAS 8.5 introduces some basic classloader leak detection (disabled by default): http://www-01.ibm.com/support/knowledgecenter/SSAW57_8.5.5/com.ibm.websphere.nd.multiplatform.doc/ae/ctrb_memleakdetection.html?lang=en
Thread IDs in Logs
Before WAS 8.5, the "thread ID" printed in WAS logs (the hexadecimal number after the timestamp) comes from the java/util/logging/LogRecord.getThreadID method. This number was not in javacores, so there was no easy way to correlate javacores with log and trace messages. Moreover, this thread ID was different from java/lang/Thread.getID which might be printed in other components, and that thread ID also wasn't in javacores. There were some complex techniques of correlating IDs: http://www-304.ibm.com/support/docview.wss?uid=swg21418557
WAS 8.5 has changed the ID printed in logs to the value from java/lang/Thread.getID. This can be changed back to the previous behavior using com.ibm.websphere.logging.useJULThreadID=true. See: http://www14.software.ibm.com/webapp/wsbroker/redirect?version=phil&product=was-nd-mp&topic=rtrb_readmsglogs. This was also backported to WAS 8.0.0.4 (PM60913); however, it must be explicitly enabled in WAS 8.0.
With IBM Java 6 SR12 (WAS 7.0.0.27), IBM Java 626 SR4 (WAS 8.0.0.6, 8.5.0.2, 8.5.5.0), and IBM Java 7 SR3 (WAS 8.5.0.2, 8.5.5.0), javacores will have the value of Thread.getID printed with each stack. Given the above change, this allows you to correlate WAS log messages with javacores (note the bold and underlined parts):
[8/22/12 10:00:05:049 PDT] 0000005b SystemOut     O swat.ear: Calling com.ibm.jvm.Dump.JavaDump()... Thread.getId=0x5b

3XMTHREADINFO      "WebContainer : 1" J9VMThread:0x0000000012593E00, j9thread_t:0x00007F7F542C6FF0, java/lang/Thread:0x00000000104FEE78, state:R, prio=5
3XMJAVALTHREAD            (java/lang/Thread getId:0x5B, isDaemon:true)
3XMTHREADINFO1            (native thread ID:0x5859, native priority:0x5, native policy:UNKNOWN)
3XMTHREADINFO2            (native stack address range from:0x00007F8031226000, to:0x00007F8031267000, size:0x41000)
3XMHEAPALLOC             Heap bytes allocated since last GC cycle=2132320 (0x208960)
3XMTHREADINFO3           Java callstack:
4XESTACKTRACE                at com/ibm/jvm/Dump.JavaDumpImpl(Native Method)
TrapIt.ear
TrapIt.ear is a free enterprise application which may be installed to watch for particular log messages and generate diagnostics such as thread dumps, as well as time-based triggers to do the same: http://www-01.ibm.com/support/docview.wss?uid=swg21644180
High Availability Manager
JVM Panic
Under some conditions, the High Availability Manager will "panic," print some diagnostics, and then force the WAS process to stop itself. The symptoms of this will include:
1. A stack trace in RuntimeProviderImpl.panicJVM in SystemErr.log. For example:
[1/1/15 00:00:00:000 UTC] 00000001 SystemErr     R java.lang.Throwable
[1/1/15 00:00:00:000 UTC] 00000001 SystemErr     R     at java.lang.Thread.dumpStack(Thread.java:434)
[1/1/15 00:00:00:000 UTC] 00000001 SystemErr     R     at com.ibm.ws.hamanager.runtime.RuntimeProviderImpl.panicJVM(RuntimeProviderImpl.java:91)
[1/1/15 00:00:00:000 UTC] 00000001 SystemErr     R     at com.ibm.ws.hamanager.coordinator.impl.JVMControllerImpl.panicJVM(JVMControllerImpl.java:56)
[1/1/15 00:00:00:000 UTC] 00000001 SystemErr     R     at com.ibm.ws.hamanager.impl.HAGroupImpl.doIsAlive(HAGroupImpl.java:882)
[1/1/15 00:00:00:000 UTC] 00000001 SystemErr     R     at com.ibm.ws.hamanager.impl.HAGroupImpl$HAGroupUserCallback.doCallback(HAGroupImpl.java:1388)
[1/1/15 00:00:00:000 UTC] 00000001 SystemErr     R     at com.ibm.ws.hamanager.impl.Worker.run(Worker.java:64)
[1/1/15 00:00:00:000 UTC] 00000001 SystemErr     R     at com.ibm.ws.util.ThreadPool$Worker.run(ThreadPool.java:1691)
2. A "Panic" line in SystemOut.log with a detailed description of the reason for the panic. For example:
Panic:component requested panic from isAlive3. A stack trace in ServerImpl.emergencyShutdown in SystemOut.log. For example:
[1/1/15 00:00:00:000 UTC] 00000001 SystemOut     O java.lang.RuntimeException: emergencyShutdown called:
[1/1/15 00:00:00:000 UTC] 00000001 SystemOut     O     at com.ibm.ws.runtime.component.ServerImpl.emergencyShutdown(ServerImpl.java:633)
[1/1/15 00:00:00:000 UTC] 00000001 SystemOut     O     at com.ibm.ws.hamanager.runtime.RuntimeProviderImpl.panicJVM(RuntimeProviderImpl.java:92)
[1/1/15 00:00:00:000 UTC] 00000001 SystemOut     O     at com.ibm.ws.hamanager.coordinator.impl.JVMControllerImpl.panicJVM(JVMControllerImpl.java:56)
[1/1/15 00:00:00:000 UTC] 00000001 SystemOut     O     at com.ibm.ws.hamanager.impl.HAGroupImpl.doIsAlive(HAGroupImpl.java:866)
[1/1/15 00:00:00:000 UTC] 00000001 SystemOut     O     at com.ibm.ws.hamanager.impl.HAGroupImpl$HAGroupUserCallback.doCallback(HAGroupImpl.java:1364)
[1/1/15 00:00:00:000 UTC] 00000001 SystemOut     O     at com.ibm.ws.hamanager.impl.Worker.run(Worker.java:64)
[1/1/15 00:00:00:000 UTC] 00000001 SystemOut     O     at com.ibm.ws.util.ThreadPool$Worker.run(ThreadPool.java:1604)
One common cause of these panics is that the SIB messaging engine cannot communicate with its data store due to a database error. For example, messages such as the following precede the panic:
[1/1/15 00:00:00:000 UTC] 00000001 ConnectionEve A   J2CA0056I: The Connection Manager received a fatal connection error from the Resource Adapter
for resource jdbc/sibdb. The exception is: com.ibm.db2.jcc.am.zn: [jcc] [t4][2030][11211][3.57.110] A communication error occurred during operations
on the connection's underlying socket, socket input stream, or socket output stream.  Error location: Reply.fill().  Message: Insufficient data.
ERRORCODE=-4499, SQLSTATE=08001
[1/1/15 00:00:00:000 UTC] 00000001 SibMessage    I   ... CWSIS1519E: Messaging engine ${ME} cannot obtain the lock on its data store,
which ensures it has exclusive access to the data.
[1/1/15 00:00:00:000 UTC] 00000001 SibMessage    E   ... CWSID0046E: Messaging engine ${ME} detected an error and cannot continue to run in this server.
[1/1/15 00:00:00:000 UTC] 00000001 HAGroupImpl   I   HMGR0130I: The local member of group ...,WSAF_SIB_MESSAGING_ENGINE=...,type=WSAF_SIB has
indicated that is it not alive. The JVM will be terminated.
This is expected behavior and the database needs to be investigated or the data source configuration needs to be tuned: "Behavior when the data store connection is lost... default: The high availability manager stops the messaging engine and its hosting application server when the next core group service Is alive check takes place (the default value is 120 seconds)." (http://www-01.ibm.com/support/knowledgecenter/SSAW57_8.5.5/com.ibm.websphere.nd.multiplatform.doc/ae/tjm_dsconnloss.html)
Messaging
Light weight ME-to-ME tracing: http://www-01.ibm.com/support/docview.wss?uid=swg1PI34044
Users Seeing other Users' Data
The call center is getting reports and screenshots from users who see not their own data but another user's data. Depending on the number of reports received it may necessitate shutting down the web site until the problem can be diagnosed and fixed. This is one of the most difficult problems troubleshoot and identify root cause. Try to recreate the problem in one of the application test environments. Hopefully it is easily recreateable, however, the symptom may not exhibit itself in a test environment.
Strategy 1: Open a PMR with IBM Support
It is imperative to open a PMR with IBM Support immediately and verify with the support specialist that there is no known issue for which a known APAR is available. If there is an APAR then download and install the APAR and restart the application server environment.
Monitor
Monitor reports from the user community and if reports continue to come in that users see other user's data then pursue one of the other strategies.
Caveat
Applying the APAR does not guarantee it will fix the problem if the issue resides within the application code itself. The APAR is only applicable if it is a bug in the WebSphere Application Server.
Strategy 2: Application code review
Review the application code and look for one of the following anti-patterns that may be causing users to see another user's data. In no particular order:
- Not clearing thread local variables. [note: was this a feature we added to WAS and no longer a problem since some version?]
- Storing data within the Servlet in an instance variable defined at the Servlet class.
Monitor
Fix the code, rebuild the application, redeploy and test the application. Once it passes the testing process deploy to production. Monitor reports from the user community.
Caveat
Because this type of application bug is so difficult to diagnose and resolve the application "fix" may not actually fix the problem. Because of there being multiple bugs there may be several iterations of of this strategy.
DRS or HA Manager Errors
Distributed Replication Server or HA Manager errors appear in the logs of either the DMgr or the nodeagents or application server logs themselves.
Strategy 1: Check version/fixpack level of DMgr and JVMs putting out errors
Sometimes a fixpack may be inadvertently missed on a particular JVM or node. Apply the fixpack, restart and see if that fixes the problem.
Monitor
Logs for recurrence of the error
Caveats
Sometimes applying a fixpack may negatively affect an application. Make sure to test all fixpacks before applying them in production.
Strategy 2: Application code is using DistributedMap class
An application that aggressively uses DistributedMap may negatively increase the amount of communication between the application servers. This typically exhibits itself when either the number of application server JVMs is increased or the thread pool for the application is increased inside the JVM. This also inhibits the ability to grow the environment as the user base grows. Therefore, reconsider the use of DistributedMap in an application particularly for high volume, business critical applications.
Monitor
Logs for recurrence of the error.
Caveats
Re-architecting/desgining and re-coding the application to eliminate the use of DistributedMap can take weeks to months depending on how extensively DistributedMap was used.
Application Works in some Nodes
The same EAR file is deployed to two nodes. It works on one node but not another.
Strategy 1: NoClassDefFoundError thrown
Collect the data for class loader mustgather http://www-01.ibm.com/support/docview.wss?uid=swg21196187
Analyze the data. Following things should be checked very carefully.
In the trace.log find the full "Local Classpath" for the application. Compare the working node to the non-working node. Very often the administrator is somehow not deploying the application correctly and puts in a classpath that is either missing items or rearranging the order which picks up a different version of the same jar file.
In the one case I worked today: Application worked on AIX/Windows but NoClassDefFoundError on Linux. It is a JSF application but not supposed to use JSF2. But the jsf2 lib was included in the EAR file. On the working nodes the non-JSF2 impl lib was preceding the JSF2 lib. On the non-working Linux node they were reversed and of course the JSF2 class had a dependency they must not have included.
Previous Section (Troubleshooting WebSphere Application Server) | Next Section (Troubleshooting WAS Liberty) | Back to Table of Contents