Troubleshooting Java
Sub-chapters
Request Heap Dump
There are many ways to request a heap dump depending on your Java vendor (and further depending on your operating system and WAS profile, detailed within each Java vendor's section):
Excessive Direct Byte Buffers
There are two main types of problems with Direct Byte Buffers:
- Excessive native memory usage
- Excessive performance overhead due to
System.gccalls by the DBB code
This section primarily discusses issue 1. For issue 2, note that IBM
Java starts
with a soft limit of 64MB and increases by 32MB chunks with a
System.gc each time, so consider setting
-XX:MaxDirectMemorySize=$BYTES (e.g.
-XX:MaxDirectMemorySize=1024m) to avoid this upfront cost
(although read on for how to size this).
For issue 1, excessive native memory usage by
java.nio.DirectByteBuffers is a classic problem with any
generational garbage collector such as gencon (which is the default
starting in IBM Java 6.26/WAS 8), particularly on 64-bit. DirectByteBuffers
(DBBs) are Java objects that allocate and free native memory. DBBs use a
PhantomReference which is essentially a more flexible finalizer and they
allow the native memory of the DBB to be freed once there are no longer
any live Java references. Finalizers and their ilk are generally not
recommended because their cleanup time by the garbage collector is
non-deterministic.
This type of problem is particularly bad with generational collectors because the whole purpose of a generational collector is to minimize the collection of the tenured space (ideally never needing to collect it). If a DBB is tenured, because the size of the Java object is very small, it puts little pressure on the tenured heap. Even if the DBB is ready to be garbage collected, the PhantomReference can only become ready during a tenured collection. Here is a description of this problem (which also talks about native classloader objects, but the principle is the same):
If an application relies heavily on short-lived class loaders, and nursery collections can keep up with any other allocated objects, then tenure collections might not happen very frequently. This means that the number of classes and class loaders will continue increasing, which can increase the pressure on native memory... A similar issue can arise with reference objects (for example, subclasses of java.lang.ref.Reference) and objects with finalize() methods. If one of these objects survives long enough to be moved into tenure space before becoming unreachable, it could be a long time before a tenure collection runs and "realizes" that the object is dead. This can become a problem if these objects are holding on to large or scarce native resources. We've dubbed this an "iceberg" object: it takes up a small amount of Java heap, but below the surface lurks a large native resource invisible to the garbage collector. As with real icebergs, the best tactic is to steer clear of the problem wherever possible. Even with one of the other GC policies, there is no guarantee that a finalizable object will be detected as unreachable and have its finalizer run in a timely fashion. If scarce resources are being managed, manually releasing them wherever possible is always the best strategy.
Essentially the problem boils down to either:
- There are too many DBBs being allocated (or they are too large), and/or
- The DBBs are not being cleared up quickly enough.
It is very important to verify that the volume and rate of DBB allocations are expected or optimal. If you would like to determine who is allocating DBBs (problem #1), of what size, and when, you can run a DirectByteBuffer trace. Test the overhead of this trace in a test environment before running in production.
If you would like to clear up DBBs more often (problem #2), there are a few options:
- Use
-XX:MaxDirectMemorySize=$BYTES
Specifying-XX:MaxDirectMemorySizewill force the DBB code to runSystem.gc()when the sum of outstanding DBB native memory would be more than$BYTES. This option may have performance implications. When using this option with IBM Java, ensure that-Xdisableexplicitgcis not used. The optimal value of$BYTESshould be determined through testing. The larger the value, the more infrequent theSystem.gcswill be but the longer each tenured collection will be. For example, start with-XX:MaxDirectMemorySize=1024mand gather throughput, response time, and verbosegc garbage collection overhead numbers and compare to a baseline. Double and halve this value and determine which direction is better and then do a binary search for the optimal value. - Explicitly call
System.gc. This is generally not recommended. When DBB native memory is freed, the resident process size may not be reduced immediately because small allocations may go onto amallocfree list rather than back to the operating system. So while you may not see an immediate drop in RSS, the free blocks of memory would be available for future allocations so it could help to "stall" the problem. For example, Java Surgery can inject a call to System.gc into a running process. - One common cause of excessive DBB allocations with WebSphere
Application Server is the default WAS WebContainer
channelwritetypevalue ofasync. See the WAS HTTP section for more details.
In most cases, something like
-XX:MaxDirectMemorySize=1024m (and ensuring
-Xdisableexplicitgc is not set) is a reasonable solution to the
problem.
A system dump or HPROF dump may be loaded in the IBM Memory Analyzer Tool & the IBM Extensions for Memory Analyzer DirectByteBuffer plugin may be run to show how much of the DBB native memory is available for garbage collection. For example:
=> Sum DirectByteBuffer capacity available for GC: 1875748912 (1.74 GB)
=> Sum DirectByteBuffer capacity not available for GC: 72416640 (69.06 MB)
Java Surgery
There is a technique called Java surgery which uses the Java Late Attach AP to inject a JAR into a running process and then execute various diagnostics.
This was designed initially for Windows because it does not usually
have a simple way of requesting a thread dump like kill -3
on Linux. Java Surgery has an option with IBM Java to run the
com.ibm.jvm.Dump.JavaDump() API to request a thread dump (HotSpot Java
does not have an equivalent API, although Java Surgery does generally
work on HotSpot Java):
$ java -jar surgery.jar -pid 16715 -command JavaDumpCore Dumps
More problems could be solved if customers took more operating system core dumps (or they weren't truncated with ulimits). It's amazing how much information can be extracted from a full address space dump. It is probably the most underutilized diagnostic artifact, particularly in situations where one wouldn't expect a memory dump to help.
However, core dumps are expensive. They take dozens of seconds to dump (during which time the process is frozen). They are often massive and take a long time to compress and upload. Finally, they take a long time to download, decompress and analyze. For these reasons, core dumps are underutilized (along with the security implications of capturing and transferring all raw memory in the process).
So, in the case that you don't know ahead of time that you need a core dump, when should you take operating system core dumps?
If the security, disk and performance risks are acceptable, an operating system core dump should be a step in every diagnostic procedure. For example, server hung? Do the normal performance MustGather, and then take a core dump.
But wait, didn't you just read that core dumps might be overkill? Yes. So what you should do is compress and save off the core dump into a special location. Only upload it if someone asks for it, or if you're otherwise stuck.
This is also a good way to deal with the security implications. With this approach, the data won't be lost, and in the case where the core dump is required, a secure way of handling or analyzing the core dump (perhaps even remotely) can be figured out.
Ensure core soft and hard ulimits are set to unlimited
It is a general best practice to set the core soft and hard ulimits to unlimited for Java processes.
It is critical that a system dump is not truncated so that the cause of crashes and other issues may be investigated. Review the documentation for your operating system to correctly configure ulimits:
- Linux: https://www.ibm.com/support/knowledgecenter/en/SSYKE2_8.0.0/com.ibm.java.80.doc/diag/problem_determination/linux_setup.html
- AIX: https://www.ibm.com/support/knowledgecenter/en/SSYKE2_8.0.0/com.ibm.java.80.doc/diag/problem_determination/aix_setup_full_core.html
- z/OS: https://www.ibm.com/support/knowledgecenter/en/SSYKE2_8.0.0/com.ibm.java.80.doc/diag/problem_determination/zos_setup_dumps.html
On J9 JVMs, the JVMJ9VM133W message is enabled with -Xcheck:dump and is a warning that system cores may be truncated if taken during a problem or for diagnostics if the core hard ulimit is not set to unlimited. For example:
JVMJ9VM133W The system core size hard ulimit is set to 2048, system dumps may be truncated.
When the J9 JVM produces the core dump itself (as with crashes and JVM-requested system dumps), it will increase the core soft limit to the hard limit automatically, so at the simplest level, it's only important to set the core hard ulimit to unlimited: https://github.com/eclipse/openj9-omr/blob/v0.15.0-release/port/unix/omrosdump.c#L307
However, if the core dump is produced in some other way, or if the JVM fails to fork itself to produce the core dump and instead the OS produces the core dump, then the soft limit will be used. Therefore, it's best to set both soft and hard core ulimits to unlimited.
Ensure core piping is configured properly or disabled on Linux
On Linux, the /proc/sys/kernel/core_pattern may be set
to a pipe (|) followed by a program to which a core dump is
streamed if a crash occurs. By default, this is not set on vanilla
Linux; however, most modern Linux distributions do set this by default,
often to |/usr/lib/systemd/systemd-coredump (the general
purpose is to avoid core dumps filling up all disk space). If such a
configuration is set, ensure such core
handling is configured properly using the instructions below so that
core dumps are produced and are not truncated, or completely disable
core piping.
Note that core_pattern cannot be set within a container so containers will generally send cores to the worker node rather than inside the container.
Properly configuring core piping
systemd-coredump
If /proc/sys/kernel/core_pattern is set to
|/usr/lib/systemd/systemd-coredump, then systemd-coredump
is configured.
systemd-coredump before and including version v250, by
default, truncates core dumps greater
than 2GB.
systemd-coredump after version v250, by default,
truncates core dumps greater
than 32GB on 64-bit and greater than 1GB on 32-bit.
The defaults show up as commented defaults in /etc/systemd/coredump.conf.
For example:
#ProcessSizeMax=2G
#ExternalSizeMax=2G
Thus, edit /etc/systemd/coredump.conf and update the
defaults; for example, start with something like the following but
change based on your available disk space:
ProcessSizeMax=100G
ExternalSizeMax=100G
MaxUse=500G
Compress=no
Then run:
sudo systemctl daemon-reloadJava processes do not need to be restarted for this change to take
effect. As of this writing, there is no way to specify
an unlimited value for ProcessSizeMax,
ExternalSizeMax or MaxUse which is why large
values like 100G are used above. Compression is also disabled to reduce
core dump production times.
By default, cores will go to /var/lib/systemd/coredump/.
The name
of a core dump, by default, is period-separated with
core, the process or thread name, user ID,
/proc/sys/kernel/random/boot_id, PID, and the time when the
core was created in microseconds since the Unix Epoch. However, in the
case of J9-forked core dumps, the process ID will not match the original
process (instead, use jdmpview's
info proc).
The command coredumpctl
provides various utility commands for working with core dumps.
For non-root users to get core dumps produced by
systemd-coredump, if acceptable by the operating system and
security teams, one solution is to add relevant users to the
systemd-journal group which provides
read-only access:
Journal files are, by default, owned and readable by the "systemd-journal" system group but are not writable. Adding a user to this group thus enables them to read the journal files.
Then such users can use the coredumpctl
command to access the core dumps without root access. First list all the
dumps:
coredumpctl listExample output:
# coredumpctl list
TIME                         PID UID GID SIG     COREFILE EXE            SIZE
Mon 2025-01-27 12:13:16 CST 2008   0   0 SIGABRT present  /usr/bin/bash 41.3K
Then write the core dump based on PID; for example, based on the
above output, the following writes core.dmp to the current
directory for PID 2008:
coredumpctl -o core.dmp dump 2008apport
If /proc/sys/kernel/core_pattern is set to
|/usr/share/apport/apport, then apport is
configured.
By default, cores should not be truncated by apport and they go to
/var/crash/ or /var/lib/apport/coredump.
rdp
If /proc/sys/kernel/core_pattern is set to
|/opt/dynatrace/oneagent/agent/rdp, then the Dynatrace
core dump processing program is configured.
The Dynatrace program does some basic processing of the core dump and
then pipes the core dump to the underlying core_pattern
that was configured at the time the Dynatrace program was installed.
This is located in the file
/opt/dynatrace/oneagent/agent/conf/original_core_pattern.
Since Eclipse OpenJ9 0.41 (IBM Java 8.0.8.15, and IBM Semeru Runtimes
v8.0.392, v11.0.21, and v17.0.9), if core_pattern includes
/oneagent/agent/rdp, then the JVM will attempt to
read the relative file
/oneagent/agent/conf/original_core_pattern and write its
contents in a javacore.txt file (though this will not work
in containers as the file is on the worker node); for example:
2CISYSINFO     /proc/sys/kernel/core_pattern = |/opt/dynatrace/oneagent/agent/rdp
2CISYSINFO     .../oneagent/agent/conf/original_core_pattern = |/usr/lib/systemd/systemd-coredump %P %u %g %s %t %c %h
abrt
If /proc/sys/kernel/core_pattern is set to
|/usr/libexec/abrt-hook-ccpp, then abrt
is configured.
Modify /etc/abrt/abrt.conf
- Set
MaxCrashReportsSize=0to avoid truncation. - By default, cores will go to
/var/spool/abrt. SetDumpLocation=/var/spool/abrtto another directory if/var/spool/is mounted on a small filesystem
Disabling core piping
You may completely disable the core piping and revert to the Linux
default of core which produces the core dump in the process
current working directory, but you must then manually monitor disk space
to ensure core dumps do not fill important disk partitions
(alternatively, create a dedicated partition for diagnostics and, on J9
JVMs, set -Xdump:directory=$DIR):
After core piping is disabled using the instructions below, the JVM does not need to be restarted for the changes to take effect.
On J9 JVMs, the JVMJ9VM135W message is enabled with
-Xcheck:dump and is a warning that system cores will be
piped. For example:
JVMJ9VM135W /proc/sys/kernel/core_pattern setting "|/usr/libexec/abrt-hook-ccpp %s %c %p %u %g %t e" specifies that core dumps are to be piped to an external program. The JVM may be unable to locate core dumps and rename them."It is often preferable to completely disable piping when running J9 JVMs because when the J9 JVM produces a core dump or handles a crash, it will post-process the core dump to rename it with additional information and also add some additional details into the core dump. The J9 JVM is not able to do this post-processing if a pipe program processes the core dump first. However, disabling piping will disable piping for all processes, so keep that in mind.
Disabling systemd-coredump core piping
If /proc/sys/kernel/core_pattern is set to
|/usr/lib/systemd/systemd-coredump, disable
systemd-coredump with:
sudo sh -c "ln -sf /dev/null /etc/sysctl.d/50-coredump.conf && sysctl -w kernel.core_pattern=core"Disabling apport core piping
If /proc/sys/kernel/core_pattern is set to
|/usr/share/apport/apport, disable with:
sudo systemctl stop apport
sudo systemctl disable apport
sudo systemctl mask apport
Disabling abrt core piping
If /proc/sys/kernel/core_pattern is set to
|/usr/libexec/abrt-hook-ccpp, disable with:
sudo systemctl stop abrtd
sudo systemctl disable abrtd
sudo systemctl mask abrtd
Native Java Agents
JVMTI is the latest and is available in Java 5 and replaces JVMDI and
JVMPI. JVMDI and JVMPI are fully deprecated in Java 6. When JVMPI is
enabled, the JVM looks for the exported method JVM_OnLoad
in the binary. When JVMTI is enabled, the JVM looks for the exported
method Agent_OnLoad in the binary.
JVMPI is specified using the -Xrun... command line
option
JVMTI is specified using the -agentlib... or
-agentpath... command line options
Java Serialization
Java serialization stream protocol: http://docs.oracle.com/javase/7/docs/platform/serialization/spec/protocol.html
The eye catcher for a serialized Java object in a byte stream is 0xAC 0xED (STREAM_MAGIC).
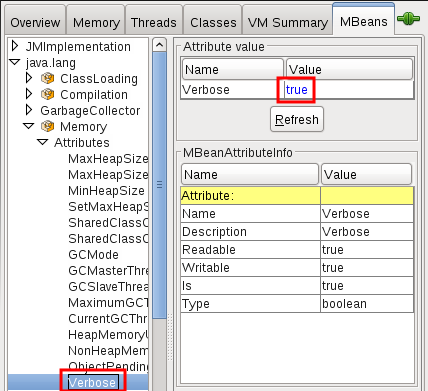
Verbose Garbage Collection
Verbose garbage collection may be dynamically enabled with the Memory MBean:
Killing Threads
The java/lang/Thread methods destroy, stop, and suspend are all deprecated and considered unsafe. The alternative is:
[...] code that simply modifies some variable to indicate that the target thread should stop running. The target thread should check this variable regularly, and return from its run method in an orderly fashion if the variable indicates that it is to stop running.
The java/lang/Thread interrupt method may be used for a "thread that waits for long periods (e.g., for input)". If the thread is in some well known methods like Object.wait, Thread.sleep, etc., or if the I/O channel is interruptible, then this will "inject" an exception into the thread which will be safely thrown. However, this will not work if the thread is in an infinite loop that is just using CPU and uses no interruptible APIs.
Liberty requestTiming has an optional interruptHungRequests="true"
option that attemps to interrupt a thread when it exceeds the
hungRequestThreshold on J9-based JVMs using its Interruptible
features; however, this may not work for run-away looping
threads.
Liberty has "hang resolution" for the entire thread pool when there are tasks in the queue and no tasks are being completed; however, this does not help with run-away threads.
WAS traditional on z/OS has the ability to recognize when a request has exceeded a configured amount of CPU usage and quiesce the associated WLM enclave which puts it in WLM's discretionary class. This is called the Interruptible Thread Infrastructure and also uses J9's Interruptible features.
There is a discussion about using jdb to inject a RuntimeException into a thread; however, the kill command is undocumented and is likely unsafe under all conditions. jdb also requires that the process has debugging enabled which has various implications.
WebSphere Application Server traditional has
Thread.interrupt capabilities as part of its memory
leak detection feature.
Patching
Notes for creating a patch:
- Every iteration of a diagnostic patch should include a log
entry of some kind to confirm the patch has been loaded correctly. Also
update the version number on each iteration so that the specific version
of a patch is being used may be confirmed. For example, add a static
initiailizer to one of the classes in the patch that is expected to be
used at runtime:
static {
  System.err.println("MyPatch V1");
}
Options to run a patch:
- For Java <=
8, create a jar with the classes and default manifest using
jar cvf mypatchV1.jar package1 package2and prepend it to the boot classpath:-Xbootclasspath/p:$PATH/mypatchV1.jar - For Java > 8, create a jar as above and patch
the the module at runtime with the option:
--patch-module $MOD=$PATH/mypatchV1.jar