- Review overall status: Administrator } Home } Overview }
Status
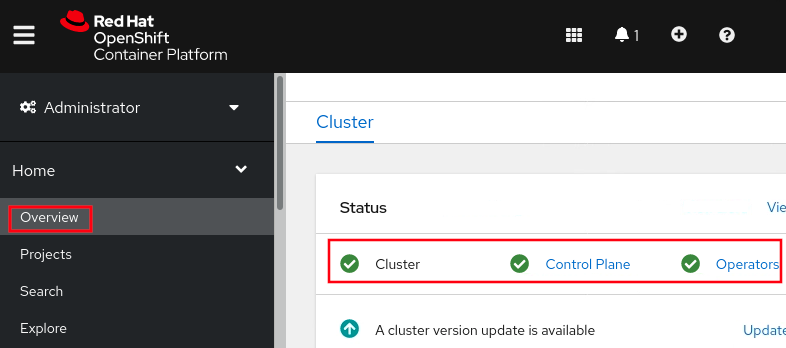
- Review node resource usage: Administrator } Home } Overview }
Cluster Utilization
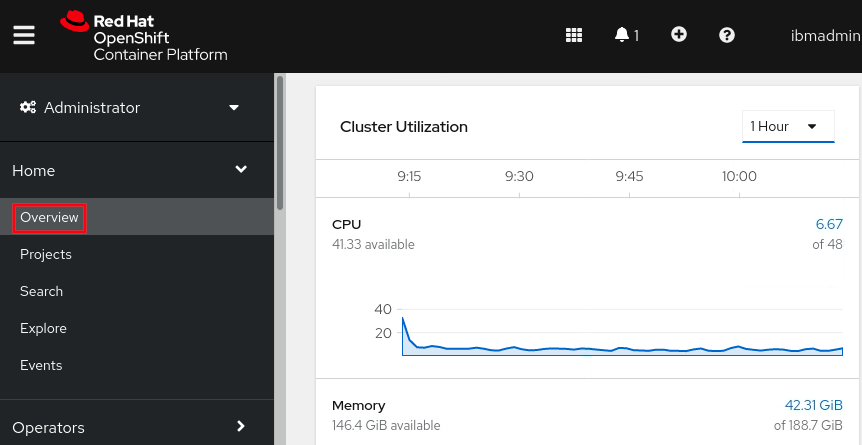
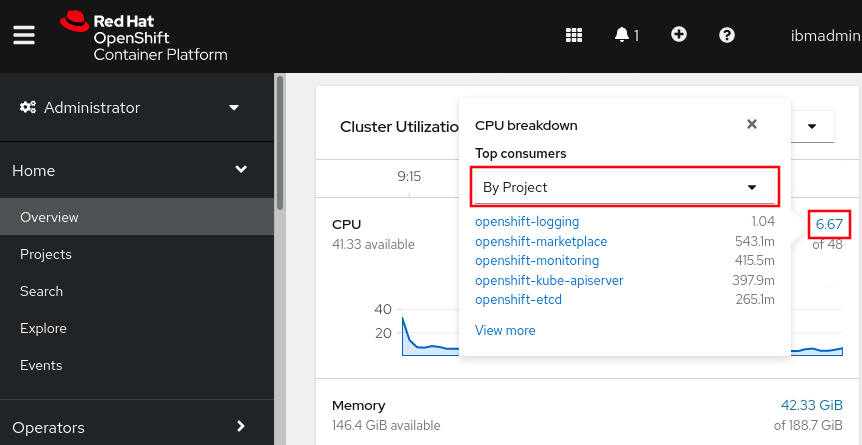
Click on the utilization number and use the dropdown to get different
views, e.g. By Node
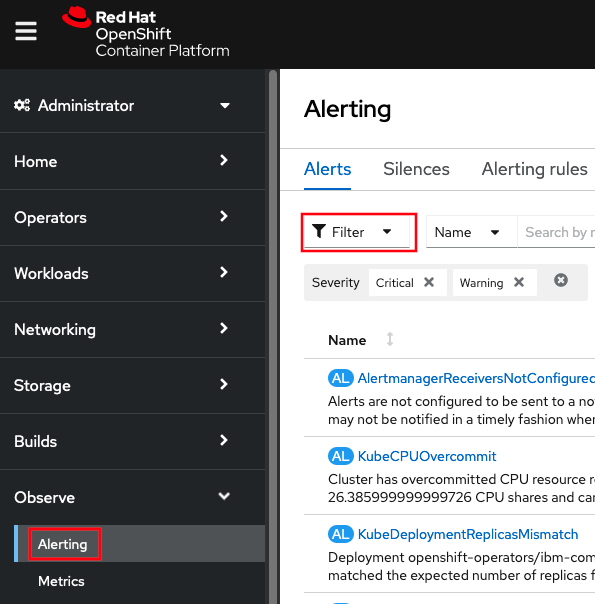
- Review critical and warning alerts: Administrator } Observe (or
Monitoring) } Alerting } Click "Filter", and check "Critical" and
"Warning"
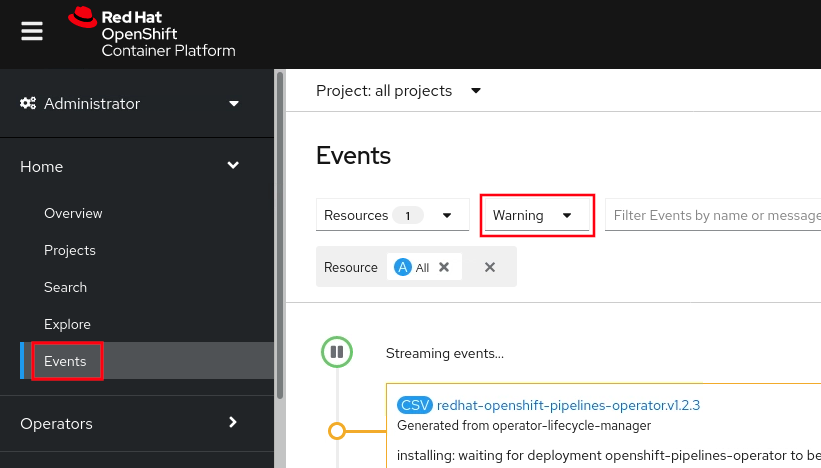
- Review recent warning and error events: Administrator } Home }
Events } Change "All types" to "Warning"
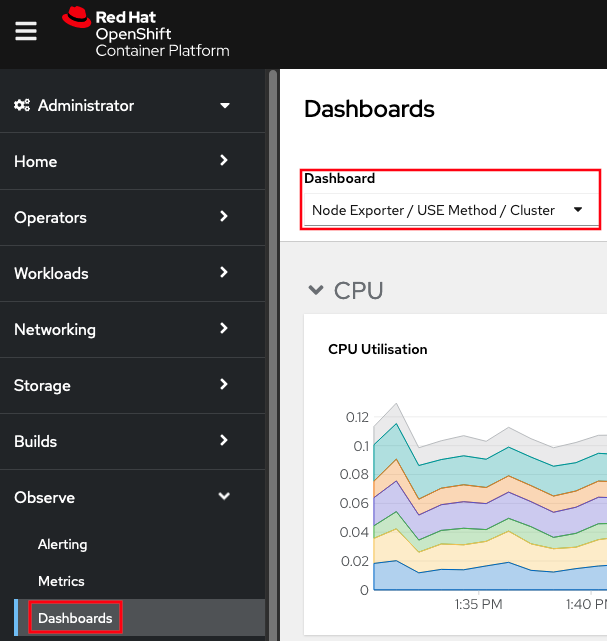
- Review deep dive utilization: Administrator } Observe (or
Monitoring) } Dashboards } Node Exporter / USE Method / Cluster
- Ensure you're logged in with
oc
- Review the overall cluster status:
$ oc get clusterversion
NAME      VERSION   AVAILABLE   PROGRESSING   SINCE   STATUS
version   4.10.10   True        False         87d     Error while reconciling 4.10.10: an unknown error has occurred: MultipleErrors
- If status includes "MultipleErrors", display all errors with:
oc get clusterversion -o 'jsonpath={.items[].status.conditions}'
- Review the status of nodes:
$ oc get nodes
NAME          STATUS     ROLES    AGE    VERSION
master0       Ready      master   201d   v1.20.0+df9c838
master1       Ready      master   201d   v1.20.0+df9c838
master2       Ready      master   201d   v1.20.0+df9c838
worker0       Ready      worker   201d   v1.20.0+df9c838
worker1       NotReady   worker   11d    v1.20.0+df9c838
worker2       Ready      worker   201d   v1.20.0+df9c838
- Describe any that are
Status=NotReady and search for
Conditions:
$ oc describe node worker1
Name:               worker1
[...]
Conditions:
  Type           Status  LastHeartbeatTime               LastTransitionTime              Reason            Message
  ----           ------  -----------------               ------------------              ------            -------
  MemoryPressure Unknown Fri, 03 Dec 2021 18:07:43 -0600 Tue, 11 Jan 2022 16:12:38 -0600 NodeStatusUnknown Kubelet stopped posting node status.
  DiskPressure   Unknown Fri, 03 Dec 2021 18:07:43 -0600 Tue, 11 Jan 2022 16:12:38 -0600 NodeStatusUnknown Kubelet stopped posting node status.
  PIDPressure    Unknown Fri, 03 Dec 2021 18:07:43 -0600 Tue, 11 Jan 2022 16:12:38 -0600 NodeStatusUnknown Kubelet stopped posting node status.
  Ready          Unknown Fri, 03 Dec 2021 18:07:43 -0600 Tue, 11 Jan 2022 16:12:38 -0600 NodeStatusUnknown Kubelet stopped posting node status.
If no issues are obvious, debug the node in
more depth.
- Review node resource usage:
$ oc adm top nodes
NAME      CPU(cores)   CPU%   MEMORY(bytes)   MEMORY%
master0   1990m        26%    13070Mi         89%
master1   1614m        21%    10982Mi         75%
master2   1016m        13%    10138Mi         69%
worker0   4986m        32%    17360Mi         57%
worker1   4986m        32%    17360Mi         57%
worker2   2634m        16%    16352Mi         54%
- Describe any that have high usage of CPU and/or memory:
$ oc describe node master0
Name:               master0
[...]
Allocatable:
  cpu:                7500m
  ephemeral-storage:  95069439022
  memory:             14871872Ki
  pods:               250
[...]
Non-terminated Pods:                      (32 in total)
  Namespace                  Name                    CPU Requests  CPU Limits  Memory Requests  Memory Limits  AGE
  ---------                  ----                    ------------  ----------  ---------------  -------------  ---
  openshift-kube-apiserver   kube-apiserver-master0  290m (3%)     0 (0%)      1224Mi (8%)      0 (0%)         7d16h
[...]
Allocated resources:
  (Total limits may be over 100 percent, i.e., overcommitted.)
  Resource           Requests      Limits
  --------           --------      ------
  cpu                1595m (21%)   0 (0%)
  memory             5241Mi (36%)  0 (0%)
If no CPU or memory culprits are obvious, debug the node in
more depth.
- Review critical and warning alerts:
- Critical:
curl -k -H "Authorization: Bearer $(oc -n openshift-monitoring sa get-token prometheus-k8s)” https://$(oc -n openshift-monitoring get route alertmanager-main -o jsonpath='{.spec.host}')/api/v1/alerts?filter=severity=critical
- Warning:
curl -k -H "Authorization: Bearer $(oc -n openshift-monitoring sa get-token prometheus-k8s)" https://$(oc -n openshift-monitoring get route alertmanager-main -o jsonpath='{.spec.host}')/api/v1/alerts?filter=severity=warning
- Review recent warning and error events:
oc get events --sort-by='.lastTimestamp' --all-namespaces --field-selector type=Warning | tail -10
- Review top pod resource usage by CPU:
$ oc adm top pod --all-namespaces --sort-by=cpu | head
NAMESPACE                              NAME                                         CPU(cores)   MEMORY(bytes)
openshift-kube-apiserver               kube-apiserver-master0                       940m         6526Mi
openshift-operators                    service-binding-operator-c4896b966-js9t9     547m         662Mi
openshift-etcd                         etcd-master1                                 480m         2185Mi
openshift-kube-apiserver               kube-apiserver-master1                       304m         4751Mi
openshift-kube-apiserver               kube-apiserver-master2                       284m         4787Mi
openshift-operator-lifecycle-manager   olm-operator-64fbc79dbc-47mvq                261m         1507Mi
openshift-monitoring                   prometheus-k8s-1                             243m         2355Mi
openshift-etcd                         etcd-master0                                 243m         1902Mi
openshift-monitoring                   prometheus-k8s-0                             237m         2249Mi
- Review top pod resource usage by memory:
$ oc adm top pod --all-namespaces --sort-by=memory | head
NAMESPACE                 NAME                    CPU(cores)   MEMORY(bytes)
openshift-kube-apiserver  kube-apiserver-master0  1220m        6396Mi
openshift-kube-apiserver  kube-apiserver-master2  351m         4828Mi
openshift-kube-apiserver  kube-apiserver-master1  276m         4763Mi
rook-ceph                 csi-rbdplugin-htblh     1m           2464Mi
openshift-monitoring      prometheus-k8s-1        359m         2355Mi
openshift-monitoring      prometheus-k8s-0        373m         2265Mi
openshift-etcd            etcd-master1            331m         2195Mi
openshift-etcd            etcd-master0            119m         1943Mi
openshift-etcd            etcd-master2            252m         1759Mi
- Get the status of cluster operators:
$ oc get clusteroperators
NAME        VERSION   AVAILABLE   PROGRESSING   DEGRADED   SINCE
dns         4.7.13    True        False         True       2d19h
- Describe any that are
Degraded=True:
$ oc describe clusteroperators dns
Name:         dns
[...]
Status:
  Conditions:
    Last Transition Time:  2022-02-09T06:40:54Z
    Message:               DNS default is degraded
    Reason:                DNSDegraded
    Status:                True
    Type:                  Degraded
- Check for overcommit issues
on worker nodes:
oc get nodesoc debug node/$NODE -tchroot /host journalctl --grep="Killed"- Overcommit ratios may
be tuned. Alternatively, disable overcommit by setting all pods'
request=limit.
- Troubleshoot
Networking
- For a pod status of
pending, review
oc describe pod $POD
- The horizontal pod autoscaler initially has a value of
<unknown> and might take ~5 minutes to update. A
persistent value of <unknown> might indicate that the
deployment does not define resource requests for the metric and the
autoscaler will not activate.
- Investigate pod errors
due to permissions:
oc get pod/$POD -o yaml | oc adm policy scc-subject-review -f -
Previous Section (OpenShift Login Recipe) |
Next Section (OpenShift Use Image Registry Recipe) |
Back to Table of Contents