You use a wizard to auto-generate the monitor model from the process. You will then have two monitor models, the business measures model from the process in WebSphere® Business Modeler (the high-level model) and the monitor model generated from the process in WebSphere Integration Developer (the low-level model). The high-level model contains the monitor elements that need to be implemented in the final monitor model. The low-level model contains the monitoring context instance creation, termination, and correlation information based on the events generated from WebSphere Process Server.
You have three options when using these two monitor models:
- Keep both models intact and create outbound events from the low-level model to feed metric information to the high-level model. This options supports product synchronization for both models to easily handle changes that are made to the process or changes that are made to the business measures model. However, this option also requires extra work to build the event definitions and the monitor elements that support it.
- Keep the high-level model intact and add inbound events to the high-level model using in WebSphere Integration Developer, and then copying the generated artifacts into the monitoring context for the high-level model. This option is easy and can be useful when the low-level application is stable, but the business measure requirements are churning. However, this option does not support synchronization with the process application.
- Keep the low-level model intact and then copying business measures information into the low-level model from the high-level model. This option is the easiest and can be useful when the low-level application is churning, but the business measure requirements are stable. However, this option does not support synchronization with business measures from WebSphere Business Modeler.
For this tutorial, you will use option three. Therefore, you need to merge the two models into one monitor model. Then you will add the implementation details for the KPIs and other monitor elements.
- Generate the monitor model in WebSphere Integration Developer from
the BPEL process by completing the following steps:
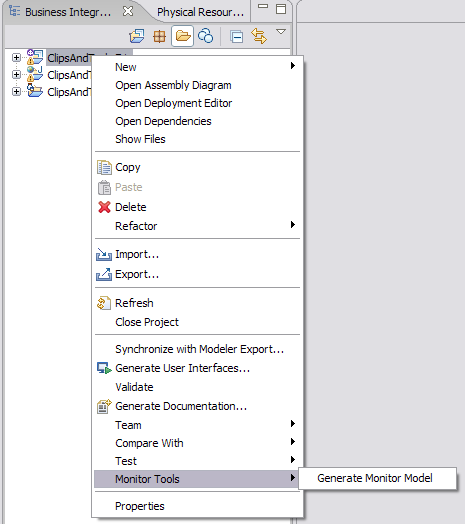
- In the Business Integration view, right-click ClipsAndTacksF1 and
select .
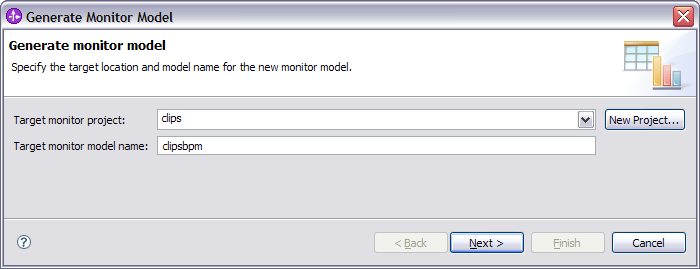
- For the Target monitor project, enter clips.
- Click New Project, then click Finish.
- For the Target monitor model name, enter clipsbpm and
click Next.
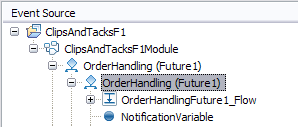
- In the Generate Monitor Model dialog
box, in the Choose what to monitor section, navigate
the Event Source field to and select Order Handling (Future
1) as follows:
- On the Monitoring Templates tab, click Select
All. The generated monitor model will contain monitoring elements
that track all of the listed process characteristics. One of these characteristics
is the Average Elapsed Duration, which will satisfy the requirement in the
business measures model to track the average processing time.

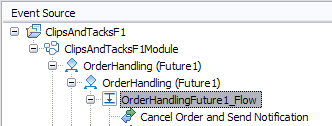
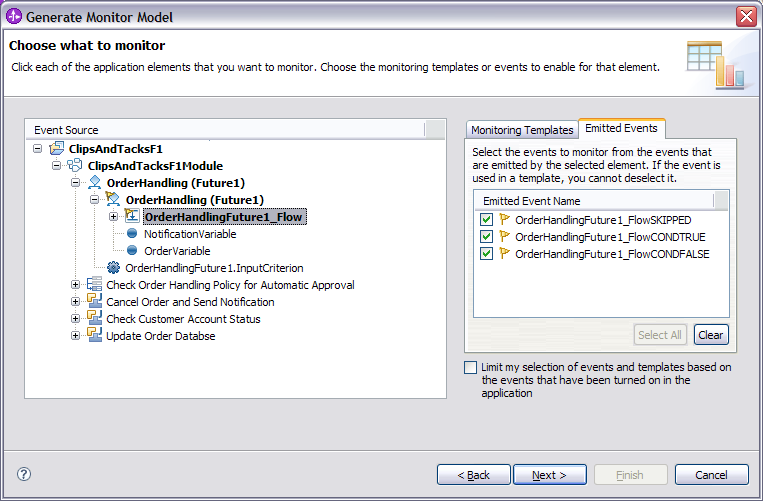
- In Event Source, select :
- On the Emitted Events tab,
click Select All. The generated monitor model will
subscribe to these events. The events are for link traversals. These BPEL
links represent the decision elements from WebSphere Business Modeler. The events
indicate whether a link was skipped or if it was traversed because the condition
was true or false. Note the event name OrderHandlingFuture1_FlowCONDTRUE.
This will be used heavily in the monitor model.
- In the business measures model, it was specified to track the
processing time for each task. To implement that, click the Monitoring
template for elapsed duration for each activity. To do this, select Cancel
Order and Send Notification. Then on the Monitoring
Templates tab, select Average Elapsed Duration – Measure.
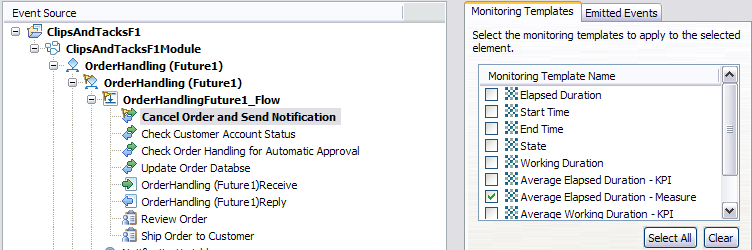
- Repeat step 1.h for the remaining three invoke activities and the two human tasks. Do not repeat step 1.h for the receive element, Order Handling (Future 1)Receive. Click Next.
- In the Business Integration view, right-click ClipsAndTacksF1 and
select .
- Simplify the monitor model so that there is only one monitoring
context. A monitoring context represents the entity or thing that is to be
monitored. Additionally, simplify the monitor model by creating event groups
to organize the events and provide structure in the monitor model:
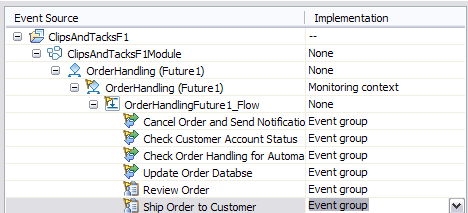
- For each of the invoke activities and the human tasks, change
the implementation to Event group by clicking in the
Implementation column and selecting Event Group from
the drop-down list.
- Click Next. You can preview the model here.
- Click Finish. When prompted, click yes to switch to the Business Monitoring perspective. When prompted, do not launch Getting Started. The monitor model opens in the monitor model editor.
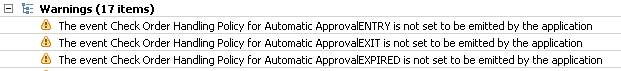
- Check the Problems view. If you didn’t
emit events that the monitor model requires, then the Problems view
will show warnings to indicate that the events are missing. If you see these
messages, update the monitor event settings in the module and then synchronize
the model with the application (in the project tree, right-click the model
and select Synchronize with Application).
- For each of the invoke activities and the human tasks, change
the implementation to Event group by clicking in the
Implementation column and selecting Event Group from
the drop-down list.
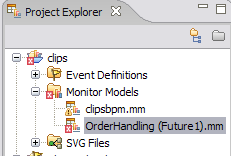
- Import the business measures model from WebSphere Business Modeler. Many errors
will result from the following actions, but these will be fixed as you progress
through the steps. To import the business measures model, complete the following
steps:
- In the project tree, right-click the clips project and select . Then click Next.
- Browse to the location that contains the business measures model
(OrderHandling (Future1).mm) from WebSphere Business Modeler. Then select
the two .svg files and the monitor model:
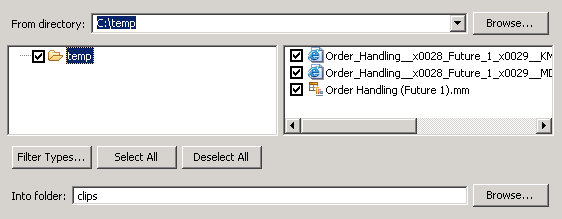
- Ensure that the Into folder is clips and then click Finish. There will be many errors in the Problems view because the metrics for the business measures model have not been implemented yet.
- Merge these two monitor models together. There are several options.
You could use the menu options Combine Monitor Models or .
Because the names of the monitoring contexts, KPI contexts, and cubes are
different in the two models, using the merge tools will result in a monitor
model that is a union of the two monitoring contexts, two KPI contexts, and
two cubes. The merge options work better if both models start from a common
base so that these containers have the same name. In our example, it is easier
to copy the monitor elements functions from one model to the other.
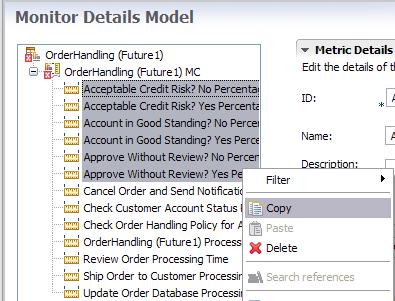
- Start Copying elements from the Order Handling (Future1) to
clipsbpm. Click the Monitor Details Model tab for Order
Handling (Future1). Select the six percentage metrics (Acceptable Credit Risk?
No Percentage, Acceptable Credit Risk? Yes Percentage, Account in Good Standing?
No Percentage, Account in Good Standing? Yes Percentage, Approve Without Review?
No Percentage, and Approve Without Review? Yes Percentage), right-click, and
select Copy. Note: There are several additional metrics in the details model for Order Handling. These are for processing time, but you will not need them because they were created automatically in clipsbpm when you selected the duration monitoring templates in the generation wizard.
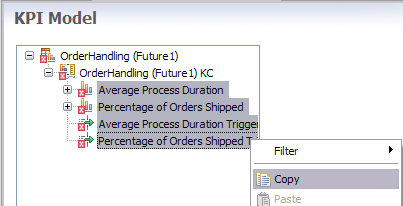
- Click the KPI Model tab for Order Handling
(Future1). Select all of the elements: the two KPIs and the two triggers.
Right-click and select Copy.
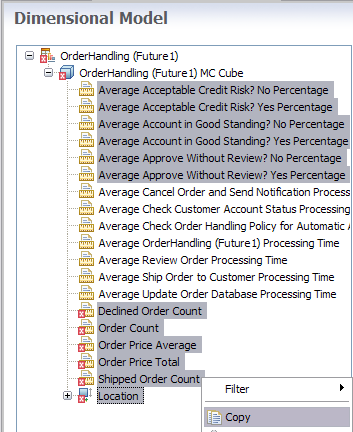
- Click the Dimensional Model tab for Order
Handling (Future1). Select all of the elements, except for the seven measures
with names that end with _Processing_Time (these measures are already in the
clipsbpm model). Right-click and select Copy.
- Start Copying elements from the Order Handling (Future1) to
clipsbpm. Click the Monitor Details Model tab for Order
Handling (Future1). Select the six percentage metrics (Acceptable Credit Risk?
No Percentage, Acceptable Credit Risk? Yes Percentage, Account in Good Standing?
No Percentage, Account in Good Standing? Yes Percentage, Approve Without Review?
No Percentage, and Approve Without Review? Yes Percentage), right-click, and
select Copy.
- For the seven processing time measures that you did not copy, you
will need to copy the tracking keys from Order Handling (Future1) to clipsbpm. WebSphere Business
Modeler needs the tracking keys when you export WebSphere Business Monitor data back
to WebSphere Business
Modeler.
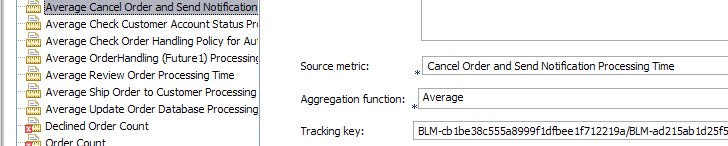
- In the dimensional model of Order Handling (Future1), click
the measure Average Cancel Order and Send Notification Processing
Time. You will see the tracking key in the editor as in the following
screen capture.
- In the dimensional model of Order Handling (Future1), click
the measure Average Cancel Order and Send Notification Processing
Time. You will see the tracking key in the editor as in the following
screen capture.
The rest of the work will be done in the clipsbpm model. There are still many errors. These will be corrected as you specify more implementation details.