Now you will complete the expressions for the six decision percentage metrics in the monitor details model. There are three decisions in the process model, so there is a yes metric and a no metric in the monitor model for the result of each decision. There will be a measure in the dimensional model that averages each metric, so the measure will show the percentage of the time that the branch was taken.
If a decision has not been traversed, then you do not want to include it in the averaging calculation. For example, the Approve Without Review? task in the process model is the only decision point that is always traversed. Account in Good Standing? and the Acceptable Credit Risk? tasks are only traversed under specific conditions while the order is being handled.
If the value of a metric is null, then the averaging functions will not include that metric’s value in the calculation. Therefore, you will set the default value to null for each metric as the starting condition. Its value will only be set if the decision point is reached. If it isn’t reached, it will remain null and therefore be excluded from the averaging calculation.
You will also create a trigger for each decision that determines when the yes branch is taken, sets the value of the yes metric to 100, and also sets the value of the no metric to 0. Then you will create a trigger for each decision that determines when the no branch is taken, sets the value of the no metric to 100, and also sets the value of the yes metric to 0. Therefore, when the measure averages each metric for the instances, the values will be null, 0 or 100, and the average will represent the percentage of the time that the branch was taken.
From the process model, only the Approve Without Review? task is guaranteed to always be set to a non-null value at the completion of the process. Of the other two, at least one task will be set to non-null and possibly both, depending on the path the customer order takes through the process.
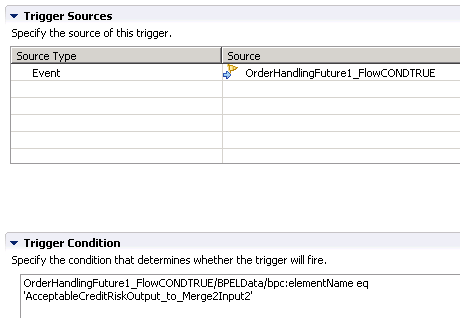
In the following expressions, the WebSphere® Integration Developer BPEL editor contains the names of the links (for example, “AcceptableCreditRiskOutput_to_Merge2Input2”) for the process.
- Create triggers to indicate flow on each of the decision links:
- To fire this trigger when the link from Acceptable Credit Risk
to the Merge is traversed, in the Trigger Condition field,
enter the following text:
OrderHandlingFuture1_FlowCONDTRUE/BPELData/bpc:elementName eq 'AcceptableCreditRiskOutput_to_Merge2Input2'
Note: Pay close attention to the text in the trigger condition. It must match exactly. To ensure that the text matches exactly, copy it from this document.Save your work.
- To fire this trigger when the link from Acceptable Credit Risk
to the Merge is traversed, in the Trigger Condition field,
enter the following text:
- Set flow metric values to denote that the decision was skipped
(value of null) or that the flow path was taken (value of 100) or not taken
(value of 0).
- In the Metric Value Expressions table
click Add. For the trigger, select Acceptable
Credit Risk No Trigger. For the expression, specify 100.
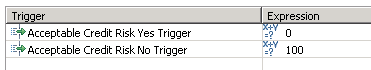
- In the Metric Value Expressions table
click Add. For the trigger, select Acceptable
Credit Risk No Trigger. For the expression, specify 100.
- Alerts are initiated by situation events. Specify the trigger conditions
that will generate situation events for the Alerts.
- For Trigger condition, enter the following
expression:
Average_Process_Duration ge dayTimeDuration('P3DT1H')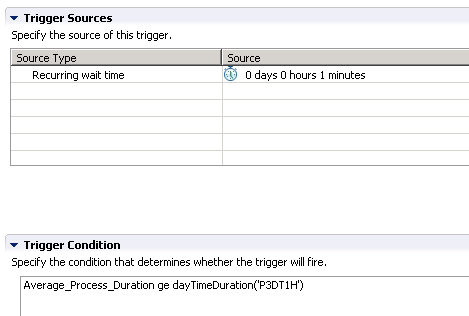
The trigger condition checks whether the Average Process Duration is greater than 3 days and 1 hour.
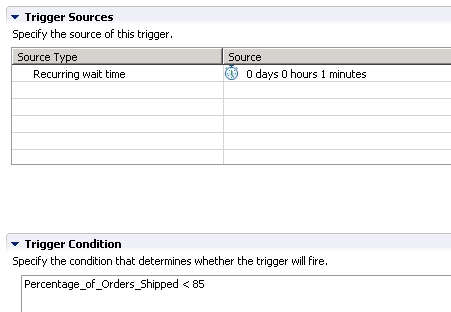
- Repeat the previous steps to update Percentage of
Orders Shipped Trigger 1. The Percentage of Orders Shipped Trigger
1 trigger will be used to emit the situation event indicating that the percentage
of shipped orders is too low. For the trigger condition, enter the following
expression:
Percentage_of_Orders_Shipped < 85
- For Trigger condition, enter the following
expression:
- The Average Process Duration KPI will now be implemented.
- Set the Aggregation function to Average from
the drop-down list.
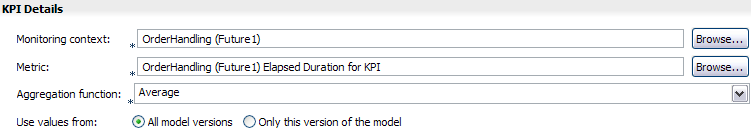
- Set the Aggregation function to Average from
the drop-down list.
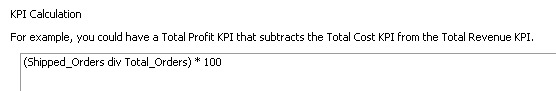
- In the KPI model, implement the KPI Percentage of Orders
Shipped. To calculate the percentage of orders that are shipped,
you will create a KPI for the number of shipped orders, and you will create
another KPI for the total number of orders. Then you can determine the percentage
by dividing the shipped orders by the total orders:
- In Trigger Sources, click Add and then
select Other source type. Navigate to and click OK.
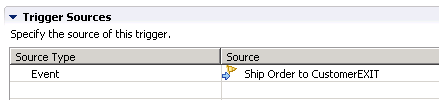
- In Trigger Sources, click Add and then
select Other source type. Navigate to and click OK.
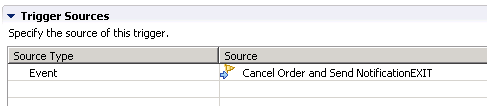
- In Trigger Sources, click Add and then
select Other source type. Navigate to and click OK.
- Create a new metric to contain the status of the Order.
- Again, in Metric Value Expressions, click Add.
In the Trigger cell, select Shipped Order
Trigger for the trigger. In the Expression cell,
enter 'Shipped' with the quotation marks.
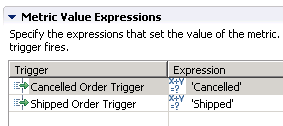
- Again, in Metric Value Expressions, click Add.
In the Trigger cell, select Shipped Order
Trigger for the trigger. In the Expression cell,
enter 'Shipped' with the quotation marks.
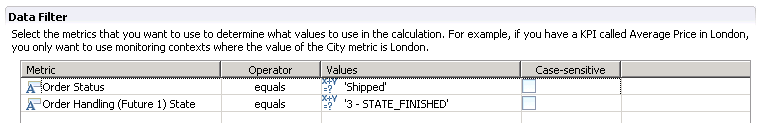
- Create a new KPI to count the number of shipped orders. You will
use the Instance ID metric to count all incoming instances and then filtering
the incoming instances by order status so only shipped orders are counted.
You will also filter the instances by the process state so that only completed
process instances are counted. In the KPI model, create a new KPI called
Shipped Orders:
- Again in the Data Filter, click Add and
then browse to . Then
click OK. In the values cell, enter '3 - STATE_FINISHED' with
the quotation marks.
- Again in the Data Filter, click Add and
then browse to . Then
click OK. In the values cell, enter '3 - STATE_FINISHED' with
the quotation marks.
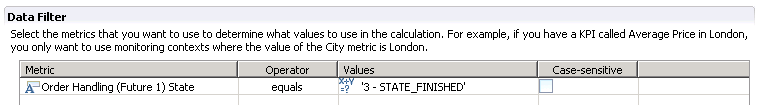
- Create a KPI to count the total number of orders. You will use
the Instance ID metric to count all incoming instances. You will also filter
the instances by the process state so that only completed process instances
are counted. In the KPI model, create a new KPI called Total Orders:
- For the Data Filter, click Add and then
browse to . Then click OK.
In the values cell, enter '3 - STATE_FINISHED' with the quotation
marks.
- For the Data Filter, click Add and then
browse to . Then click OK.
In the values cell, enter '3 - STATE_FINISHED' with the quotation
marks.
- Now you will complete the Percentage of Orders Shipped KPI:
- Save your work.
- Save your work.
- In the next procedure, you will create the ShippedPercentage.cbe
event definition. This event is used to initiate an alert when there is a
problem with the shipped orders percentage.
- In the project tree, right-click Event Definitions and then select . For file name, enter ShippedPercentage.cbe, and then click Finish. The event definition editor opens.
- Double-click the hierarchical icon next to the label Parent
- On the Select Event Definition dialog box, double-click ActionServicesEvent.
ActionServicesEvent is now shown as the parent of ShippedPercentage.
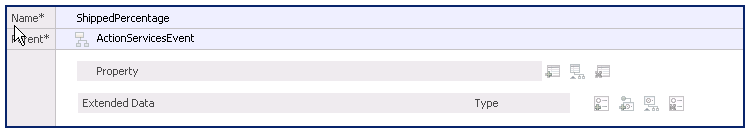
- Save your work.
- Use this event definition to create the Shipped Percentage Event
outbound event definition in the monitor model:
- In the clipsbpm model, click the KPI Model tab.
- In the KPI Model navigator, right-click and select .
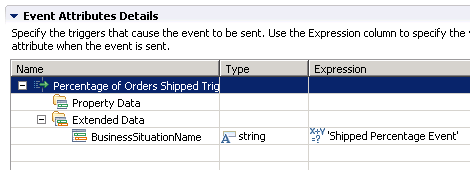
- For the Name, enter Shipped Percentage Event.
- Select the check box for 'Configure this event to generate an alert in the dashboards'.
- For the Trigger, browse to and click OK.
- Click OK.
- In Event Type Details, for the extension name, browse to and then click OK.
- In Event Attributes Details, navigate to BusinessSituationName.
The value of the situation name is set to 'Shipped Percentage Event'.
- Save your work.
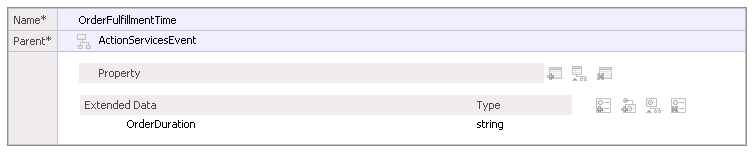
- Create the OrderFulfillmentTime.cbe outbound event for the order
processing time situation:
- Double-click the hierarchical icon
 next to the label Parent.
On the Select Event Definition dialog box, double-click ActionServicesEvent.
ActionServicesEvent is now the parent of OrderFulfillmentTime.
next to the label Parent.
On the Select Event Definition dialog box, double-click ActionServicesEvent.
ActionServicesEvent is now the parent of OrderFulfillmentTime. - In the Extended Data section, click the Add Extended
Data icon
 .
. - Change the name of the extended data element to OrderDuration and
change the type to string.
- Double-click the hierarchical icon
- Create the Order Fulfillment Event outbound event:
- Set the expression for OrderDuration to xs:string(Average_Process_Duration).
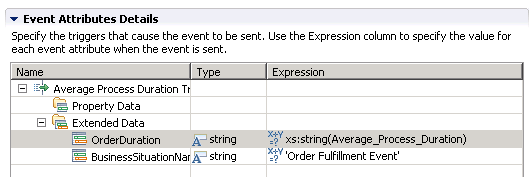
Note: Notice that in both of the events (CBEs) created above that the Extended Data element BusinessSituationName was not created. This is because it is inherited from the parent event ActionServicesEvent. Actually, the ShippedPercentage.cbe did not even need to be created. The outbound event Shipped Percentage Event in the monitor model could have been created with the default Extension name of . Event definitions (CBEs) for situation events only need to be created if Extended Data other than BusinessSituationName is needed. This is frequently the case however as additional process or business data is typically needed in the Alert and thus must be carried in the event. - Set the expression for OrderDuration to xs:string(Average_Process_Duration).
- Create the dimension Order Status so that
orders can be aggregated by their status.
- Name the dimensional level Order Status. Then
click Browse next to Source Metric and navigate to . Then click OK.
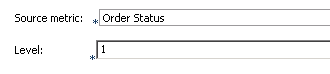
- Name the dimensional level Order Status. Then
click Browse next to Source Metric and navigate to . Then click OK.
- There is a dimension called Location in the dimensional model,
but there are errors associated with it. This dimension came from the business
measures model, and it should contain two levels: the country and the city.
Create metrics for country and city and then update the Location dimension
to refer to the metrics.
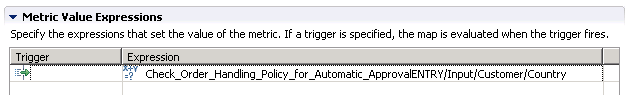
- In Metric value expressions, click Add.
In the Expression cell, use content assist (Ctrl +
Space bar) to navigate to the following inbound event field for country:
Check_Order_Handling_Policy_for_Automatic_ApprovalENTRY/Input/Customer/Country
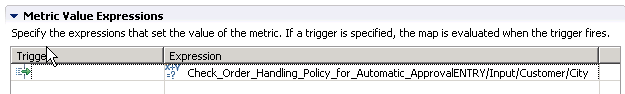
- Create a City metric, following the previous steps but selecting
the following inbound event field for city:
Check_Order_Handling_Policy_for_Automatic_ApprovalENTRY/Input/Customer/City
- In Metric value expressions, click Add.
In the Expression cell, use content assist (Ctrl +
Space bar) to navigate to the following inbound event field for country:
- In the Dimensional model, update the Location dimension with the
two metrics:
- Click OK. In the Dimensional Model navigator,
Location is listed with two sublevels:
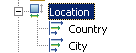
- Click OK. In the Dimensional Model navigator,
Location is listed with two sublevels:
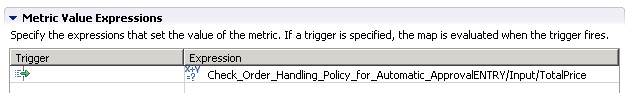
- In the Dimensional model, update the Order Price Average measure.
You will create a price metric to use as a source for this measure.
- In Metric value expressions, click Add.
In the Expression cell, navigate to the following inbound event field for
total price:
Check_Order_Handling_Policy_for_Automatic_ApprovalENTRY/Input/TotalPrice
- In Metric value expressions, click Add.
In the Expression cell, navigate to the following inbound event field for
total price:
- In the dimensional model, update the Order Price Average measure
with the new metric:
- For the source metric, browse to and
click OK.
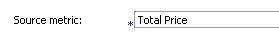
- For the source metric, browse to and
click OK.
- In the dimensional model, update the Order Price Total measure
with the new metric:
- For source metric, browse to and
click OK.
- For source metric, browse to and
click OK.