In this lesson, you will create a business dashboard to monitor the Order Handling process using Business Space powered by WebSphere®.
- If not already logged in, log in to Business Space as userID admin.
- Add a page named C & T Instances to the previously created ClipsAndTacks business space.
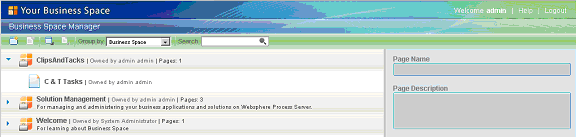
- Navigate to the Business Space Manager.
- Select the ClipsAndTacks business space.
- Click the Create new page icon
 , name the page C & T Instances, and click OK. The ClipsAndTacks business space is updated with the C & T Instances page.
- Add an instance widget to the C & T Instances page:
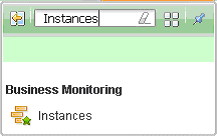
- Click the C & T Instances link to open the page. Click Add Widgets, which is in the center of the page, and type Instances. Drag the Instances item to the page.You could also click Add Widgets from the right corner of the page.
- Click the down arrow icon
 on the right side of the Instances toolbar and select Configure.
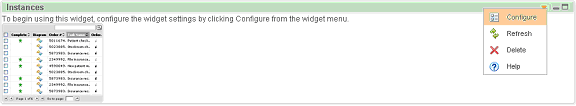
- In Select the monitoring context to personalize, expand OrderHandling (Across all Versions) and select OrderHandling. In Select the columns to display, select City, Country, Order Status, and Price per order. Use the right arrow
 to move to these items into the Selected column. Then click Set as default.
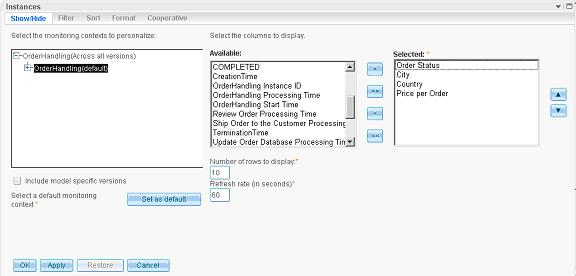
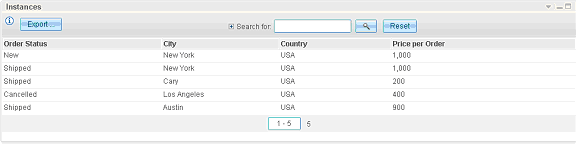
- Click OK. The resulting Instances view is shown in the following screen capture.
- Click the C & T Instances link to open the page. Click Add Widgets, which is in the center of the page, and type Instances. Drag the Instances item to the page.
- Create a new page, add the KPI and Alerts® widgets, and then configure the page:
- Click the New Page tab.
- Enter C & T KPI and Alerts as the page name, and then click OK.
- Click Add Widgets and enter KPIs. Drag the KPIs item to the page.
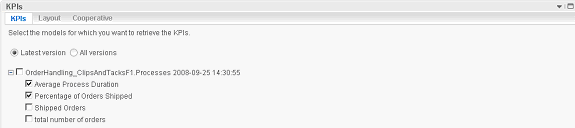
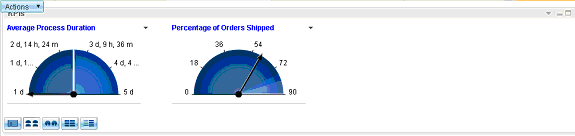
- Select Configure. Select the Average Process Duration and Percentage of Orders Shipped KPIs that you want to display on the widget.
- Click the Layout tab. Select Half Gauge as the display type. Click OK.
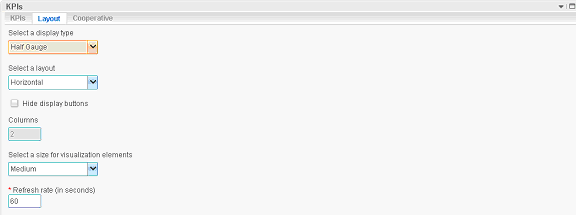
The KPI view opens.
- Add the Alerts widget to the C & T KPI and Alerts page:
- Click Add Widgets and enter Alerts. Drag the Alerts item to the page, underneath the KPIs widget.There are two alerts defined in the model: one for shipped percentage and one for order processing time. The latter alert is based on a processing time greater than three days, so it is difficult to test here, unless you use the KPI Manager widget to reduce the target. The former alert can be tested easily by ensuring the number of shipped orders is less than 85 percent of the number of total orders.Note: WebSphere Business Monitor may ship with a default BAM showcase model. The alert view may display alerts from this showcase model.
- Click the alert to see details.
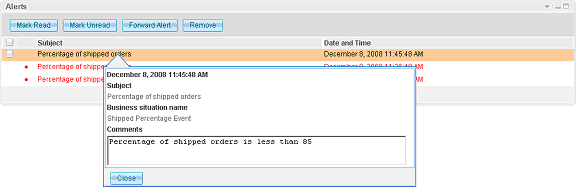
- Click Add Widgets and enter Alerts. Drag the Alerts item to the page, underneath the KPIs widget.
- Create a new page to add the Human Tasks widget and Dimensions view:
- Click the New Page tab .
- Enter C & T Human Tasks and Dimensions as the page name and click OK.
- Click Add Widgets and enter Human Tasks. Drag the Human Tasks item to the page.
- Select Configure.
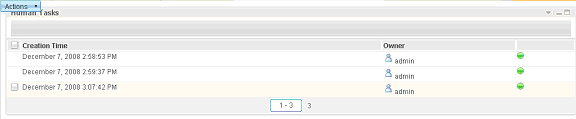
- Select Creation Time, Owner, and Status and use the right arrow to move them to the Selected column.
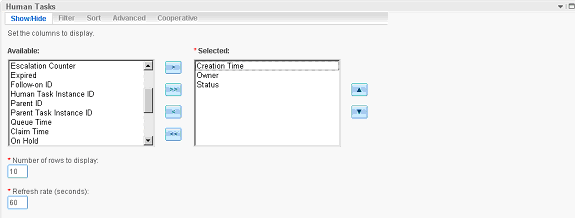
- Click OK. The Human Tasks view displays.
- Add the Dimension widget to C & T Human Tasks and Dimensions page:
- Click the Add Widgets and enter Dimensions. Drag the Dimensions item to the page, underneath the Human Tasks widget.
- Click Configure.
- In the Monitoring Model field, select Global HT MM (All Versions).
- Add Task Name Dimension to the Row dimensions box.
- Add Task Owner Dimension to the Column dimensions box.
- Add Measures Dimension to the Page dimensions box.
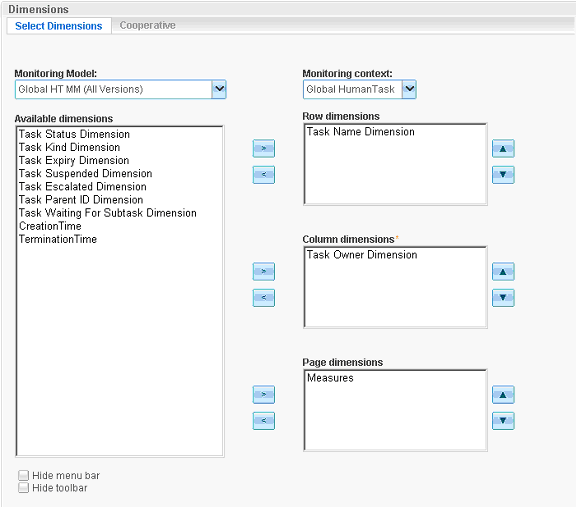
- Click OK. The Dimensions view displays the instances count based on the task name and task owner.
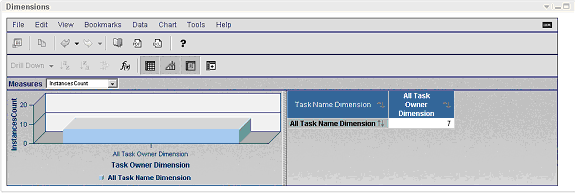
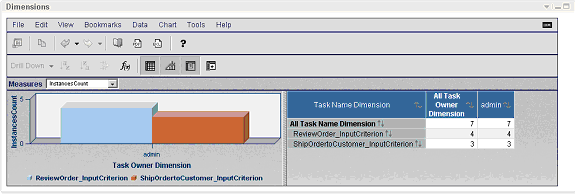
- You can double-click All Task Name Dimension and select All Task Owner Dimension to drill down for more detailed data.
- Add a dynamic KPI to the business space:
- Click the C & T KPI and Alerts link to open the page.
- Click Add Widgets and enter KPI Manager. Drag the KPI Manager item to the page, underneath the Alerts widget.
- For the model, select OrderHandling.
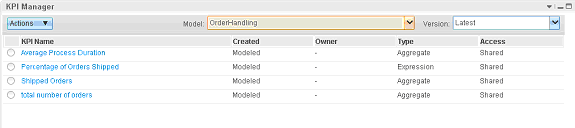
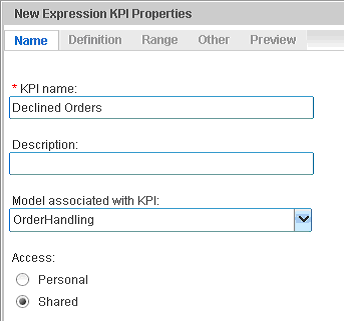
- Click Actions and select the New Expression KPI.
- For the name of the KPI, enter Declined Orders.
- For the model associated with the KPI, select OrderHandling.
- For the type of access, select Shared so that other users can see the new KPI.
- Create the expression for the new Declined Orders KPI:
- Select the Definition tab.
- Use the KPI drop-down list to select Total Number of Orders and click Insert.
- Use the Operator drop-down list to select the minus symbol (-) and click Insert.
- Use the KPI drop-own list again to select Shipped Orders and click Insert.
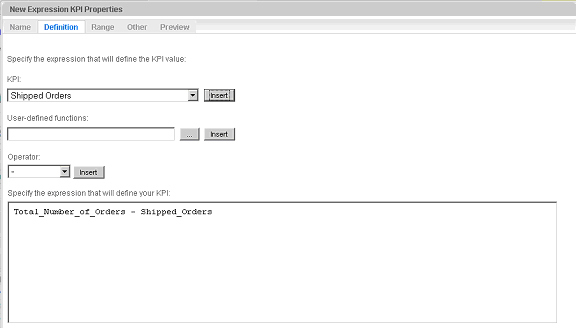
- Click Apply.
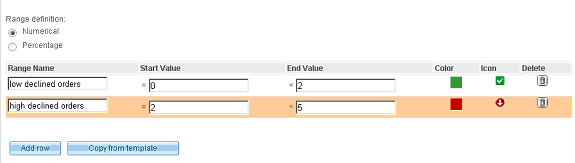
- Select the Range tab.
- For Range definition, select Numerical.
- Add two rows by clicking Add row and entering the following values:
- In the first row, enter low declined orders for the range name, 0 for the start value, 2 for the end value, green for the color, and the check mark in the green square for the icon.
- In the second row, enter high declined orders for the range name, 2 for the start value, 5 for the end value, red for the color, and the down arrow in the red circle for the icon.
- Click Configure on the KPIs widget.
- Expand OrderHandling and select Declined Orders and then click OK. The newly created KPI is added to the KPIs widget.