You can run the sample from the provided artifacts if you
did not build the sample from the tutorial.
- Import the provided project interchange file. There are
two options for completing this step, choose the method that best
suits you.
- Start WebSphere® Integration
Developer V6.2 and create a new workspace for this sample, for example C:\Documents
and Settings\Administrator\IBM\wid6.2\ClipsAndTacks. Do
not select Use this as the default and do not ask again because
it is easier to come back to this window if it is not selected. Click OK.
- If you accessed this documentation through the Samples
and Tutorials Gallery, return to the gallery now and use the button
to import the complete application, then continue on to step 2.
- If you accessed this document through a web browser,
follow the steps in Download and import samples
- Follow the steps described in Setting up the Lotus Forms Server API workspace.
- Follow the steps described in Identifying WebSphere Monitor Server on WebSphere Process Server ports
- Follow the steps in Creating a WebSphere Business Services Fabric project.
- Follow the steps described in Updating the web services endpoint URLs, and be sure to complete the governance
step at the end.
- Deploy the monitor model J2EE projects. Follow the steps
described in the Generating executable artifacts for the monitor model and deploying to the server. Note that
when generating the J2EE artifacts, you will have to overwrite existing
artifacts so be sure to select the checkbox.
- Follow the steps in Configuring WebSphere Business Monitor for business situation events.
- Follow the steps in Setting up access to the OrderHandling monitor model.
- Import the provided clipsandtacks.data file into Business
Space powered by WebSphere.
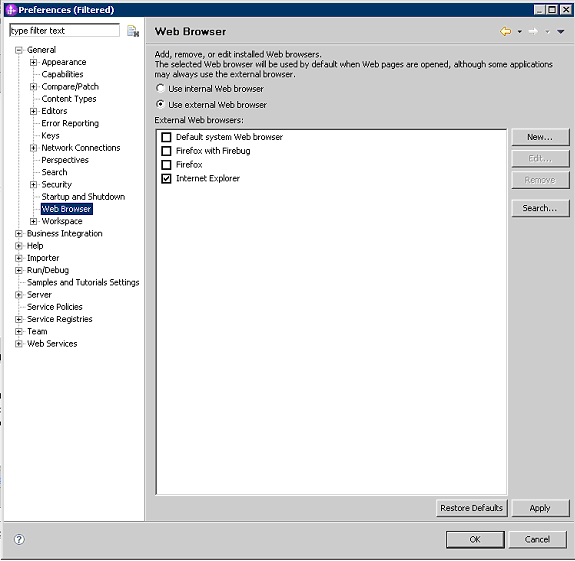
- In WebSphere Integration
Developer, click . The default browser might be Internal Web
Browser, but this one does not have all of the functions
that you require. Select Default system Web browser or
another listed browser other than the internal browser and select Use
external Web browser. Click OK.
- In WebSphere Integration
Developer, in the Servers view, right-click the WebSphere
Business Monitor Server V6.2 server and select . (If a Security page displays, select the option to
continue to the Web site or add this connection as an exception, depending
on the browser being used.)
- When prompted, enter admin for
the user ID and enter admin for the password
(or the administrator ID and password if you have changed it). A Business
Space Manager window opens.
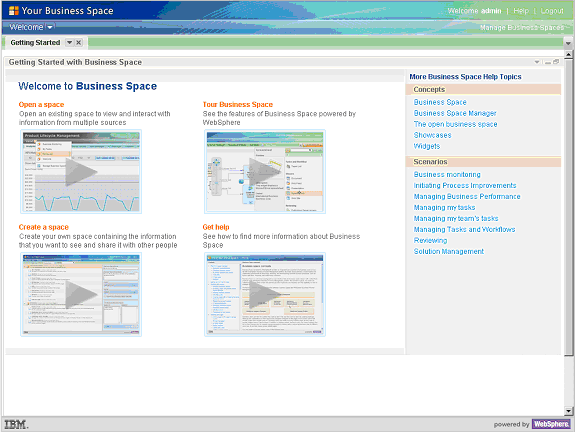
- Click Manage Business Spaces. The
new page contains two default business spaces: Solution
Management and Welcome (which has
a few sample pages).
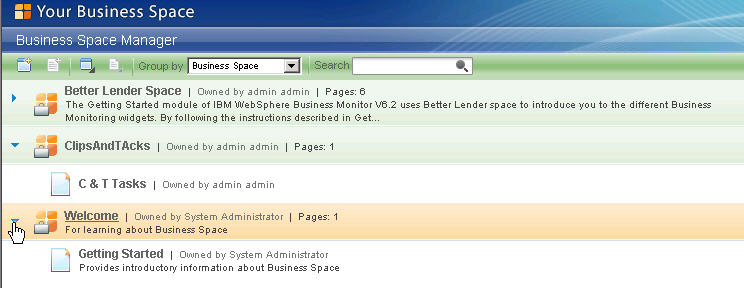
- Import the provided clipsandtacks.data file.
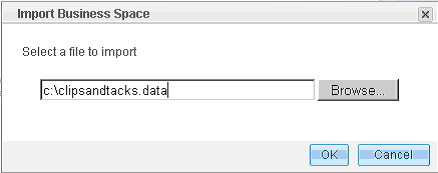
- Click the Import Business Space icon
 . Click Browse and
navigate to the directory where the clipsandtacks.data file is located.
. Click Browse and
navigate to the directory where the clipsandtacks.data file is located.
- Click OK.
- To run the sample, complete the following steps:
- Follow the steps described in Testing the initial shipping policies.
- Follow the steps described in Testing the Order Handling business process and
select the C & T Instances and Diagrams, C &
T KPI and Alerts and C & T Human Tasks
and Dimensions pages to monitor the deployed process.
- View the business dashboard.
- On the C & T Instances page you can see a record of each test
you ran.
- On the C & T KPI and Alerts page you can see gauges representing
the average process duration and the percentage of orders shipped,
as well as an alert for the percentage of orders shipped below the
threshold of 85%.
- On the C & T Human Tasks and Dimensions page you can see each
human task with its current status and in the dimensions widget a
graphical representation of the tasks that you can drill down to view
additional details.