Garbage Collection and Memory Visualizer (GCMV)
The IBM Garbage Collection and Memory Visualizer (GCMV) tool is used to analyze Java memory usage using the output of verbose garbage collection. It parses both IBM Java, OpenJ9 and HotSpot Java verbose garbage collection log files. For IBM Java and OpenJ9 in particular, it has an advanced engine which provides automated analysis and recommendations from the data.
Installation
See the download instructions.

Basic Usage
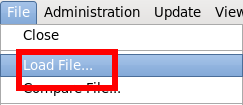
Click on File } Load File and and load the verbosegc file
GCMV parses and plots various log types including Verbose GC logs, javacore.txt verbosegc flight
recorder, -Xtgc output, and native memory logs (output from
ps, svmon and Perfmon).
Features and Benefits
GCMV uses a powerful statistical analysis engine which provides guidance on improvements in these areas:
- Memory Leak Detection
- Detect Java heap exhaustion and memory leaks
- Detect "native" (malloc) heap exhaustion and memory leaks
- Optimizing garbage collection performance
- Determine garbage collection overhead
- Detect long or frequent garbage collection cycles and causes
- Recommend settings to avoid long or frequent garbage collection cycles
- Recommend optimum garbage policy
- Fine tuning of Java heap size
- Determine peak and average memory usage
- Recommend Java heap settings
GCMV provides a flexible user interface, making it possible to carry out further analysis of the data and to "drill down" into the causes of trends or data points of interest.
The GCMV graphical interface provides the following capabilities:
- Raw log, tabulated data and graph views
- Ability to zoom and crop graphs
- Ability to select data points in line plots and view in raw data
- Customize the graph by adding/removing data and changing display units
- Compare output from multiple logs
- Save data to jpeg or .csv files for export to spreadsheets
- Templates allow configuration to be saved
- Support for compressed files and rolling logs
Analysis
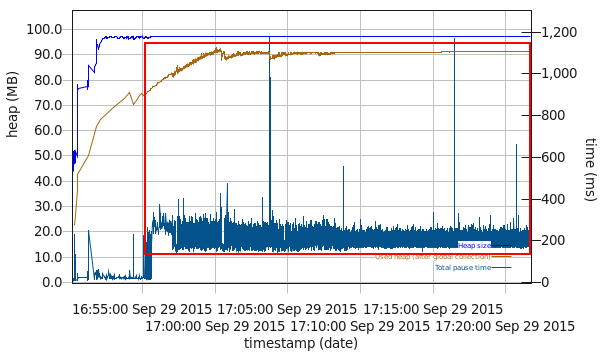
Primarily, you will review the line plot to observe garbage collection behavior, and click on the Report tab to review the proportion of time spent in garbage collection.
Observe in the following example that towards the end of the graph, the "Used heap (after global collection)" - the brown line - which is the amount of live Java heap after a full garbage collection finishes, has a pattern where it doesn't decrease much and it's near the heap size (blue line). This also correlates with a persistent increase in the "Total pause time" - the dark line. These are the classic signs of heap exhaustion.
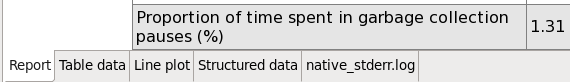
Proportion of time in garbage collection:
Cropping Data Analysis
In general, the proportion of time in garbage collection should be less than 10% and ideally less than 1%. It is important to analyze the proportion of time in GC for times of interest; however, zooming does not crop the data analysis. To do so, specify a minimum and maximum value for the X-axis and then click on the Report tab again to update the data analysis and review the proportion of time in GC:
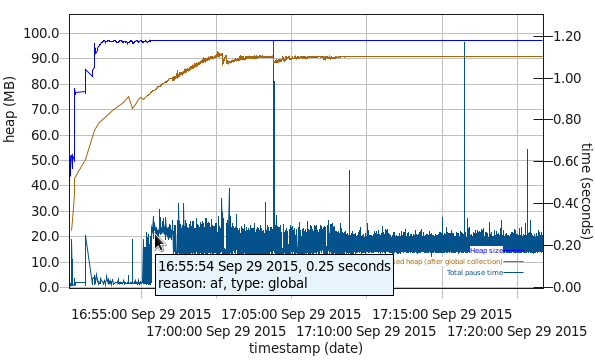
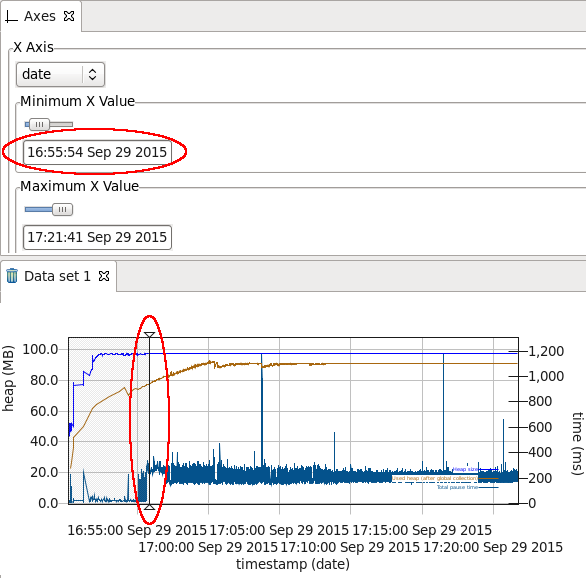
Hover your mouse over the approximate start and end points of the section of concern and note the times of those points (in terms of your selected X Axis type):
Enter each of the values in the minimum and maximum input boxes and press Enter on your keyboard in each one to apply the values. The tool will show vertical lines with triangles showing the area of the graph that you've focused on.
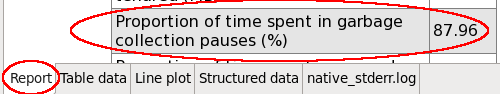
Click on the "Report" tab at the bottom and observe the proportion of time spent in garbage collection for just this period (in this example, 87% which is a problem).
Customizing the Views
Adding and removing line plots
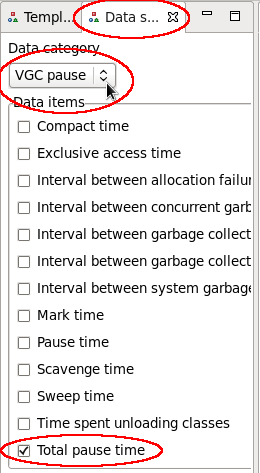
Check or uncheck line plots from the "Data Selector" tab. For example, it is often useful to select VGC Pause } Total pause time, and VGC Heap } Used heap (after global collection).
X-axis
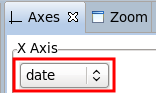
It is often useful to change the X-axis to date/time:
Zooming
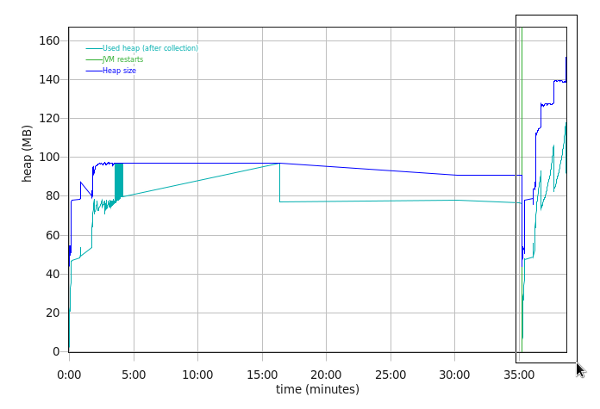
You may zoom into any part of the graph, or reset the zoom in the Zoom view. Note that zooming does not affect the report (see the cropping section above for how to do that):
Comparing Different Runs
First, load the baseline verbosegc as normal. Next, right click anywhere in the plot area and click 'Compare File...':
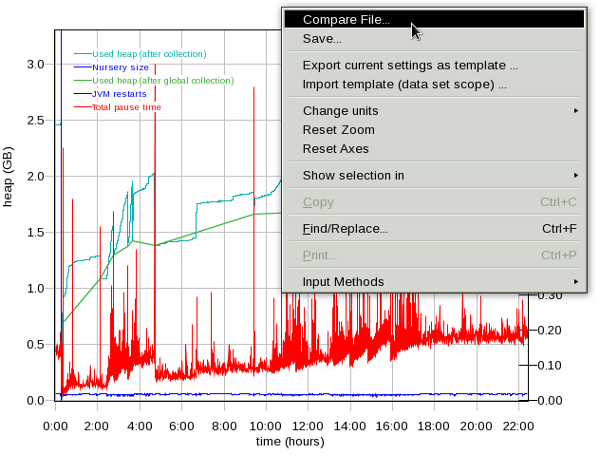
Next, ensure that the X-axis uses a relative format such as hours, instead of date. Otherwise, you'll just end up essentially combining the two verbosegc files with a date gap in between and so you won't be able to visualize any differences.
Finally, zoom in to the part where they overlap (i.e. one might be longer than another, so cut the extra off). Important note: GCMV's zoom feature is only a different visualization of the line plot -- it does not affect GCMV's report tab. That means that if something went wrong outside your zoom which you don't care about, zooming in to avoid that section will not disregard that errant data in the report tab (for things such as proportion of time spent in GC, largest allocation, etc.). To do this, you'll also want to change the Minimum and Maximum X values in the Axes view to approximately match your zoom. It is easiest to first change the X-axis, at which point GCMV will gray out the disregarded data. Then, you can zoom around the non-disregarded data using your cursor.
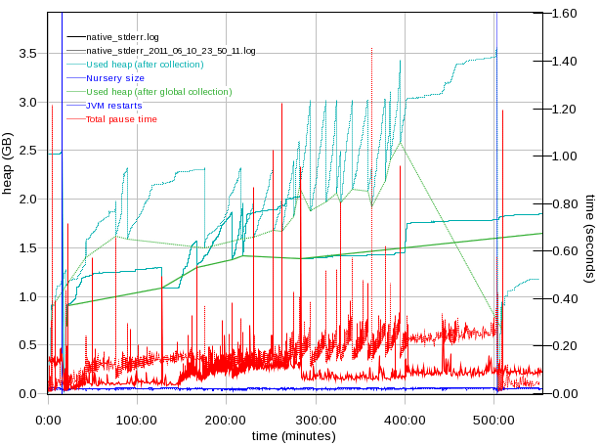
For each series, there will be a solid line for the baseline verbosegc and a dashed line of the same color for the compared verbosegc. When you click on the report tab, GCMV will create a column for each verbosegc for easier comparison:
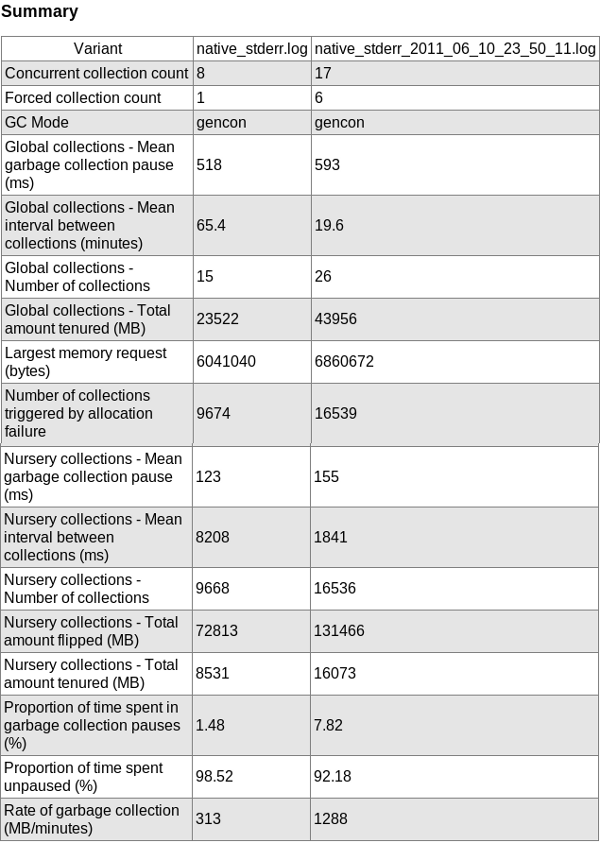
In this case, we can see that, for example, the proportion of time spent in GC went from 7.82% to 1.48% (the native_stderr.log was the newer one). Many of the other statistics got better. In this case, we can say that the tuning we did (increasing the nursery size) was very beneficial, all other things being equal.
Now one very important consideration is "all other things being equal." You have to be very careful comparing verbosegc. If, for example, a different amount or rate of work came into these independent runs (for example, a different test was run, or one day was a workday and another a weekend with less work, etc.), then it would be much more difficult to conclude anything. One obvious sign of this is that you're tuning something like the nursery, and the overall Java heap usage is magnitudes different. The point is: carefully control your experiment to hold all other variables constant (and verify using data such as request count, response times, etc.).
Headless Mode
Default report where $FILE is an absolute path to the
verbosegc file and $OUTPUDIR is an absolute path to the
output directory (no sub-directory will be made):
gcmv -consoleLog -nosplash -rc -display 1024x768 -application com.ibm.java.diagnostics.visualizer.headless.application -f "$FILE" -o "$OUTPUTDIR" -p "DEFAULT_TEMPLATES" -generateTableDataYou can create whatever line plot you want by loading the GCMV GUI,
loading a verbosegc, selecting the plots you're interested in, and then
Right Click } Export current settings as template... } Save as an
epf file
Then specify that epf file; for example:
gcmv -consoleLog -nosplash -rc -display 1024x768 -application com.ibm.java.diagnostics.visualizer.headless.application -f $(pwd)/verbosegc.log -o $(pwd)/gcmvreport/ -p gcmv_pauses_and_proportion.epfHere is an example epf file with total pause time and
proportion of time in GC plots. The key element has the key
TupleIDsToDisplayPropertiesImpl.
<?xml version="1.0" encoding="UTF-8" standalone="no"?>
<!DOCTYPE preferences SYSTEM "http://java.sun.com/dtd/preferences.dtd">
<preferences EXTERNAL_XML_VERSION="1.0">
  <root type="user">
    <map/>
    <node name="com">
      <map/>
      <node name="ibm">
        <map/>
        <node name="java">
          <map/>
          <node name="diagnostics">
            <map/>
            <node name="visualizer">
              <map/>
              <node name="prefs">
                <map/>
                <node name="coredisplayers">
                  <map>
                    <entry key="com.ibm.java.diagnostics.visualizer.display.DisplayerRegistry.v1" value="[com.ibm.java.diagnostics.visualizer.displayer.tabbed.TabbedDataDisplayer, com.ibm.java.diagnostics.visualizer.displayer.structured.StructuredDataDisplayer, com.ibm.java.diagnostics.visualizer.displayer.html.HTMLReportDisplayer, com.ibm.java.diagnostics.visualizer.displayer.plot.ZoomingPlotDataDisplayer]"/>
                    <entry key="LinePlotPreferenceHelperForceYAxisStartAtZero" value="true"/>
                    <entry key="HTMLReportPreferencesHelperSinglePlot" value="false"/>
                    <entry key="LinePlotPreferenceHelperImageFormat" value="0"/>
                    <entry key="LinePlotPreferenceHelperDrawDataLegend" value="true"/>
                    <entry key="LinePlotPreferenceHelperLineThickness" value="1"/>
                    <entry key="DisplayerPreferenceHelperEnableHovers" value="true"/>
                    <entry key="TabbedDataPreferenceHelperDisplayDateFirst" value="false"/>
                    <entry key="LinePlotPreferenceHelperPadPlots" value="true"/>
                    <entry key="DisplayerPreferenceHelperEnableFileViewer" value="true"/>
                    <entry key="LinePlotPreferenceHelperCursorFuzziness" value="10"/>
                    <entry key="LinePlotPreferenceHelperDrawLegend" value="true"/>
                    <entry key="TabbedDataPreferenceHelperLineThickness" value=","/>
                    <entry key="HTMLReportPreferencesHelperShowStats" value="true"/>
                    <entry key="LinePlotPreferenceHelperLegendPosition" value="0"/>
                  </map>
                </node>
                <node name="gc">
                  <map/>
                  <node name="defaultextensions">
                    <map>
                      <entry key="RecommendationPreferenceHelperHeapSizeJitterCountThreshold" value="15"/>
                      <entry key="RecommendationPreferenceHelperCriticallyHighOccupancyThreshold" value="80"/>
                      <entry key="RecommendationPreferenceHelperPauseThreshold" value="5000"/>
                      <entry key="UnitFormatPreferenceHelperDateFormat" value=""/>
                      <entry key="UnitFormatPreferenceHelperEnableDateFormat" value="UnitFormatPreferenceHelperEnableDateFormat"/>
                      <entry key="VGCParserPreferenceHelperInteropolateTimes" value="true"/>
                      <entry key="RecommendationPreferenceHelperHighOccupancyThreshold" value="70"/>
                      <entry key="RecommendationPreferenceHelperHeapSizeJitterThreshold" value="15"/>
                      <entry key="UnitFormatPreferencehelper.test" value="5"/>
                      <entry key="RecommendationPreferenceHelperSystemGCErrorThreshold" value="5"/>
                      <entry key="RecommendationPreferenceHelperCompactFractionThreshold" value="15"/>
                      <entry key="RecommendationPreferenceHelperLeakThreshold" value="10"/>
                      <entry key="RecommendationPreferenceHelperRequestThreshold" value="65536"/>
                      <entry key="VGCParserPreferenceHelperIgnoreSystemGCs" value="false"/>
                      <entry key="RecommendationPreferenceHelperExcessiveTenuringThreshold" value="1"/>
                      <entry key="RecommendationPreferenceHelperFinalizerThreshold" value="750"/>
                      <entry key="RecommendationPreferenceHelperFragmentationThreshold" value="15"/>
                      <entry key="RecommendationPreferenceHelperLowOccupancyThreshold" value="40"/>
                    </map>
                  </node>
                </node>
                <node name="impl">
                  <map>
                    <entry key="VGCLabels.flat.heap.size" value="25,101,163"/>
                    <entry key="OutputPropertiesImpl_axis.units_VGCAxes.moved" value="AxisUnits.MB"/>
                    <entry key="Colours3" value="50,175,50"/>
                    <entry key="UnstructuredIDsToDisplayPropertiesImpl" value="tuning.recommendation,native.tuning.recommendation"/>
                    <entry key="VGCLabels.unusable.heap" value="163,100,31"/>
                    <entry key="Colours8" value="30,144,255"/>
                    <entry key="OutputPropertiesImpl_axis.units_VGCAxes.time.from.start" value="AxisUnits.date"/>
                    <entry key="Colours0" value="0,175,175"/>
                    <entry key="com.ibm.java.diagnostics.visualizer.impl.extensions.PostProcessorRegistry.v1" value="[com.ibm.java.diagnostics.visualizer.postprocessor.vgc.analysis.RollingAveragesPostProcessor, com.ibm.java.diagnostics.visualizer.gc.solarissupport.postprocessor.DerivedOraclePostProcessor, com.ibm.java.diagnostics.visualizer.postprocessor.vgc.analysis.UnitSelectingPostProcessor, com.ibm.java.diagnostics.visualizer.postprocessor.vgc.analysis.DerivedVGCDataPostProcessor]"/>
                    <entry key="Colours5" value="255,192,203"/>
                    <entry key="TupleIDsToDisplayPropertiesImpl" value="VGCLabels.jvm.restarts,VGCLabels.proportion.gc,VGCLabels.pause.times.with.exclusive.access,VGCLabels.warning.count"/>
                    <entry key="OutputPropertiesImpl_axis.units_VGCAxes.percent" value="AxisUnits.percent.sign"/>
                    <entry key="OutputPropertiesImpl_axis.units_VGCAxes.time" value="AxisUnits.ms"/>
                    <entry key="com.ibm.java.diagnostics.visualizer.impl.extensions.ParserRegistry.v1" value="[com.ibm.java.diagnostics.visualizer.gc.solarissupport.parser.SunVGCParser, com.ibm.java.diagnostics.visualizer.gc.i5classic.parser.I5ClassicParser, com.ibm.java.diagnostics.visualizer.parser.javadump.JavaDumpParser, com.ibm.java.diagnostics.visualizer.memory.parser.PsNativeParser, com.ibm.java.diagnostics.visualizer.memory.parser.PerfMonParser, com.ibm.java.diagnostics.visualizer.gc.realtime.parser.RealTimeParserV2, com.ibm.java.diagnostics.visualizer.memory.parser.SVMonParser, com.ibm.java.diagnostics.visualizer.gc.i5V6r1.parser.I5V6r1Parser, com.ibm.java.diagnostics.visualizer.gc.realtime.parser.RealTimeParser, com.ibm.java.diagnostics.visualizer.parser.vgc.sovereign.SovereignVGCParser, com.ibm.java.diagnostics.visualizer.gc.v8support.parser.V8Parser, com.ibm.java.diagnostics.visualizer.gc.hp.parser.HPVGCParser, com.ibm.java.diagnostics.visualizer.gc.iseriessupport.parser.ISeriesVGCParser, com.ibm.java.diagnostics.visualizer.parser.vgc.j926.J926VGCParser, com.ibm.java.diagnostics.visualizer.gc.i5V5r4.parser.I5V5r4Parser, com.ibm.java.diagnostics.visualizer.parser.tgc.TGCParserImpl, com.ibm.java.diagnostics.visualizer.gc.solarissupport.parser.OracleG1VGCParser, com.ibm.java.diagnostics.visualizer.parser.vgc.j9.J950VGCParser]"/>
                    <entry key="VGCLabels.proportion.gc" value="255,38,0"/>
                    <entry key="OutputPropertiesImpl_axis.units_VGCAxes.copied" value="AxisUnits.MB"/>
                    <entry key="Colours2" value="255,0,0"/>
                    <entry key="Colours7" value="165,42,42"/>
                    <entry key="NumColours" value="10"/>
                    <entry key="Colours4" value="255,0,255"/>
                    <entry key="VGCLabels.live.normal.heap.after.gc" value="212,16,104"/>
                    <entry key="OutputPropertiesImpl_axis.units_VGCAxes.data" value="AxisUnits.MB"/>
                    <entry key="OutputPropertiesImpl_axis.units_VGCAxes.gc.type" value="AxisUnits.collection.type"/>
                    <entry key="Colours9" value="255,165,0"/>
                    <entry key="VGCLabels.gc.rate" value="65,53,157"/>
                    <entry key="VGCLabels.pause.times.with.exclusive.access" value="121,128,255"/>
                    <entry key="StructuredIDsToDisplayPropertiesImpl" value="summary,quantum.pause.summary"/>
                    <entry key="Colours1" value="0,0,255"/>
                    <entry key="SourcePreferenceHelperBufferSize" value="1024"/>
                    <entry key="VGCLabels.live.heap.after.global.gc" value="158,177,141"/>
                    <entry key="VGCLabels.jvm.restarts" value="191,228,69"/>
                    <entry key="OutputPropertiesImpl_axis.units_VGCAxes.number" value="AxisUnits.100s"/>
                    <entry key="Colours6" value="173,216,230"/>
                    <entry key="OutputPropertiesImpl_axis.units_VGCAxes.gc.scope" value="AxisUnits.region"/>
                    <entry key="VGCLabels.free.flat.heap" value="50,26,47"/>
                    <entry key="OutputPropertiesImpl_axis.units_VGCAxes.heap" value="AxisUnits.MB"/>
                  </map>
                </node>
              </node>
            </node>
          </node>
        </node>
      </node>
    </node>
  </root>
</preferences>
Here's an example way to run this over many verbosegc files:
for i in */verbosegc*.log; do pushd $(dirname $i); mkdir $(basename $i .log); ~/work/gcmv/V2.8.7_20231127/IBM\ Garbage\ Collection\ and\ Memory\ Visualizer.app/Contents/MacOS/gcmv -consoleLog -nosplash -rc -display 1024x768 -application com.ibm.java.diagnostics.visualizer.headless.application -f $(readlink -f $(basename $i)) -o $(pwd)/$(basename $i .log)/ -p ~/work/gcmv/gcmv_pauses_and_proportion.epf; popd; done