Java
Java Recipe
- Review the Operating System recipe for your OS.
- Tune the maximum Java heap size (
-Xmxor-XX:MaxRAMPercentage):- Ensure that verbose garbage collection is enabled (which it is by default in recent versions of Liberty and tWAS) which generally has an overhead less than 0.5% and then use a tool such as the IBM Garbage Collection and Memory Visualizer (GCMV) and ensure that the proportion of time spent in garbage collection versus application processing time is less than 5% and ideally less than 1%.
- In general, a place to start is to set the maximum size to 43% larger than the maximum occupancy of the application, although the latter is largely a function of workload and thread pool size, so this is just a heuristic.
- Consider testing different garbage collectors for the OpenJ9/IBM JVM and HotSpot JVM.
- Consider testing an increased maximum nursery size for generational collectors.
- Ensure there is no memory leak after global garbage collections with long running tests by reviewing verbosegc.
- If using a generational collector (which most modern default
collectors are):
- Ensure tests run through full/tenured collections and ensure those pause times are not too long.
- Ensure that there is a sawtooth pattern in the heap usage after collection. Otherwise, the heap size may be too small or the nursery too big.
- Consider monitoring for pause times over one second and tune GC if found. Sometimes high pause times are acceptable.
- Use a profiler such as IBM Java Health Center or OpenJDK Mission Control with a particular focus on the profiling and lock contention analysis; otherwise, use periodic thread dumps to review JVM activity with the IBM Thread and Monitor Dump Analyzer tool.
- Object allocation failures for objects greater than 5MB should generally be investigated. Sometimes high allocation sizes are acceptable.
- If the node only uses IPv4 and does not use IPv6, then add the JVM
parameters
-Djava.net.preferIPv4Stack=true -Djava.net.preferIPv6Addresses=false - Consider taking a system dump or HPROF heapdump during peak activity in a test environment and review it with the Eclipse Memory Analyzer Tool to see if there are any areas in the heap for optimization.
- Review the stderr and stdout logs for any errors, warnings, or high volumes of messages (e.g. OutOfMemoryErrors, etc.).
- If running multiple JVMs on the same machine, consider pinning JVMs to sets of processor cores and tuning -Xgcthreads/-XcompilationThreads (IBM/OpenJ9 JVM) or -XX:ParallelGCThreads (HotSpot JVM).
- In general, if memory usage is very flat and consistent, it may be optimal to fix -Xms = -Xmx. For widely varying heap usage, -Xms < -Xmx is generally recommended.
- If heavily using XML, consider explicitly configuring JAXP ServiceLoader properties to avoid unnecessary classloading activity.
General
A Java Virtual Machine (JVM) provides the core components needed to run a Java program such as a Virtual Machine (VM) which performs core functions such as memory management, a Garbage Collector (GC) which periodically cleans up unused memory, and a Just-In-Time Compiler (JIT) which translates heavily used Java code into native code for better performance.
A Java Runtime Environment (JRE) is a JVM plus a Java Standard Edition (SE) Class Library (JCL). A JRE provides the Java executable (e.g. java, javaw) to run a Java program. The JCL provides the implementation of core Java classes from some version of the Java SE specification such as java.lang.String, etc.
A Java Development Kit (JDK) is a JRE plus Java tools. Java tools include a compiler (javac), archive utility (jar), etc.
A Software Development Kit (SDK) is a generic term for a collection of tools and a runtime environment to enable the development and running of code for any language. A JDK is an SDK for Java.
The Java landscape is quite confusing. Performance tuning and diagnostics depend on the version and vendor of the JDK. This chapter covers topics that span all JDKs; however, you will certainly want to review the sub-chapters specific to your JDK. Here are links to those sub-chapters along with a bit of historical background to hopefully explain the complexity:
- The HotSpot JVM (sometimes colloquially called the Sun JVM) is the original JVM built by Sun Microsystems who created Java. The JCL created by Sun and packaged with HotSpot never really had a widely used name. Oracle purchased Sun and continued to package HotSpot and that JCL as part of Oracle Java. HotSpot and that JCL were also open-sourced by Sun as OpenJDK. There was a period of some divergence, but modern versions of Oracle Java and OpenJDK+HotSpot are largely the same. Therefore, if you're running Oracle Java or HotSpot (e.g. as part of Adoptium, IcedTea, Amazon Coretto, GraalVM, etc.), the JVM sub-chapter to use is HotSpot JVM and the JCL sub-chapter to use is OpenJDK JCL and Tools. Oracle Java is shipped at https://www.java.com/, and one popular flavor of OpenJDK+HotSpot is shipped at https://adoptium.net/.
- IBM created its own JVM called J9 (which has nothing to do with Java 9; it came in around Java 1.4.2). J9 is packaged as part of IBM Java. J9 was also open-sourced as Eclipse OpenJ9 and it's available for download as the Semeru Runtime Open or Certified Editions. Therefore, if you're using IBM Java or Semeru (OpenJ9+OpenJDK), the JVM sub-chapter to use is OpenJ9 and IBM J9 JVMs. The JDK story is more complicated; IBM licensed the Sun JDK and made some changes to both the JCL and the Java tools. If you're using IBM Java <= 8, the JCL sub-chapter to use is IBM JCL and Tools, although some of the OpenJDK JCL and Tools chapter may also apply. However, if you're using Semeru, as part of the process of open-sourcing J9, IBM mostly abandoned its JCL and Java tools forks and ships with the JCL and Java tools from OpenJDK; therefore, if you're using Semeru, the JCL sub-chapter is OpenJDK JCL and Tools. This change is particularly important if you're migrating from IBM Java <= 8 to Semeru: the JVM is largely the same, but the JCL may have significant changes (e.g. the performance characteristics of the JAXP XSLT compiler may change positively or negatively depending on the use case). IBM Java is available at https://www.ibm.com/support/pages/java-sdk-downloads (and shipped as part of various stack products) and Semeru is at https://developer.ibm.com/languages/java/semeru-runtimes/downloads. There are additional differences such as the fact that Mission Control doesn't work on J9; if available, use Health Center instead.
General Tuning
If only using IPv4, set the generic JVM argument
-Djava.net.preferIPv4Stack=true
JAXP ServiceLoader
By default, JAXP factories use ServiceLoader if not otherwise configured to avoid it, and ServiceLoader may heavily drive classloading. For example, here is the algorithm for DocumentBuilderFactory:
- Use the javax.xml.parsers.DocumentBuilderFactory system property.
- Use the properties file "lib/jaxp.properties" in the JRE directory. This configuration file is in standard java.util.Properties format and contains the fully qualified name of the implementation class with the key being the system property defined above. The jaxp.properties file is read only once by the JAXP implementation and it's values are then cached for future use. If the file does not exist when the first attempt is made to read from it, no further attempts are made to check for its existence. It is not possible to change the value of any property in jaxp.properties after it has been read for the first time.
- Uses the service-provider loading facilities, defined by the ServiceLoader class, to attempt to locate and load an implementation of the service using the default loading mechanism: the service-provider loading facility will use the current thread's context class loader to attempt to load the service. If the context class loader is null, the system class loader will be used.
- Otherwise, the system-default implementation is returned.
Therefore, if the factory isn't specified with a system property and
if there is no lib/jaxp.properties file with an uncommented
line for that factory, then every call to newInstance
drives classloading.
This applies to the other JAXP factories as well: SAXParserFactory, TransformerFactory, XPathFactory, SchemaFactory, and DatatypeFactory.
You may explicitly specify the factories using system properties depending on your JDK. For example:
OpenJDK:
-Djavax.xml.transform.TransformerFactory=org.apache.xalan.processor.TransformerFactoryImpl
-Djavax.xml.xpath.XPathFactory=org.apache.xpath.jaxp.XPathFactoryImpl
-Djavax.xml.xpath.XPathFactory:http://java.sun.com/jaxp/xpath/dom=org.apache.xpath.jaxp.XPathFactoryImpl
-Djavax.xml.parsers.SAXParserFactory=org.apache.xerces.jaxp.SAXParserFactoryImpl
-Djavax.xml.parsers.DocumentBuilderFactory=org.apache.xerces.jaxp.DocumentBuilderFactoryImpl
-Djavax.xml.validation.SchemaFactory:http://www.w3.org/2001/XMLSchema=org.apache.xerces.jaxp.validation.XMLSchemaFactory
-Djavax.xml.datatype.DatatypeFactory=org.apache.xerces.jaxp.datatype.DatatypeFactoryImpl
IBM Java:
-Djavax.xml.transform.TransformerFactory=com.ibm.xtq.xslt.jaxp.compiler.TransformerFactoryImpl
-Djavax.xml.xpath.XPathFactory=org.apache.xpath.jaxp.XPathFactoryImpl
-Djavax.xml.xpath.XPathFactory:http://java.sun.com/jaxp/xpath/dom=org.apache.xpath.jaxp.XPathFactoryImpl
-Djavax.xml.parsers.SAXParserFactory=org.apache.xerces.jaxp.SAXParserFactoryImpl
-Djavax.xml.parsers.DocumentBuilderFactory=org.apache.xerces.jaxp.DocumentBuilderFactoryImpl
-Djavax.xml.validation.SchemaFactory:http://www.w3.org/2001/XMLSchema=org.apache.xerces.jaxp.validation.XMLSchemaFactory
-Djavax.xml.datatype.DatatypeFactory=org.apache.xerces.jaxp.datatype.DatatypeFactoryImpl
On IBM Java, you may also test a different implementation of
javax.xml.transform.TransformerFactory with
-Djavax.xml.transform.TransformerFactory=org.apache.xalan.processor.TransformerFactoryImpl
Alternatively for IBM Java, it ships a
jre/lib/jaxp.properties.sample file that may be renamed to
jre/lib/jaxp.properties and all of its last 6 lines
uncommented as well as a jre/lib/xerces.properties whose
last line may be uncommented.
Note that starting with Java 8, JAXP is upgraded to version 1.6 and this specifies using ServiceLoader instead of the lesser defined "Services API" in previous versions:
The Java SE 8 release contains Java API for XML Processing (JAXP) 1.6, which requires the use of the service provider loader facility defined by java.util.ServiceLoader to load services from service configuration files.
Garbage Collection
Garbage collection automatically frees unused objects. All major JVMs are designed to work with a maximum Java heap size (specified with -Xmx). When the Java heap is full (or various sub-heaps), an allocation failure occurs and the garbage collector will kick in to try to find space. There are some key aspects to garbage collections:
- Mark: Determine whether objects are live or unused.
- Sweep: Reclaim unused objects by marking their memory as available on a free list.
- Compact: Reduce fragmentation by rearranging the free list into one area of memory.
- Generational collector: Split the heap into two parts: a nursery for short lived objects and a tenured area for long-lived objects.
- Copy collection: Mark, then copy live objects into a survivor space (and/or tenured space for generational collectors). A compaction in the survivor space is implicit.
- Stop-the-world (STW) operation: The "world" is Java and a STW operation stops all Java activity while some operations are performed.
Best practice: The proportion of time spent in garbage collection versus application time should be less than 10% and ideally less than 1%.
One of the most important tuning parameters is the maximum heap size. There are three broad types of memory when considering the maximum heap size:
- Base footprint: This generally includes the base product (such as WAS, Portal, etc.) as well as metadata such as Classes and ClassLoaders used by your application.
- Caches and functional queues: These include in-memory caches such as object caches and pools, and functional queues comprised of queues that hold HTTP session data, for example, if stateful HTTP requests are being used.
- Per thread data: Each piece of work ultimately executes on one or more threads. Each thread will allocate memory while it processes its unit of work. The maximum thread pool size is intimately related to the maximum heap size.
Increasing the maximum heap size increases the time between allocation failures but also increases the duration of each garbage collection. These two aspects must be kept in balance.
Generational collectors (e.g. IBM gencon/balanced and all HotSpot collectors) split the heap into one or more regions for different age groups of objects. This is based on the observation that Java programs tend to have two different types of objects: long-lived and short-lived. The purpose of splitting the heap (and collecting the heaps in different phases) is to reduce the average time spent in garbage collection by avoiding checking objects that are long-lived since they are less likely to be garbage.
Some tools will refer to "used" heap. This is not necessarily the same as "live" heap or "footprint." This is because some garbage collection policies such as generational collectors will actively avoid collecting certain subsets of garbage in some types of collections. This garbage will still be part of "used" heap, but it is not live, by definition.
"Look for peaks in the "Pause times (including exclusive access)" line to identify long garbage collection cycles. When you have identified a long garbage collection cycle, determine which of the mark, sweep, and compact activities of the garbage collection cycle caused the cycle to be as long as it was... If you find long garbage collection cycles you can examine, the raw verbose:gc entry for that garbage collection cycle by selecting the first tab at the bottom of the main panel. This tab has the same name as the file containing the verbose:gc data. You can then look for the garbage collection cycle. Raw verbose:gc cycle output is useful because it often contains the reason why particular actions were taken in that cycle and you can see how to avoid those actions."
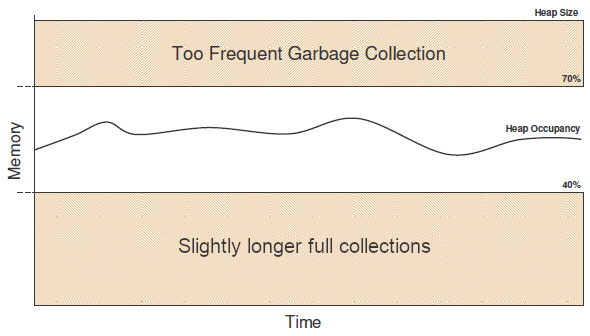
"To ensure that the occupancy does not exceed 70%, set the maximum Java heap size to at least 43% larger than the Maximum occupancy value provided by GCMV. This setting then makes the Maximum value 70% of the Java heap and the average to be above 40% of the Java heap size... In situations where memory occupancy of the Java heap varies significantly, you might not be able to maintain occupancy between 40% and 70% of the Java heap. In these situations, it is more important to keep the occupancy below 70% of the maximum heap size than it is to keep the occupancy above 40%."
"Two additional metrics to key in on are the garbage collection intervals and the average pause times for each collection. The GC interval is the amount of time in between garbage collection cycles. The pause time is the amount of time that a garbage collection cycle took to complete... As heap size increases, the interval between GCs increase, enabling more work to be performed before the JVM pauses to execute its garbage collection routines. However, increasing the heap also means that the garbage collector must process more objects and, in turn, drives the GC pause times higher... The GC intervals and pause times together make up the amount of time that was spent in garbage collection: % Time in GC = (Average Pause Time) / (GC Interval + Average Pause Time)"
One useful set of tests is to plot maximum heap size along with % Time in GC to find the best maximum heap size.
One of the most important factors for choosing a policy is the worst case pause time.
Optimal Heap Size
"If the occupancy of the Java heap is too high, garbage collection occurs frequently. If the occupancy is low, garbage collection is infrequent but lasts longer... Try to keep the memory occupancy of the Java heap between 40% and 70% of the Java heap size... The highest point of occupancy of the Java heap is preferably not above 70% of the maximum heap size, and the average occupancy is between 40% and 70% occupancy. If the occupancy goes over 70%, resize the Java heap."
"A correctly sized Java heap should always have a memory occupancy of between 40% and 70% of the maximum Java heap size. To ensure that the occupancy does not exceed 70%, set the maximum Java heap size to at least 43% larger than the Maximum occupancy value provided by GCMV. This setting then makes the Maximum value 70% of the Java heap and the average to be above 40% of the Java heap size."
By default the JVM provides a very flexible heap configuration that
allows the heap to grow and shrink dynamically in response to the needs
of the application. This allows the JVM to claim only as much memory as
necessary at any given time, thereby cooperating with other processes
running on the system. The starting and maximum size of the heap can be
specified with the -Xms<size><M|G> and
-Xmx<size><M|G> options respectively. This
flexibility however comes at a cost, as the JVM must request memory from
the operating system whenever the heap needs to be grown and return
memory whenever it shrinks. This behavior can lead to various worse-case
scenarios. If the application's heap requirements oscillate it may cause
excessive heap growth and shrinkage. If the JVM is running on a
dedicated machine or memory is otherwise not a concern, the overhead of
heap resizing can be eliminated by requesting a constant sized heap.
This can be accomplished by setting -Xms equal to -Xmx. Choosing the
right size for the heap is very important, as GC overhead is directly
proportional to the size of the heap! The heap should be large enough to
satisfy the application's maximum memory requirements and also contain
some wiggle room. The GC has to work much harder when the heap is near
full capacity due to fragmentation and other issues, so 20-30% of extra
space above the application's maximum needs can lower overall GC
overhead.
If an application requires more flexibility than can be achieved with
a constant sized heap it may be beneficial to tune the sizing parameters
for a dynamic heap. One of the most expensive GC events is object
allocation failure. This occurs when there is not enough contiguous
space in the current heap to satisfy the allocation and results in a GC
collection and a possible heap expansion. If the current heap size is
less than Xmx the heap will be expanded in response to the allocation
failure if the amount of free space is below a certain threshold.
Therefore, it is important to insure that when an allocation fails the
heap is expanded to not only allow the failed allocation to succeed, but
also many future allocations, otherwise the next failed allocation could
trigger yet another GC collection. This is known as heap thrashing. The
-Xminf, -Xmaxf, -Xmine, and -Xmaxe group of options can be used to
effect when and how the GC resizes the heap. The -Xminf<factor>
option (where factor is a real number between 0 and 1) specifies the
minimum free space in the heap; if the total free space falls below this
factor the heap is expanded. The -Xmaxf<factor> option specifies
the maximum free space; if the total free space rises above this factor
the heap is shrunk. These options can be used to minimize heap thrashing
and excessive resizing. The -Xmine<size><M|G>
and -Xmaxe<size><M|G> options specify the
minimum and maximum sizes to shrink and grow the heap by. These options
can be used to insure that the heap has enough free contiguous space to
allow satisfy a reasonable number of allocations before failure.
In general, if memory usage is very flat and consistent, it may be optimal to fix -Xms=-Xmx. For widely varying heap usage, -Xmx<-Xmx is generally recommended. You may get the best of both worlds by settings -Xms to the lowest steady state memory usage, -Xmaxf1.0 to eliminate shrinkage, -Xminf to avoid compaction before expansion, and -Xmine to reduce expansions.
Regardless of whether or not the heap size is constant, it should never exceed the physical memory available to the process, otherwise the operating system may have to swap data in and out of memory. An application's memory behavior can be determined by using various tools, including verbose GC logs.
"GC will adapt heap size to keep occupancy between 40% and 70%. Heap occupancy over 70% causes frequent GC - reduced performance. Heap occupancy below 40% means infrequent GC cycles, but cycles can be longer than they need to be - longer pause times - Reduced Performance. The maximum heap size should therefore be about 40% larger than the maximum occupancy. Maximum occupancy + 43% means occupancy at 70% of total heap. Example: For 70 MB occupancy, 100 MB Max Heap required, which is 70 MB plus 43% of 70 MB."
Generational Garbage Collectors
The Sawtooth
A generational garbage collector tenures objects from the "young" or "nursery" region of the Java heap into an "old" or "tenured" region of the Java heap. If the rate of garbage creation exceeds the rate at which young/nursery generation scavenges can clear objects before they are tenured, then this garbage builds up in the tenured region. When the tenured region fills up, a full garbage collection is run to clean up this garbage. This pattern may suggest suboptimal tuning; however, it may be unavoidable. This is a very common pattern and produces a "sawtooth" shape of Java heap usage. For example, here is a graph from the Garbage Collection and Memory Visualizer Tool:
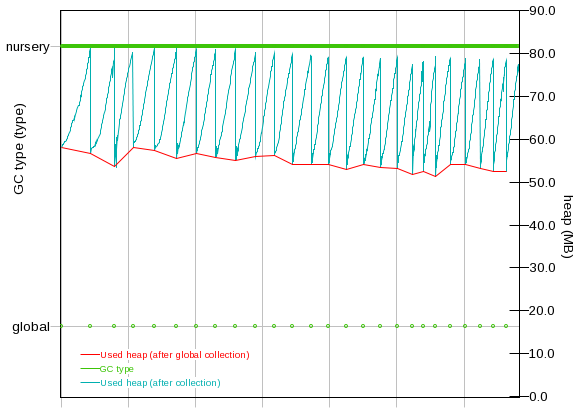
In the above graph, there are three different plots:
- Used heap (after collection) - teal color. This is what most people look at first when analyzing Java heap usage. This is a line plot of the heap usage after any garbage collection, whether nursery or tenured. This shows the classic sawtooth pattern.
- Used heap (after global collection) - red color. This is a better way to look at the "real" Java heap usage over time. This is a line plot of the heap usage only after full garbage collections. This does not show the build-up of garbage in the tenured area. If the slope of this line is positive, there may be a leak.
- GC type - green color. The "nursery" line at the top is a solid color and this is expected because nursery scavenges should occur frequently under load. The "global" plot at the bottom shows a few periodic full garbage collections. These will line up with the large drops in heap usage when the build-up of garbage is cleaned up in the tenured area.
The implication of the sawtooth is that it is generally naïve to look
at the used heap after any collection or to otherwise sample Java heap
usage. In the case of a sawtooth usage pattern, such measurements are
likely to include a lot of garbage. This also means that common
techniques like "tailing" the verbose garbage collection log must be
more sophisticated to look at used heap only after global collections
(this may be done with grep -A ... | grep for example).
Verbose garbage collection (-verbose:gc)
Enabling Verbosegc
Verbose garbage collection (known colloquially as verbosegc) prints details about the operations of the garbage collector to a text file. This output can be processed in a tool such as the IBM Garbage Collection and Memory Visualizer (GCMV) to understand the proportion of time spent in garbage collection, total pause times, etc.
A common heuristic is that the proportion of time in GC should be less than 5% and ideally less than 1%. Tools such as GCMV can calculate this statistic.
By default, verbosegc is not enabled in the OpenJ9 JVM (IBM Java and IBM Semeru Runtimes) and the HotSpot JVM; however, verbosegc is enabled by default in recent versions of WebSphere Application Server traditional and WebSphere Liberty. The overhead of verbosegc in the OpenJ9 JVM is about less than 0.5% and therefore IBM generally recommends that verbosegc is enabled for most production environments.
See the verbosegc section of each JVM vendor's chapter for more details on how to enable verbosegc:
GC Threads
The garbage collector used by the JVM takes every opportunity to exploit parallelism on multi-CPU machines. All phases of the GC can be executed in parallel with multiple helper threads dividing up the work in order to complete the task as quickly as possible. Depending on the GC strategy and heap size in use, it may be beneficial to adjust the number of threads that the GC uses. The number of GC threads can be specified with the -Xgcthreads<number> option. The default number of GC threads is equal to the number of logical processors on the machine minus 1 and it is usually not helpful to exceed this value, reducing it however will reduce GC overhead and may be desirable in some situations. The most important consideration is the number of CPUs available to the JVM; if the JVM is pinned to less than the total number of CPUs (for example by using execrset on AIX or taskset on Linux) then the number of GC threads should be adjusted. Tuning the number of GC threads may also be desirable when running multiple JVMs on a single machine, or when the JVM is running in a virtualized environment.
Memory Leaks
Memory leaks in the Java language are a dangerous contributor to garbage collection bottlenecks. Memory leaks are more damaging than memory overuse, because a memory leak ultimately leads to system instability. Over time, garbage collection occurs more frequently until the heap is exhausted and the Java code fails with a fatal out-of-memory exception. Memory leaks occur when an unused object has references that are never freed. Memory leaks most commonly occur in collection classes, such as Hashtable because the table always has a reference to the object, even after real references are deleted.
High workload often causes applications to crash immediately after deployment in the production environment. If an application has memory leaks, a high workload can accelerate the magnification of the leakage and cause memory allocation failures to occur.
The goal of memory leak testing is to magnify numbers. Memory leaks are measured in terms of the amount of bytes or kilobytes that cannot be garbage collected. The delicate task is to differentiate these amounts between expected sizes of useful and unusable memory. This task is achieved more easily if the numbers are magnified, resulting in larger gaps and easier identification of inconsistencies. The following list provides insight on how to interpret the results of your memory leak testing:
Memory leak problems can manifest only after a period of time, therefore, memory leaks are found easily during long-running tests. Short running tests might provide invalid indications of where the memory leaks are occurring. It is sometimes difficult to know when a memory leak is occurring in the Java language, especially when memory usage has seemingly increased either abruptly or monotonically in a given period of time. The reason it is hard to detect a memory leak is that these kinds of increases can be valid or might be the intention of the developer. You can learn how to differentiate the delayed use of objects from completely unused objects by running applications for a longer period of time. Long-running application testing gives you higher confidence for whether the delayed use of objects is actually occurring.
Repetitive test
In many cases, memory leak problems occur by successive repetitions of the same test case. The goal of memory leak testing is to establish a big gap between unusable memory and used memory in terms of their relative sizes. By repeating the same scenario over and over again, the gap is multiplied in a very progressive way. This testing helps if the number of leaks caused by the execution of a test case is so minimal that it is hardly noticeable in one run.
You can use repetitive tests at the system level or module level. The advantage with modular testing is better control. When a module is designed to keep the private module without creating external side effects such as memory usage, testing for memory leaks is easier. First, the memory usage before running the module is recorded. Then, a fixed set of test cases are run repeatedly. At the end of the test run, the current memory usage is recorded and checked for significant changes. Remember, garbage collection must be suggested when recording the actual memory usage by inserting System.gc() in the module where you want garbage collection to occur, or using a profiling tool, to force the event to occur.
Concurrency test
Some memory leak problems can occur only when there are several threads running in the application. Unfortunately, synchronization points are very susceptible to memory leaks because of the added complication in the program logic. Careless programming can lead to kept or not-released references. The incident of memory leaks is often facilitated or accelerated by increased concurrency in the system. The most common way to increase concurrency is to increase the number of clients in the test driver.
Consider the following points when choosing which test cases to use for memory leak testing:
A good test case exercises areas of the application where objects are created. Most of the time, knowledge of the application is required. A description of the scenario can suggest creation of data spaces, such as adding a new record, creating an HTTP session, performing a transaction and searching a record.
Look at areas where collections of objects are used. Typically, memory leaks are composed of objects within the same class. Also, collection classes such as Vector and Hashtable are common places where references to objects are implicitly stored by calling corresponding insertion methods. For example, the get method of a Hashtable object does not remove its reference to the retrieved object.
Heap consumption that indicates a possible leak during periods when the application server is consistently near 100 percent CPU utilization, but disappears when the workload becomes lighter or near-idle, is an indication of heap fragmentation. Heap fragmentation can occur when the JVM can free sufficient objects to satisfy memory allocation requests during garbage collection cycles, but the JVM does not have the time to compact small free memory areas in the heap to larger contiguous spaces.
Another form of heap fragmentation occurs when objects that are less than 512 bytes are freed. The objects are freed, but the storage is not recovered, resulting in memory fragmentation until a heap compaction occurs.
Many customers have daily or weekly restarts, often because of uninvestigated leaks. These customers will often believe that this is a "solution" to their problem, and although that may avoid OutOfMemoryErrors, it may still impact garbage collection times.
You should also monitor native memory leaks using operating system tools.
Determining Leaks with Generational Collectors
By design, generational collectors may put trash into the tenured region until a full collection occurs; therefore, to determine if there is a leak with a generational collector, review the used Java heap after full garbage collections. If the slope is positive, then there may be a leak. However, there are cases where even this pattern may not be a leak. For example, if a SoftReference cache builds up more quickly than the soft reference threshold to clear them, the used heap after global collection may rise but those SoftReferences will be cleared under memory pressure.
InetAddress Cache
Review the cache for DNS name resolutions: http://www-01.ibm.com/support/docview.wss?uid=swg21207534
32-bit versus 64-bit
There is a non-trivial cost for 64-bit over 32-bit due to increased memory requirements (larger pointers/references), reduced processor data and instruction cache line hits (e.g. L2, L3 caches, TLB cache hits), etc. Even with -Xcompressedrefs, the performance hit for 64-bit may be up to 5-10% and the increase in overall memory usage up to 15% (see also).
Some scenarios where 64-bit is better:
- Computationally expensive or scientific applications.
- A large cache avoids out of process calls to get data.
- If the application requires a large Java heap that cannot be fit into 32-bit processes otherwise.
- If the application requires more native memory.
- If the 64-bit process gets more registers than a 32-bit process, it may run more quickly. For example, with the IBM Power CPU, 32-bit and 64-bit processes get the same number of registers.
Synchronization and Lock Contention
"If the method is an instance method, [synchronization] locks the lock associated with the instance for which it was invoked (that is, the object that will be known as this during execution of the body of the method). If the method is static, [synchronization] locks the lock associated with the Class object that represents the class in which the method is defined." (See Java Specification)
"Multithreaded applications apply synchronization (locks) around shared resources to ensure that the state of the resource is consistent and that the state is not changed by one thread while it is read by another thread. When an application is deployed on a larger number of CPUs, and subjected to an increasing load, the demand for shared resources increases. To manage the shared resources, more synchronization locks might be created. These locks can become points of contention, preventing threads from executing at the same time. The result is that the application cannot scale to use all available CPU."
You can reduce the rate of lock contention in two ways:
- Reduce the time that the lock is owned when it is taken; for example, limit the amount of work done under the lock in the synchronized block of code.
- Reduce the scope of the lock; for example, instead of using a single lock for an entire table, use separate locks for each row or column of the table.
A thread must spend as little time as possible holding a lock. The longer a lock is held, the greater the probability that another thread tries to obtain the lock and is forced to wait. Reducing the duration that a lock is held reduces the contention on the lock and allows the application to scale further. If you see a long average hold time for a lock, examine the source code:
- check if code that runs under the lock can be moved outside the lock; for example, the code does not act on the shared resource. In this case, move the code outside the lock to allow it to be run in parallel with other threads.
- check if code that runs under the lock results in a blocking operation; for example, a connection to another process is made. In this case, realease the lock before the blocking operation starts.
The locking architecture in an application must be granular enough that the level of lock contention is low. The greater the amount of shared resource that is protected by a single lock, the greater the probability that multiple threads try to access the resource at the same time. Reducing the scope of the resource protected by a lock, and therefore increasing the lock granularity, reduces the level of lock contention and allows the application to scale further.
ReentrantLock
The states and owners of java.util.concurrent.locks.ReentrantLock instances are not reported in thread dumps. A system dump or HPROF heapdump can be used with the Memory Analyzer Tool (Open Query Browser > Java Basics > Thread Overview and Stacks) to analyze the exclusiveOwnerThread field of the ReentrantLock to review ownership and contention.
Investigate Lock Contention
- Use thread dumps and review the raw text files for lock contention or use a tool such as TMDA.
- If the step above is inconclusive, use a sampling lock profiler such as HealthCenter (for IBM Java and OpenJ9) or MissionControl (for HotSpot).
- If the step above is inconclusive, use a deeper lock profiler such as Performance Inspector.
Deadlocks
A deadlock occurs when two or more threads are contending on resources in such a way that each thread is preventing the others from continuing. If exactly two threads or processes are contending on resources, the deadlock can be called a "deadly embrace".
In a deadlock, Thread 1 owns the lock on Object A and is trying to acquire the lock on Object B. At the same time, Thread 2 owns the lock on Object B and is trying to acquire the lock on Object A. Neither thread will give up the lock it has, so neither thread can continue. In more complicated forms, the deadlock problem can involve multiple threads and multiple locks. In the case of a Java application, the presence of a deadlock typically leads to most or all of the threads in the application becoming unable to carry out further work as they queue up on the locks involved in the deadlock.
See the Deadlock sections below for each JVM vendor for techniques on determining deadlocks.
Classloading
"[Before Java 7], multithreaded custom class loaders could deadlock when they did not have an acyclic delegation model." (http://docs.oracle.com/javase/7/docs/technotes/guides/lang/cl-mt.html)
Therefore,
"Currently many class loading interactions are synchronized on the class loader lock." (http://openjdk.java.net/groups/core-libs/ClassLoaderProposal.html)
However,
"The Java SE 7 release includes the concept of a parallel capable class loader." (http://docs.oracle.com/javase/7/docs/technotes/guides/lang/cl-mt.html)
But,
WAS currently uses the older synchronized classloader design even in Java 7. In cases where there is significant monitor contention in ClassLoader synchronization, the common root cause of the contention is some repeated pattern of class loads (for example, creating JAXP objects), and it's often possible to cache the results of these loads and avoid the problematic class loads.
Explicit Garbage Collection (System.gc, Runtime.gc)
It is generally a malpractice for an application to call System.gc()
or Runtime.gc().
System.gc() calls Runtime.gc() so we will use
them interchangeably. By default, these calls request the JVM to perform
a full garbage collection. In some JVM versions, a single
gc call triggers two back to back global GCs as well as
processing all references in the queues. These calls may be unnecessary
and may increase the proportion of time spent in garbage collection than
otherwise would have occurred if the garbage collector was left
alone.
The generic JVM arguments -Xdisableexplicitgc (OpenJ9 /
IBM Java / IBM Semeru Runtimes) and -XX:+DisableExplicitGC
(HotSpot) are used to tell the JVM to do nothing when
System.gc() and Runtime.gc() are called.
Although these options may be used as a way to reduce the impact of
System.gc or Runtime.gc() calls, there are
potential unintended consequences; for example, in some JVM
implementations, core Java functionality such as
DirectByteBuffer cleanup may be affected in some situations
leading to unnecessary OutOfMemoryErrors and crashes since the JCL's
self-healing calls to System.gc to cleanup iceberg native
objects have no effect.
Therefore, it is generally a malpractice to use
-Xdisableexplicitgc or -XX:+DisableExplicitGC
other than as a temporary workaround. The best practice is to figure out
who is calling System.gc or Runtime.gc() and
avoid or remove those calls. System.gc calls
Runtime.gc so it's best to investigate the latter since
that covers the former. Here are methods to determine this:
Detect
Runtime.gc on OpenJ9 / IBM Java / IBM Semeru Runtimes using
-Xtrace
Restart the JVM with the generic JVM argument
-Xtrace:trigger=method{java/lang/Runtime.gc,jstacktrace},print=mt
Any time System.gc is called, a stack trace will be printed to
stderr. For example:
12:02:55.436*0x191de00 mt.2 > java/lang/Runtime.gc()V Native method, This = 1b24188
12:02:55.463 0x191de00 mt.18 - Instance method receiver: java/lang/Runtime@00002B8F6249AA70 arguments: ()
12:02:55.463 0x191de00j9trc_aux.0 - jstacktrace:
12:02:55.464 0x191de00j9trc_aux.1 - [1] java.lang.Runtime.gc (Native Method)
12:02:55.464 0x191de00j9trc_aux.1 - [2] java.lang.System.gc (System.java:278)
12:02:55.464 0x191de00j9trc_aux.1 - [3] Test.main (Test.java:3)
Important Note: Until IBM Java 7.1, using -Xtrace:print=mt may have a significant overhead. See the -Xtrace section in the IBM Java chapter.
Detect Runtime.gc using a tracing profiler
There are many tracing profilers which can time method calls. Find a profiler with the option of only profiling the Runtime.gc method and with the option of getting a call stack to the profile samples.
Detect Runtime.gc by attaching a debugger
Attach a debugger and set a breakpoint in the Runtime.gc method. Then inspect the call stack.
Common Callers of System.gc
DirectByteBuffer usage may drive calls to System.gc.
If using RMI, a background thread calls System.gc every hour by default. This interval may be controlled with JVM parameters (in milliseconds):
Every 100 hours:
-Dsun.rmi.dgc.client.gcInterval=360000000 -Dsun.rmi.dgc.server.gcInterval=360000000Essentially never:
-Dsun.rmi.dgc.server.gcInterval=9223372036854775807 -Dsun.rmi.dgc.client.gcInterval=9223372036854775807There is an undocumented API
sun.misc.GC.requestLatencywhich may be used to schedule a background thread that callsSystem.gcon the specified interval. TheSystem.gcwill be called from the methodsun.misc.GC$Daemon.run.
java.nio.DirectByteBuffers
DirectByteBuffers (DBBs) allocated through java/nio/ByteBuffer.allocateDirect
are one way for Java applications to allocate and modify native memory
outside of the Java heap.
DirectByteBuffers and full garbage collections
Since DirectByteBuffers are managed through PhantomReferences,
their final cleanup occurs through full garbage collections. In a
similar way that the Java heap has a maximum size (configured with
-Xmx or -XX:MaxRAMPercentage) which is then
garbage collected as needed, a maximum size may be configured on the
total native memory allocated through DirectByteBuffers
using -XX:MaxDirectMemorySize
which garbage collects any no-longer-used DirectByteBuffer
allocations. Ensure there is enough physical memory to support the DBB
demands.
If this maximum would be exceeded when trying to allocate a new
DirectByteBuffer, then Java will first run some number of
full garbabe collections; if those cleanups don't free enough
DirectByteBuffer native memory for the new allocation to
fit, then an OutOfMemoryError is thrown. The most common
causes of this are either that -XX:MaxDirectMemorySize is
too small for the given load or that there is a
DirectByteBuffer leak which can be investigated with the
Eclipse Memory Analyzer Tool.
IBM Semeru Runtimes and other OpenJDK based runtimes default -XX:MaxDirectMemorySize
to a proportion of the maximum heap size.
IBM Java (but not IBM Semeru Runtimes) defaults to an
unlimited -XX:MaxDirectMemorySize.
DirectByteBuffer native memory waste
Before Java 7, there was significant native memory waste for each DirectByteBuffer:
"Prior to the JDK 7 release, direct buffers allocated using java.nio.ByteBuffer.allocateDirect(int) were aligned on a page boundary. In JDK 7, the implementation has changed so that direct buffers are no longer page aligned. This should reduce the memory requirements of applications that create lots of small buffers. Applications that previously relied on the undocumented alignment can revert to previous behavior if they are run with the command line option: -XX:+PageAlignDirectMemory."
Reflection Inflation
When using Java reflection, the JVM has two methods of accessing the information on the class being reflected. It can use a JNI accessor, or a Java bytecode accessor. If it uses a Java bytecode accessor, then it needs to have its own Java class and classloader (sun/reflect/GeneratedMethodAccessor<N> class and sun/reflect/DelegatingClassLoader). These classes and classloaders use native memory. The accessor bytecode can also get JIT compiled, which will increase the native memory use even more. If Java reflection is used frequently, this can add up to a significant amount of native memory use. The JVM will use the JNI accessor first, then after some number of accesses on the same class, will change to use the Java bytecode accessor. This is called inflation, when the JVM changes from the JNI accessor to the bytecode accessor. (http://www-01.ibm.com/support/docview.wss?uid=swg21566549)
The option -Dsun.reflect.noInflation=true enables immediate inflation on all method invocations. In general, inflated Java bytecode accessors are faster than native JNI accessors, at the cost of additional native and Java memory usage.
Serviceability
The IBM JVM provides significant serviceability improvements such as:
- Thread dumps in separate files with much more information (but still lightweight)
- Easily showing stack traces of calls that allocate large objects
- Method trace and triggers to help with things such as getting stack traces of who is calling System.gc
Java Modules
Java module command line options:
--add-exports: Directly access otherwise non-exported packages. Example:--add-exports openj9.dtfjview/com.ibm.jvm.dtfjview=ALL-UNNAMED--add-opens: Reflectively access otherwise non-exported packages and call methods such assetAccessible. Example:--add-opens openj9.dtfjview/com.ibm.jvm.dtfjview=ALL-UNNAMED--add-modules: Load otherwise unloaded modules. Example:--add-modules=openj9.dtfjview
Java Agent
A simple agent that runs on startup:
- Example class:
import java.lang.instrument.*; public class Premain { public static void premain(String args, Instrumentation inst) { System.out.println("Premain agent started"); } } - Put a
META-INF/MANIFEST.MFin the jar with the content:Premain-Class: Premain - Package into a JAR and start the target JVM with:
-javagent:premain.jar