IBM Thread and Monitor Dump Analyzer (TMDA)
Overview
The IBM Thread and Monitor Dump Analyzer (TMDA) tool analyzes Java thread dumps, extracting out thread stacks and monitors and displaying them in a GUI: https://www.ibm.com/support/pages/ibm-thread-and-monitor-dump-analyzer-java-tmda
Thread dumps are primarily used in performance analysis as a low frequency, sampling profiler. They are a lightweight and generally non-intrusive way to get a picture of what the JVM is doing. For more details about profilers, see the Java Profilers chapter. The IBM Java and HotSpot Java troubleshooting sections list all of the ways to generate thread dumps.
Use TMDA to help you:
- Get a picture of what the JVM is doing
- See how threads are moving (or not moving) over time using the thread comparison view
- Check for deadlocks or lock contention
For a lab demonstrating TMDA, see https://github.com/IBM/webspherelab/blob/main/WAS_Troubleshooting_Perf_Lab.md#ibm-java-and-openj9-thread-dumps
Features and Benefits
TMDA displays thread dumps in an easy-to-navigate GUI view:
- Color code threads based on run state
- Summarize threads by the top stack frames
- Show a tree view of monitors
- Analyze native memory information in IBM Javacores
Installation
See the download instructions.

Usage
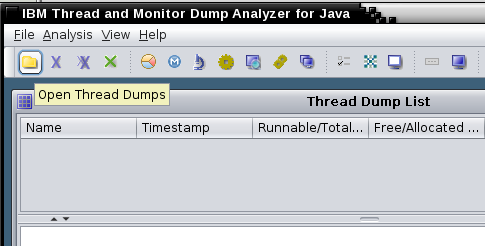
- Click the Open Thread Dumps button to load the thread dump
files:
- Select one or more thread dumps from the list and click on
Analysis.
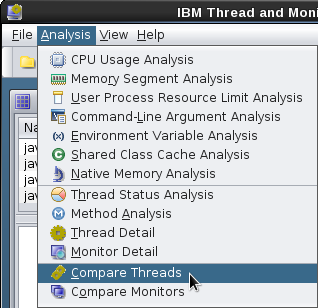
- You can do the following analysis :
- Native memory analysis
- Thread detail analysis
- Details of the thread monitor
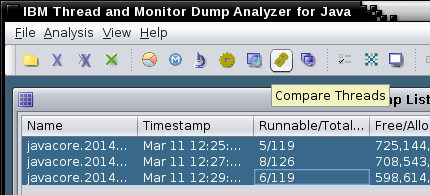
Compare threads from different files
Select one or more thread dumps in the thread dump list and click the Compare Threads button (also works for a single thread dump):
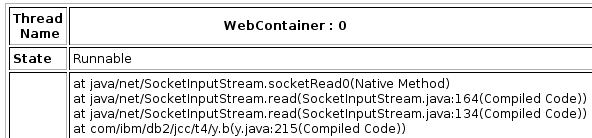
There will be a lot of threads that will be irrelevant in 90% of cases. Focus on the threads where your application work occurs, such as the WebContainer thread pool. In this example, all of the threads are waiting for work (either parked in the WAS BoundedBuffer or in IBM AIO code waiting for the next event). Remember that only the full stack is meaningful. In some cases, a parked thread, or a thread waiting in Object.wait may be a problem, so it's best to look methodically through the stacks.
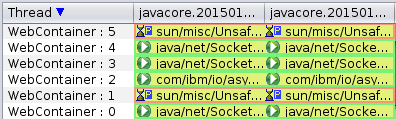
Key things to look for are:
- Are there any patterns in the stacks? For example, do you see a particular application stack frame always at the top? Or do you see a particular application stack frame somewhere in the middle that suggests that one particular function is slow?
- Are some or most of the threads waiting on a backend service such as a database or web service? If so, can you figure out from the stacks if these are coming from a particular application function?
Monitor analysis is also important to find Java lock bottlenecks. Click the Monitor Detail or Compare Monitors buttons to explore the hierarchy of blocked threads. Remember that some blocked threads are normal, such as threads in a thread pool waiting for the next piece of work.
Thread States
On versions of IBM Java < Java 8, Java 7, Java 6.1, and Java 6 SR16 FP4, the javacore.txt thread dump shows threads which are effectively running (R) as waiting (CW) in TMDA. This is because the JVM uses a cooperative mechanism to try to quiesce running threads for the duration of the Javacore to reduce the chances of problems creating the javacore itself. TMDA naïvely reports the thread dump state without taking this into account. This is no longer an issue on the newer versions of IBM Java since the javacore.txt file reports the "actual" state (right before the javacore started).
Headless
To generate an HTML report in headless mode, pass an
OS-path-separated list of files (Unix=:;
Windows=;) followed by an HTML output file name; for
example:
java -jar jca*jar javacore1.txt:javacore2.txt:javacore3.txt tmdaheadless.html