Wireshark
Wireshark is an open source program to perform analysis on capture packets. Wireshark supports the packet formats of most operating systems.
Wireshark Recipe
- Check capture statistics
- Check for packet loss:
tcp.analysis.retransmission - Statistics } Protocol Hierarchy. Note percentages of packet types.
- Statistics } IO Graphs } Change "Y Axis" for "All Packets" to "Bytes". Note the utilization over time.
- Statistics } DNS } Service Stats } request-response time (msec) } Average / Max Val
- Statistics } Service Response Time } LDAP
Common Terms and Concepts
- A frame is basically a packet.
- A conversation is the set of packets between two endpoints.
- An endpoint is a logical endpoint of a protocol or network layer. For most purposes, focusing on an IP endpoint, i.e. an IP address.
- Following a TCP or HTTP stream means extracting the subset of a conversation, from the point of view of an application. For most purposes, focusing on a TCP stream, i.e. SYN } SYN/ACK } ACK } ... } FIN } FIN/ACK } ACK
- There is no way with a single capture to know how long it took for the packet to be transmitted. This requires a correlated packet capture on the other side where the packet was sent from/to.
- Timestamp of packet is:
- For an incoming packet, the timestamp is when the capture mechanism is handed the packet from its way from the NIC to the client. This would include any transition time over the NIC.
- For an outgoing packet, the timestamp is when the capture mechanism is handed the packet from its way from the client to the NIC, before it hits the NIC.
Time zones
By default, Wireshark shows relative timestamps (seconds since beginning of capture). It's often useful to show absolute timestamps to correlate to other logs. For the most common capture formats such as libpcap, the timestamps in the capture are stored as UTC. To show these UTC timestamps, click View } Time Display Format } UTC Date and Time of Day.
To show absolute timestamps in the local timezone of the system where
the packets were captured, if the local timezone of the system running
Wireshark does not match the capture system, then Wireshark must be
launched from a terminal after setting the appropriate TZ
environment variable value.
When launching Wireshark from POSIX systems such as Linux, this is just a matter of using the Olson time zone ID; for example:
TZ=Asia/Tokyo wiresharkOn Windows, the TZ environment variable does not support
Olson time zone database names and instead you must specify an absolute
time zone offset and this offset is the opposite of the colloquial
offset:
Take care in computing the sign of the time difference. Because the time difference is the offset from local time to UTC (rather than the reverse), its sign may be the opposite of what you might intuitively expect. For time zones ahead of UTC, the time difference is negative; for those behind UTC, the difference is positive.
For example, Tokyo's colloquial UTC offset is UTC+9; however, on
Windows, the TZ environment variable must be specified as
UTC-9:
> set TZ=JST-9
> "C:\Program Files\Wireshark\Wireshark.exe"
If the local timezone does not have daylight savings time, or you do not expect that the capture overlaps a daylight savings time transition, you may simply use the offset from UTC instead of looking up the three-letter time zone name; for example, for Tokyo:
> set TZ=UTC-9
> "C:\Program Files\Wireshark\Wireshark.exe"
If the local timezone has daylight savings time and the capture
overlaps a daylight savings time transition, then the daylight savings
time three-letter code should be appended. For example, for
America/New_York:
> set TZ=EST5EDT
> "C:\Program Files\Wireshark\Wireshark.exe"
After launching Wireshark with the proper TZ envar,
click View } Time Display Format } Date and Time of Day to see the
timestamp in the local timezone of the capture system.
Capture Statistics
Statistics } Capture File Properties:
- Review the times (
First packetandLast packet) and length of the packet capture (Elapsed) to see if it's relevant to the issue and/or representative. - Review the number of packets with
Packets. - Review the average throughput with
Average bytes/s. - Review the
Dropped Packetsvalue, if any.
Example:
First packet: 2020-08-11 19:47:58
Last packet: 2020-08-11 19:51:44
Elapsed: 00:03:45

[...]

Packets: 5693
Time span, s: 225.694
Average pps: 25.2
Average packet size, B: 538
Bytes: 3064080
Average bytes/s: 13 k
Average bits/s: 108 k
In addition, review Statistics } Summary
Packet Loss
In general, TCP retransmissions indicate packet loss; however, Wireshark must infer retransmissions and there may be cases of "benign" retransmissions (e.g. some cooked captures). This is why Wireshark reports TCP retransmissions as "suspected". The only way to know for sure if there is packet loss is to capture network traces on two sides of a conversation and compare TCP sequence numbers on each stream.
With that said, you may guess that there may be packet loss with the following technique:
- Find TCP retransmissions:
- Analyze } Expert Information. If you want to check for a particular
source/destination, apply that display filter first (e.g.
ip.addr == 10.20.30.100) and then checkLimit to Display filterin theExpert Informationdialog. Review the count ofNote: This frame is a (suspected) retransmission(separately, considerACKed Lost Packet,Previous Segment LostandOut of Order). tcp.analysis.retransmissionfilter. If you want to check for a particular source/destination, add those filters; for example,ip.addr == 10.20.30.100 && tcp.analysis.retransmission- Some versions of Wireshark show a
Droppedpacket count in the bottom of the window next to the Packet/Display counts.
- Analyze } Expert Information. If you want to check for a particular
source/destination, apply that display filter first (e.g.
- Take the count of TCP retransmissions and divide by the total packet
count (if using a display filter, divide by the displayed packet count).
The total number of packets and total number of filtered packets is
shown at the bottom of Wireshark:
Packets: X * Displayed: Y (Z%).
TCP ZeroWindow
The TCP Zero Window warning means that the receiver is telling the sender to pause sending more data:
Set when the receive window size is zero and none of SYN, FIN, or RST are set.
The window field in each TCP header advertises the amount of data a receiver can accept. If the receiver can’t accept any more data it will set the window value to zero, which tells the sender to pause its transmission. In some specific cases this is normal — for example, a printer might use a zero window to pause the transmission of a print job while it loads or reverses a sheet of paper. However, in most cases this indicates a performance or capacity problem on the receiving end. It might take a long time (sometimes several minutes) to resume a paused connection, even if the underlying condition that caused the zero window clears up quickly.
TCP Window Full
The TCP Window Full warning means:
Set when the segment size is non-zero, we know the window size in the reverse direction, and our segment size exceeds the window size in the reverse direction.
The TCP Window Full message is shown on the sender's packet when the amount of data sent is equal to the previously advertised receive window of the receiver. This message may be completely normal.
TCP Streams
Within each loaded capture, Wireshark generates a unique identifier
for each TCP stream. A TCP stream uniquely identifies a particular
socket through the four-tuple: (Source IP, Source Port, Destination IP,
Destination Port). This is visible in the packet details view under
Transmission Control Protocol } [Stream Index: X].
To filter on a particular stream, use the filter
tcp.stream == X or right click on a packet and select
Follow } TCP Stream.
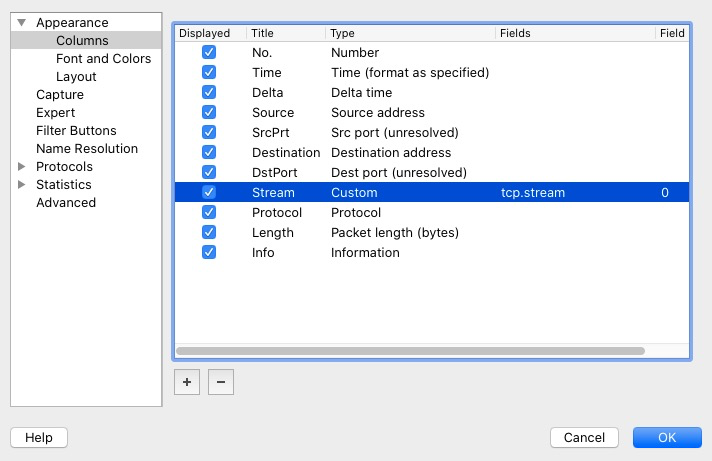
It may also be useful to add tcp.stream as a custom
column to quickly differentiate different conversations:
Useful Filters
- An IP address is either the source or the destination:
ip.addr == 10.20.30.100 - A port is either the source or the destination:
tcp.port == 443 - First part of the TCP handhsake (SYN) (note that these could be
retransmitted!):
tcp.connection.syn - Second part of the TCP handhsake (SYN/ACK) (note that these could be
retransmitted!):
tcp.connection.synack - Final part of a successful TCP handhsake (ACK) (assuming the default
of relative
sequence numbers) (note that these could be retransmitted!):
tcp.seq == 1 && tcp.len == 0 && tcp.flags.fin != 1 && tcp.flags.reset != 1 - TCP handshake SYN components (assuming the default of relative
sequence numbers) (note that these could be retransmitted!):
tcp.flags.syn == 1 || (tcp.seq == 1 && tcp.ack == 1 && tcp.len == 0 && tcp.flags.fin != 1) - TCP RST packets may be a sign of a problem or they may be normal.
Some applications use a RST packet for normal socket closure instead of
a full-duplex FIN exchange.
tcp.connection.rst
Find SYNs without SYN/ACKs
To find streams that failed to establish a connection:
- Filter to
tcp.flags.syn == 1 - Click Statistics } Conversations
- Select the
TCPtab - Check
Limit to display filter - Conversations with outgoing SYNs but no incoming SYNs may be suspects (except for those at the end of the capture). Conversations with greater than 1 SYN may also be suspects of retransmissions during connect.
Analyzing Sequence Numbers
For a particular stream, the
relative sequence number (tcp.seq) on a packet represents
how many bytes of TCP data have been sent since the start of the socket.
The relative next sequence number (tcp.nxtseq) is the
expected relative sequence number of the next outbound packet which is
the current sequence number plus the current TCP payload size. This is
useful to know what to expect as the receiver's acknowledgment number
(discussed below).
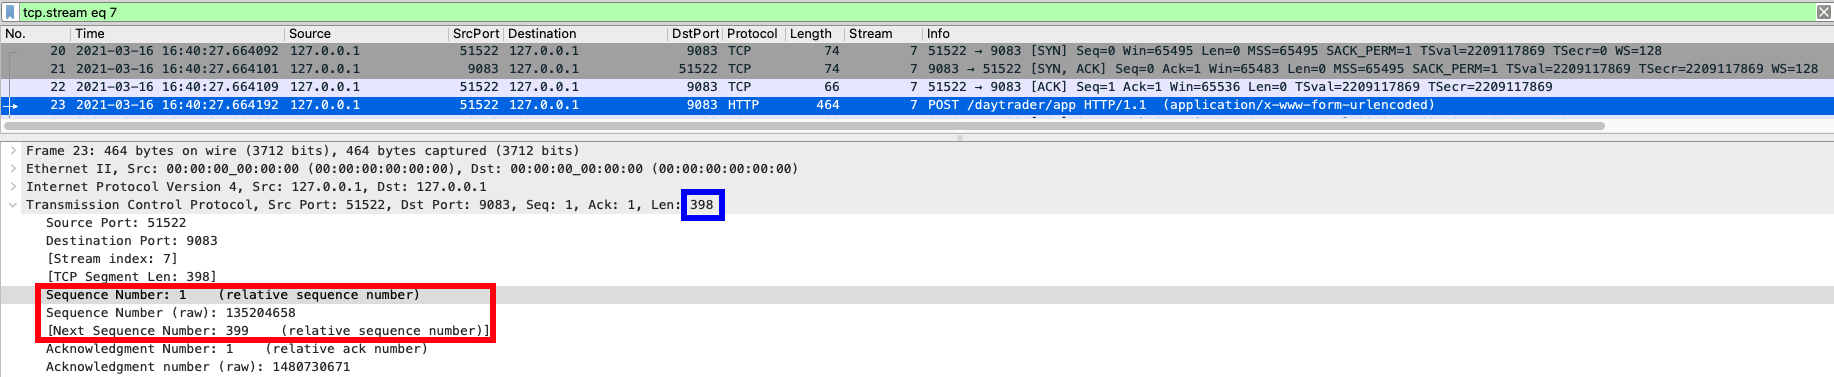
In the following example, frame 23 is selected which is the first packet of an outbound HTTP request. The current relative sequence number is 1 because the socket was just established. The relative next sequence number is 399 because it will be 1 + 398 (the TCP payload size highlighted in blue).
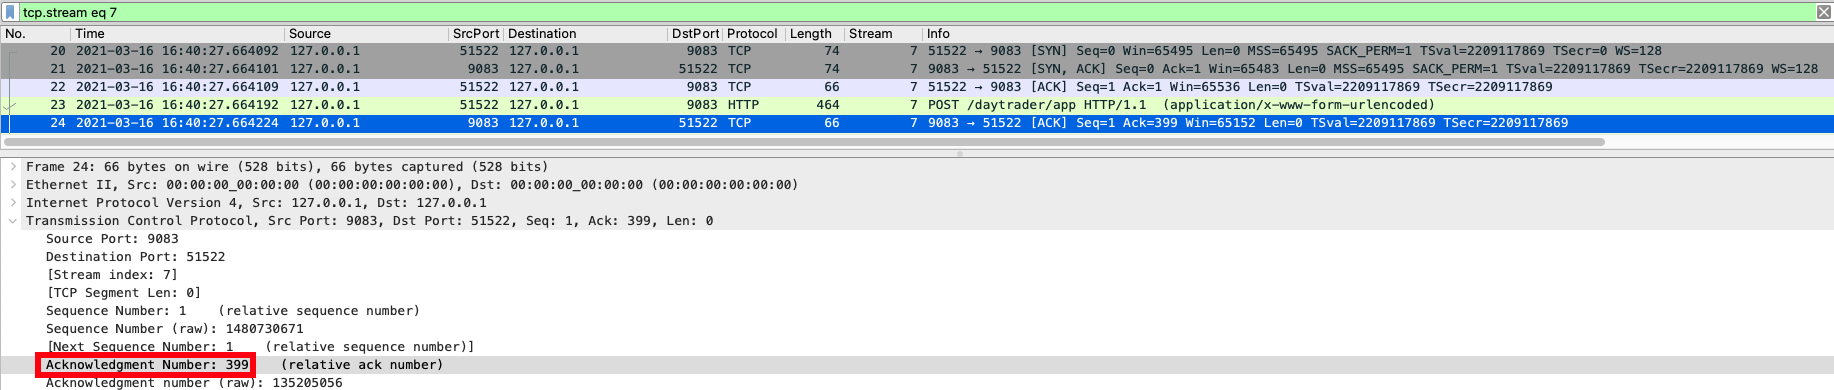
The relative acknowledgment number (tcp.ack) represents
how many bytes have been successfully received. In the same example
stream, the ACK packet (frame 24) that's acknowledging receiving the
HTTP request has an acknowledgment number of 399 which matches the
relative next sequence number from above:
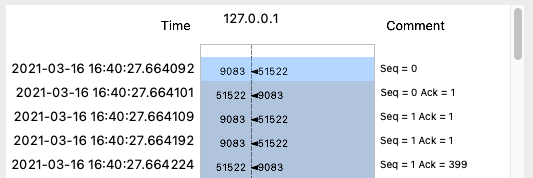
To visualize this back-and-forth, filter to a stream (e.g.
tcp.stream == 7 as in the example above), click Statistics
} Flow Graph, check "Limit to display filter", and change "Flow type" to
"TCP Flows":
Time Sequence Graph (tcptrace)
A Time Sequence Graph visualizes a TCP stream over time in one
direction. Select a packet } Wireshark Menu } Statistics } TCP Stream
Graphs } Time Sequence (tcptrace). Click Switch Direction
to change directions. The sequence number represents total bytes sent so
this is a useful way to visualize how data is sent over a stream:
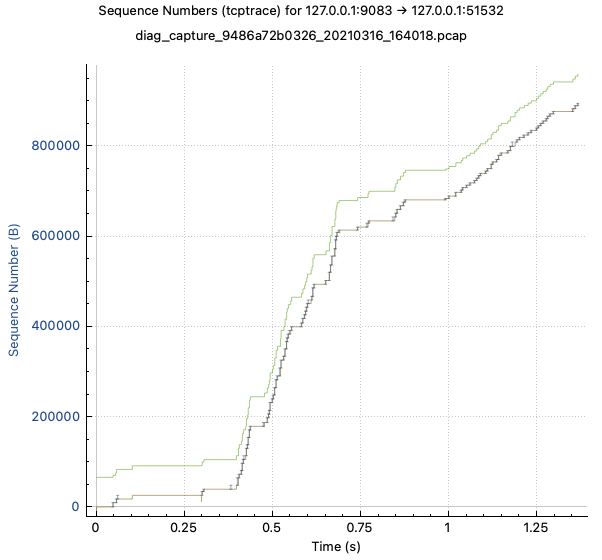
The slope of the line is network throughput/bandwidth. The vertical I-beams show bytes per packet. The plot below the I-beams are the ACKs. The top plot shows the client's receive window. If there is a significant difference between plots, there may be an issue in the sending side such as an application send bottleneck or congestion algorithm throttling.
TLS Encrypted Alert
A TLS Encrypted Alert indicates a normal closure or an error:
The "close_notify" alert is used to indicate orderly closure of one direction of the connection. Upon receiving such an alert, the TLS implementation SHOULD indicate end-of-data to the application.
Error alerts indicate abortive closure of the connection (see Section 6.2).
The type and details of the alert are encrypted. If a TLS Encrypted Alert is followed by a FIN, then it is likely a normal close_notify.
Visualize TCP Response Times
There is no concept of a TCP response time. A TCP stream has two
pipes and they act independently. Some layers above TCP, such as HTTP,
do have the concept of requests and responses and thus provide fields
like http.time
which can help understand response times. Other protocols provide
filters under the Service
Response Time dialog.
Nevertheless, if your protocol does have the concept of requests and
responses but does not have a response time field (or you can't see it
because of encryption), you can approximate response times by looking at
tcp.time_delta
which is the "Time since previous frame in this TCP stream". Be careful
though when interpreting this:
- A request may be followed by an ACK-only packet before the response,
so you cannot assume that
tcp.time_deltais roughly equivalent to "time until first byte of the response". The probability of this increases with longer response times. - A request may be chunked into multiple frames in which case the
tcp.time_deltaof the response is only the time since the last frame, not necessarily since the start of the request. - A response may be chunked into multiple frames, so if you are filtering to just a response port to approximate only looking at potential response times, you may also see the time between chunks. (Relatedly, the client may be sending ACK packets between chunks.)
- If a socket is re-used (e.g. HTTP keepalive), then there may be
large
tcp.time_deltavalues which are actually idle time between requests.
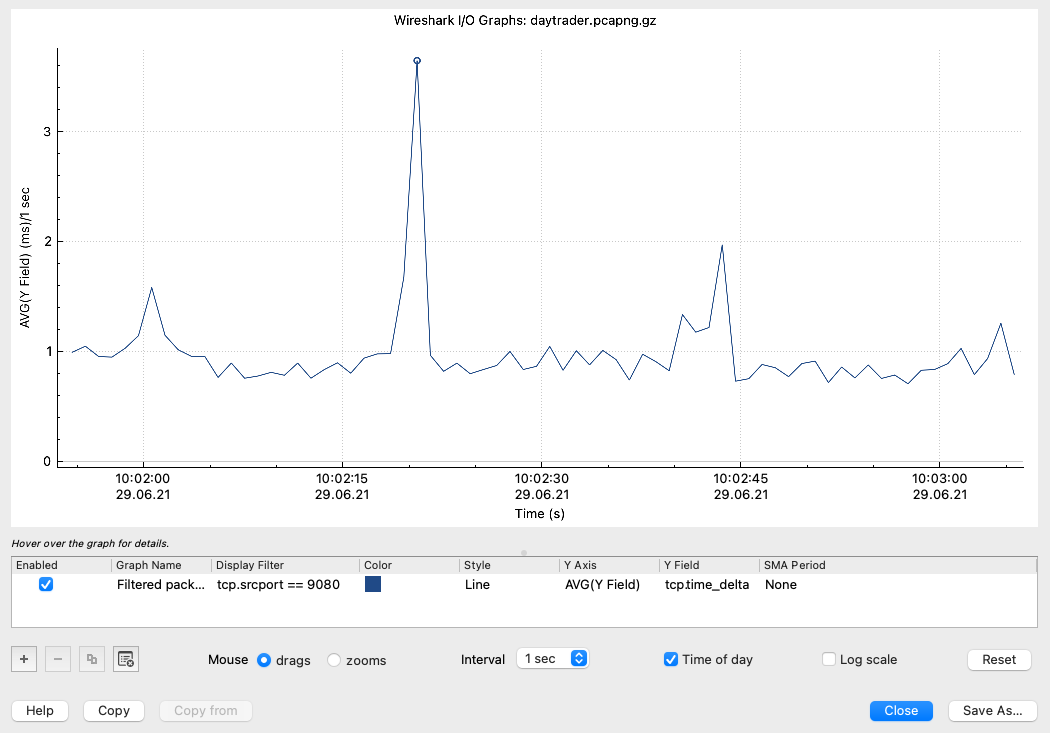
With those caveats in mind, you may graph these "potential response times":
- Filter to the conversations of interest. Approximating "potential
response times" may be best done by filtering to the source port of the
server (e.g.
tcp.srcport == 80) and maybe remove handshakes, etc. - Statistics } I/O Graph
- If it's a large capture, wait for the initial load to complete (there's a small Loading progress bar in the bottom right).
- Delete the
All PacketsandTCP Errorsrows by selecting them and clicking the minus button. - In the
Filtered Packetsrow, change theY Axiscolumn toAVG(Y Field)and theY Fieldcolumn totcp.time_delta - If it's a large capture, wait for the load to complete.
- Note that the y-axis units (e.g. us, ms, s, etc.) will change based on the data.
HTTP Streams
HTTP/1.0 and HTTP/1.1 streams provide filters through http.
In particular, http.time provides the HTTP response time.
HTTP/2.0 provides filters through http2
and HTTP/3.0 provides filters through http3
although, as of this writing, neither have a time
field.
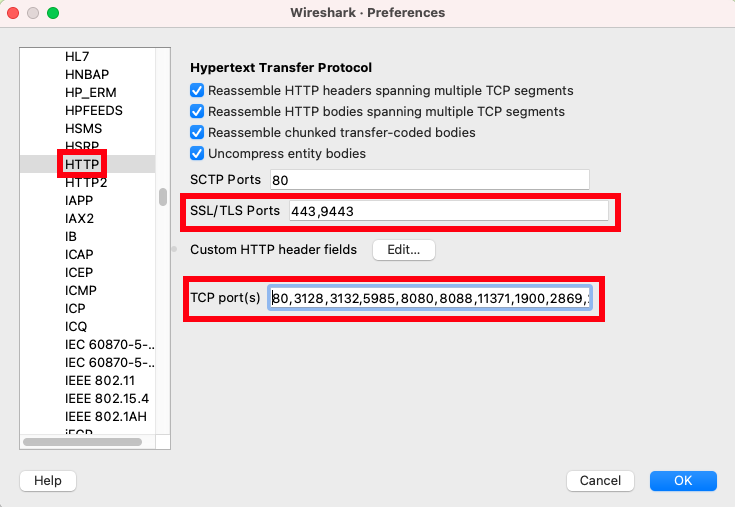
For HTTP/1.0 and HTTP/1.1, the frames are only dissected as such if traffic is non-TLS (or TLS traffic is decrypted) and the port is configured in the HTTP protocol:
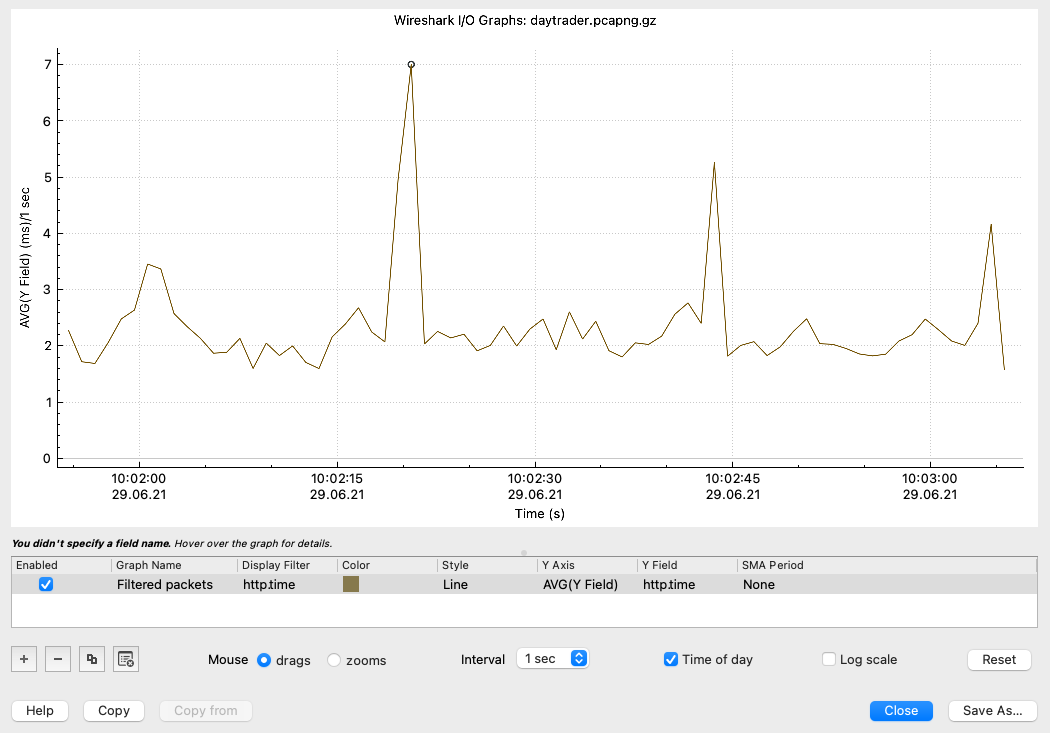
Visualize HTTP Response Times
- Filter to
http.timeto ensure HTTP dissection is working (see details in the HTTP Streams section). - Statistics } I/O Graph
- If it's a large capture, wait for the initial load to complete (there's a small Loading progress bar in the bottom right).
- Delete the
All PacketsandTCP Errorsrows by selecting them and clicking the minus button. - In the
Filtered Packetsrow, change theY Axiscolumn toAVG(Y Field)and theY Fieldcolumn tohttp.time - If it's a large capture, wait for the load to complete.
- Note that the y-axis units (e.g. us, ms, s, etc.) will change based on the data.
Finding problems or delays in the network
- Use filters like
tcp.time_delta > 1where the number is in seconds although note there may be normal delays for idle, keepalive sockets, for example. - Ensure all suspect servers have synchronized clocks (NTP, etc.).
- Run a few minutes of pings and note the average latency between servers.
- Capture network trace from both servers. The network trace should include both incoming and outgoing packets, to and from the other servers. If they are unidirectional, it turns out merging network traces from two different servers is very dangerous. Basically, a lot of information such as DUP ACKs, etc., is inferred from the sequence of packets, and combining multiple systems' traces can have unintended consequences. In my case, it actually generated TCP retransmits when they did not exist.
- In Wireshark
- Select View } Time/Display Format } Date and Time of Day
- Also, add a column for "Delta time (Displayed)"
- Open the first capture. Basically, we will use the
frame.time_delta_displayedcolumn we added above to find the delays. However, the column is non-sensical with interleaved TCP streams. So what you have to do is basically filter by each stream (using either "Follow TCP stream" on a suspect packet, or finding all unique src/destination port combos, etc.). - Once you have a single TCP stream, then the
frame.time_delta_displayedis the time between packets on that stream. Sort by this column, descending. - If there are any big delays (larger than the max latency), then note a few of those frames. Re-sort by frame number and see what was happening right before that frame.
- Note that a TCP "stream" within a TCP "conversation" is just the unique combination of Source IP, Source Port, Destination IP, and Destination Port. TCP is multiplexing so multiple sockets can be opened between two IPs. What this also means is that if the communication stream is persistent (e.g. connection pooling), then the stream is never torn down (FIN } FIN/ACK } ACK), so there may be large gaps between packets on that stream which may just be the time between two units of work on that stream.
- Note any errors within Wireshark. Research each error carefully as some may be benign (e.g. TCP Checksum Offloading).
- Do the same thing on the other end and compare the time stamps. Remember that the timestamps in a packet capture are the time at which the capturer is handed the packet. For an outgoing packet, this occurs before the packet hits the NIC. For an incoming packet, this occurs after the packet has been processed by the NIC and handed off to the kernel.
- Any time difference between when server A receives the response from server B (from server A's packet capture), and when server B sends the pack to server B (from server B's packet capture) would be the latency. Any other time would mean the time taken to process on server B.
- Also, to find any clock difference, pick any TCP conversation handshake. The SYN/ACK must come after the SYN and before the ACK, so you can shift one packet capture or the other (using editcap -t) to line up with the other. For example, when server B is sending the SYN/ACK and it is behind the SYN, use the following to time shift server B's packet capture: (((ACK - SYN) / 2) + SYN) - (SYNACK)
Finding gaps within an IP conversation in a network capture
- https://www.wireshark.org/docs/dfref/f/frame.html
frame.time_delta} Time delta between the current packet and the previous packet in the capture (regardless of any display filters).frame.time_delta_displayed} Time delta between the current packet and the previous packet in the current display.frame.time_relative} Time delta between the current packet and the first packet in the capture (regardless of any display filters), or if there is a time reference, that reference time.
- To find gaps within an IP conversation:
- First add
frame.time_delta_displayedcolumn: Edit } Preferences } User Interface } Columns } Add } Field Type = Delta Time Displayed. - To find gaps, apply some logical grouping to the packets so that they are all related, e.g. right click on the SYN of the incoming/outgoing packet and click "Follow TCP Stream." Close the window that pops up and now Wireshark is filtered to that particular tcp stream (e.g. "tcp.stream eq 5"). (This could also be done just with the conversation, not just the stream).
- The Delta Time Displayed is the delta time between that packet and the previous packet in that stream -- i.e. the gap between packets in that conversation.
- Another interesting thing to do is to colorize large differences in
frame.time_delta_displayed: View } Coloring Rules } New } Filter:
frame.
time_delta_displayed >= .1
- First add
- The following tshark Lua script searches network packet captures for anomalous TCP delays in handshakes (long response time to a SYN, response not a SYN/ACK, missing response to a SYN, duplicate SYN) and delays between packets after a handshake. The latter is disabled by default because connections are often re-used, so there may be legitimate delays between the end of one part of a conversation and the beginning of another, so that requires more delicate analysis.
TCP Checksum Offloading Errors
TCP Checksum Offloading: Checksum offloading is when the OS network driver does not perform a checksum, but instead fills the checksum with 0 or garbage, and then "offloads" the checksum processing to the physical NIC card which then itself does the checksum and puts it in the packet before sending it off. Thus a capture will get a garbage checksum. Checksum offloading errors within Wireshark are only benign if the packets are outgoing. Two ways to avoid are: 1) turn off the OS checksum offloading (not always possible or simple, and could significantly impact performance), or 2) turn off checksum validation in Wireshark. For 2: Edit } Preferences } Protocols } TCP } Uncheck "Check the validity of the TCP checksum when possible."
- https://www.wireshark.org/docs/wsug_html_chunked/ChAdvChecksums.html
- https://www.wireshark.org/faq.html#q11.1
- https://wiki.wireshark.org/TCP_Checksum_Verification
- https://wiki.wireshark.org/TCP_Reassembly
Wireshark Automation
Broadly, there are two common ways to automate Wireshark analysis:
- tshark with a Lua script
- tshark with
-T fieldsand then pipe that to awk, etc.
tshark
Example usage:
TCP packets:
TZ=UTC tshark -t ud -T fields -e frame.number -e _ws.col.Time -e ip.src -e tcp.srcport -e ip.dst -e tcp.dstport -e tcp.stream -e frame.len -e _ws.col.Protocol -e _ws.col.Info -r PCAP_FILEApply a filter using -Y
TCP Handshakes
TZ=UTC tshark -t ud -T fields -e frame.number -e _ws.col.Time -e ip.src -e tcp.srcport -e ip.dst -e tcp.dstport -e tcp.stream -e frame.len -e _ws.col.Protocol -e _ws.col.Info -r PCAP_FILE -Y "tcp.flags.syn == 1"Retransmitted TCP handshakes:
TZ=UTC tshark -t ud -T fields -e frame.number -e _ws.col.Time -e ip.src -e tcp.srcport -e ip.dst -e tcp.dstport -e tcp.stream -e frame.len -e _ws.col.Protocol -e _ws.col.Info -r PCAP_FILE -Y "tcp.flags.syn == 1 && tcp.analysis.retransmission"Search for raw bytes
For example, let's say the Java Class Libraries are used to send an
encrypted HTTP POST as seen in -Djavax.net.debug=all
output:
[5/8/24 1:04:09:851 UTC] 000000ae id=00000000 SystemOut                                                    O javax.net.ssl|FINE|AE|Default Executor-thread-110|2024-05-08 01:04:09.840 UTC|Thread.java:1178|Plaintext before ENCRYPTION (
  0000: 50 4f 53 54 20 2f 69 6e  73 74 61 6e 63 65 73 2f  POST..instances.
  [...]
[5/8/24 1:04:09:886 UTC] 000000ae id=00000000 SystemOut                                                    O javax.net.ssl|FINE|AE|Default Executor-thread-110|2024-05-08 01:04:09.875 UTC|Thread.java:1178|Raw write (
  0000: 17 03 03 09 31 00 00 00  00 00 00 00 01 9f 70 9e  ....1.........p.
  [...]
Then we can search for the first bytes of the
Raw write:
$ TZ=UTC tshark -t ud -T fields -e frame.number -e _ws.col.Time -e ip.src -e tcp.srcport -e ip.dst -e tcp.dstport -e tcp.stream -e frame.len -e _ws.col.Protocol -e _ws.col.Info -r PCAP_FILE -Y "frame contains 170303093100000000000000019f709e"
9714    2024-05-08 01:04:09.764567  192.168.1.161   59969   173.223.234.52  443 52  1514    TCP [TCP segment of a reassembled PDU]
DNS response times greater than 10ms
TZ=UTC tshark -t ud -T fields -e frame.number -e _ws.col.Time -e ip.src -e ip.dst -e frame.len -e dns.time -e _ws.col.Protocol -e _ws.col.Info -r PCAP_FILE -Y "dns.time >= 0.01"capinfos
To get basic statistics for a pcap file:
$ TZ=UTC capinfos *pcap
File name:           [...].pcap
File type:           Wireshark/tcpdump/... - pcap
File encapsulation:  Linux cooked-mode capture
File timestamp precision:  microseconds (6)
Packet size limit:   file hdr: 262144 bytes
Number of packets:   1,326 k
File size:           763 MB
Data size:           742 MB
Capture duration:    3504.180516 seconds
First packet time:   2024-01-30 11:42:32.725851
Last packet time:    2024-01-30 12:40:56.906367
Data byte rate:      211 kBps
Data bit rate:       1,694 kbps
Average packet size: 559.78 bytes
Average packet rate: 378 packets/s
SHA256:              [...]
RIPEMD160:           [...]
SHA1:                [...]
Strict time order:   False
Number of interfaces in file: 1
Interface #0 info:
                     Encapsulation = Linux cooked-mode capture (25 - linux-sll)
                     Capture length = 262144
                     Time precision = microseconds (6)
                     Time ticks per second = 1000000
                     Number of stat entries = 0
                     Number of packets = 1326022
editcap
editcap: https://www.wireshark.org/docs/man-pages/editcap.html
Split packet capture by time
Example of 1 minute per file:
editcap -i 60 input.pcap output.pcapLua Scripts
tshark supports Lua scripts to perform automated analysis.
$ cat file.lua
print("hello world!")
$ tshark -X lua_script:file.lua
Example scripts:
Decrypt SSL/TLS Traffic
Using a Log File with Per-Session Secrets
Decrypting Java TLS Traffic
For Wireshark to decrypt TLS communications in a network trace for
any modern TLS cipher suite (i.e. ephemeral key exchange/non-RSA), it
needs either the client or server to log per-session secret keys to a
de-facto standard NSS
Key Log file which is then configured in
Wireshark or embedded in the network capture with
editcap --inject-secrets. This NSS Key Log file output is
implemented in various programs and libraries most often by launching
the executable with the environment variable SSLKEYLOGFILE
set to a file path. Programs and libraries offering support include curl,
OpenSSL, libressl, BoringSSL, GnuTLS, wolfSSL, some builds of
Firefox, some builds of Chrome, and others.
In older versions of Java, -Djavax.net.debug=ssl,keygen
trace would print the client nonce and master secret which could be
converted to the NSS Key Log file format. However, newer versions of
Java seem to have eliminated this as part of the transition to TLS1.3
where the entire javax.net.debug logging code was
overhauled.
Amazon submitted a patch to add NSS Key
Log file support for the request for
enhancement with a -Djavax.net.debug.keylog option but
this was denied because a compatibility and
specification request (CSR) was required, there were some
suggestions of architecting the solution to make it more generic
(arguably, over-architecting for a purely diagnostic function), and
there were also some
concerns
about security although these do
not make much sense because -Djavax.net.debug already
supports logging fully decrypted data. Therefore, the pull request
languished and, as it stands in 2024, although
-Djavax.net.debug can write fully decrypted data, there are
no capabilities in Java to print the required secrets for decryption of
network traces for modern TLS cipher suites.
There are some open source Java agents that may be used at startup or
attached dynamically to add such output such as https://github.com/neykov/extract-tls-secrets
(Apache 2.0 license). Alternatively, if the other half of the
communication is non-Java based (e.g. a client web browser), then it
might be possible to enable SSLKEYLOGFILE there or simply
use a browser's network console to capture traffic and then export to a
HAR file.
Another approach is to use -Djavax.net.debug=all and
then find the raw encrypted writes in the resulting log file and search
for the raw bytes in the network capture and correlate by time.
Using SSLKEYLOGFILE
Some builds of programs and libraries such as Firefox, Chrome,
curl and others support the SSLKEYLOGFILE
environment variable which is a path to a log file that is created by
said programs with per-session secret information on each SSL/TLS
transaction that can be used by Wireshark to decrypt traffic.
- When using a browser, ensure that all instances of the browser program are first closed.
- Open a terminal or command prompt and set
SSLKEYLOGFILEto some file. For example, Linux/macOS:
Or Windows:export SSLKEYLOGFILE=/tmp/tlssecrets.logset SSLKEYLOGFILE=C:\tlssecrets.log - Launch the browser from the terminal or command prompt. For example,
Linux:
macOS:firefox
Windows:open -a Firefox"C:\Program Files\Mozilla Firefox\firefox.exe" - Start the network trace
- Navigate to the server to reproduce the problem.
- If sending to support, send both the network trace output and the
SSLKEYLOGFILE file. Optionally, you may embed the SSLKEYLOGFILE file
into the capture with:
editcap --inject-secrets tls,tlssecrets.log original.pcap original_with_secrets.pcapng
To analyze and decrypt the network trace:
- If the SSLKEYLOGFILE has not been embedded, in Wireshark, set the path in Preferences } Protocols } TLS } (Pre)-Master-Secret log filename
Ports and Heuristics
In general, Wireshark uses two mechanisms to decide whether a protocol dissector should dissect packets: ports and heuristics.
Ports are usually specified on a per-protocol basis under Edit } Preferences } Protocols. For example, if HTTP traffic is running on a "non-standard" port, you may add the additional ports to the HTTP protocol.
Heuristics are optionally implemented by protocols to guess that a stream is of the protocol's type. Some protocols do not expose an option to disable their heuristic, in which case the protocol may be disabled under Analyze } Enabled Protocols.
Working with Wireshark Source
Launching Wireshark in GDB:
$ libtool --mode=execute gdb -ex=run -ex=quit ./wireshark
$ libtool --mode=execute gdb -ex=run -ex=quit --args ./wireshark file.pcap
$ libtool --mode=execute gdb -ex=run -ex=quit --args ./wireshark -R 'tcp.stream == 3' file.pcap
Abort on a dissector bug:
export WIRESHARK_ABORT_ON_DISSECTOR_BUG=1Custom Dissector
For a template, see doc/packet-PROTOABBREV.c. To compile
into Wireshark, add the file into epan/dissectors, and add
its name to DISSECTOR_SRC in
epan/dissectors/Makefile.common. See
doc/README.developer and
doc/README.dissector.