macOS
macOS Recipe
- CPU core(s) should not be consistently saturated.
- Generally, physical memory should never be saturated and the operating system should not page memory out to disk.
- Input/Output interfaces such as network cards and disks should not be saturated, and should not have poor response times.
- Operating system level statistics and optionally process level statistics should be periodically monitored and saved for historical analysis.
- Review operating system logs for any errors, warnings, or high volumes of messages.
- Review snapshots of process activity, and for the largest users of resources, review per thread activity.
- If there is sufficient network capacity for the additional packets, consider reducing the default TCP keepalive timer (tcp_keepalive_time) from 2 hours to a value less than intermediate device idle timeouts (e.g. firewalls).
- Test disabling delayed ACKs
Also review the general topics in the Operating Systems chapter.
General
Overview of performance analysis tools: https://developer.apple.com/library/content/documentation/Performance/Conceptual/PerformanceOverview/PerformanceTools/PerformanceTools.html#//apple_ref/doc/uid/TP40001410-CH205-SW2
System Information
Run sysctl -a for general information and settings.
Software information:
% system_profiler SPSoftwareDataType
Software:

    System Software Overview:

      System Version: macOS 12.0.1 (21A559)
      Kernel Version: Darwin 21.1.0
      Boot Volume: MainDisk
      Boot Mode: Normal
      Computer Name: [...]
      User Name: [...]
      Secure Virtual Memory: Enabled
      System Integrity Protection: Disabled
      Time since boot: 40 minutes
Hardware information:
% system_profiler SPHardwareDataType
Hardware:

    Hardware Overview:

      Model Name: MacBook Pro
      Model Identifier: MacBookPro15,1
      Processor Name: 6-Core Intel Core i7
      Processor Speed: 2.6 GHz
      Number of Processors: 1
      Total Number of Cores: 6
      L2 Cache (per Core): 256 KB
      L3 Cache: 9 MB
      Hyper-Threading Technology: Enabled
      Memory: 16 GB
      System Firmware Version: 1554.140.20.0.0 (iBridge: 18.16.14759.0.1,0)
      Serial Number (system): ...
      Hardware UUID: ...
      Provisioning UDID: ...
      Activation Lock Status: Enabled
Combing the commands and removing potentially sensitive information:
system_profiler SPSoftwareDataType SPHardwareDataType | grep -v -e UUID -e UDID -e 'User Name' -e 'Computer Name' -e Serial
log
The log command prints log entries to the terminal. The underlying
files are in /var/log and ~/Library/Logs/ and
~/Library/Logs/DiagnosticReports
log showto print the logs.log streamto tail the logs.- Stream a particular process example:
log stream --predicate '(process == "WindowServer")' --debug
- Stream a particular process example:
sudo log collectto create a logarchive file. This file may be opened inConsole(see below).% sudo log collect Password: Archive successfully written to /Users/kevinaccount/system_logs.logarchive
Common things to check
grep crash /var/log/system.log
Console
The Console
app shows system logs and events. Click Spotlight Search, type
Console and double click. The underlying files are in
/var/log and ~/Library/Logs/
- Click thew Now button to pause the live view.
- If XCode Instruments is installed, additional pre-defined instrumentation profiles are available under Console } Services
- Click Action } Include Info/Debug Messages for additional debugging
- Open a logarchive file (see above) with File } Open...
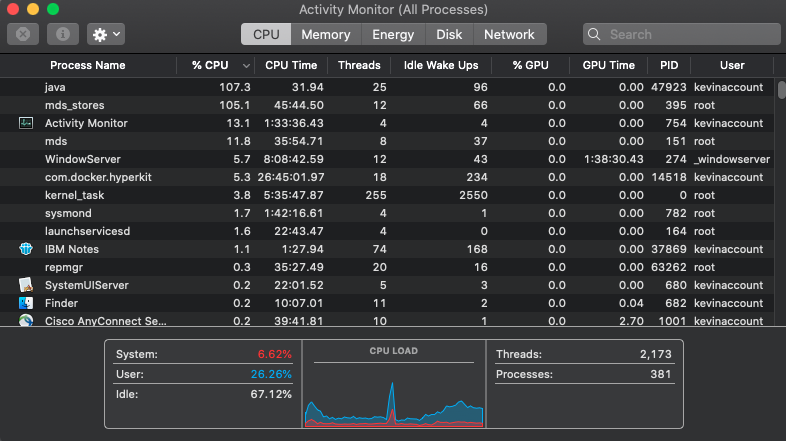
Activity Monitor
Activity Monitor is a graphical tool to look at CPU, Memory, and more: https://support.apple.com/en-us/HT201464
sysdiagnose
sysdiagnose captures various system logs and information:
- Open the Activity Monitor application (e.g. Spotlight Search } Activity Monitor, or Finder } Applications } Activity Monitor)
- Click View } Run System Diagnostics...
- Click OK
- When complete, a Finder window opens pointing to a
sysdiagnose_${...}folder andsysdiagnose_${...}.tar.gzfile.
Alternatively, from the Terminal, run
sudo sysdiagnose.
File highlights:
sysdiagnose.logfor macOS version, e.g.Mac OS X 10.15.6 (Build 19G73)system_logs.logarchivefor a full logarchive (see above)ps.txt,ps_thread.txt, andtop.txtfor process and thread activity statisticsspindump.txtfor process CPU samplingfs_usage.txtfor I/O activity
spindump
Spindump captures CPU stack samples for about 20 seconds:
- Open the Activity Monitor application (e.g. Spotlight Search } Activity Monitor, or Finder } Applications } Activity Monitor)
- Click View } Run Spindump
- When complete, a window opens with the results
- The
CPU Time:shows how much CPU time was consumed by each process during the spindump. Review the subsequent stack samples for high CPU time consumers.
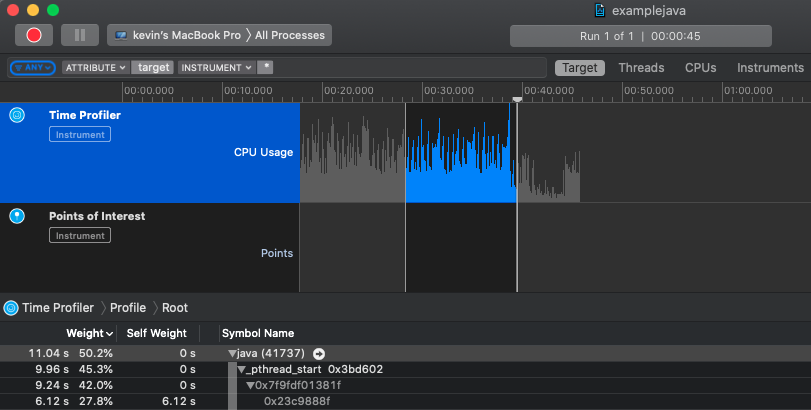
Instruments
Instruments is bundled with XCode and provides functions such as a CPU sampling profiler: https://help.apple.com/instruments/mac/current/#/dev7b09c84f5
Capture System-wide CPU Sampling Profiler Data
- Install XCode
- After installing, click Spotlight Search, type Instruments and double click.
- Select the
Time Profilertemplate and clickChoose. - In the top left, click the record button.
- Reproduce the problem.
- In the top left, click the stop button.
- Click File } Save As to export the profile. A
${name}.tracefile is exported.
Analyze CPU Sampling Profiler Data
- Click View } Utilities } Show Run Info to see the absolute wall clock timestamp of the start of the profile.
- Select and drag to zoom in on a time period of interest.
- Filters at the top allow for quickly switching between thread/process views, per-process stacks, etc.
- In the stack view, when clicking on the right expand arrow, hold down ⌥ as you click to recursively expand the largest path automatically.
Memory
Roughly, "available" memory is Free + Inactive + Speculative (if Free has Speculative subtracted as vm_stat does) + File-backed pages
$ vm_stat | awk '/^Pages free/ {x+=$NF;} /^Pages inactive/ {x+=$NF;} /^Pages speculative/ {x+=$NF;} /^File-backed pages/ {x+=$NF;} END {freebytes=(x*4096); printf("%d approximate bytes free\n%.2f approximate GB free\n", freebytes, (freebytes/1024/1024/1024));}'
13006544896 approximate bytes free
12.11 approximate GB free
In Activity Monitor, Cached Files is defined as the following, and experiments show this is approximated by "File-backed pages" in vm_stat:
Cached Files: Memory that was recently used by apps and is now available for use by other apps. For example, if you've been using Mail and then quit Mail, the RAM that Mail was using becomes part of the memory used by cached files, which then becomes available to other apps. If you open Mail again before its cached-files memory is used (overwritten) by another app, Mail opens more quickly because that memory is quickly converted back to app memory without having to load its contents from your startup drive.
https://support.apple.com/en-us/HT201464#memory
Detailed memory statistics: https://developer.apple.com/library/content/documentation/Performance/Conceptual/ManagingMemory/Articles/VMPages.html#//apple_ref/doc/uid/20001985-CJBJFIDD
Kernel Memory
$ sudo zprint
                            elem         cur         max        cur         max         cur  alloc  alloc
zone name                   size        size        size      #elts       #elts       inuse   size  count
-------------------------------------------------------------------------------------------------------------
vm.permanent                   1         76K         76K      77824       77824       76486     4K   4096
[...]
                                                               kmod          vm        peak               cur
wired memory                                                     id         tag        size  waste       size
-------------------------------------------------------------------------------------------------------------
NDR_record                                                                   82                          816K
[...]
                                                                        largest        peak               cur
maps                                                           free        free        size              size
-------------------------------------------------------------------------------------------------------------
VM_KERN_COUNT_MANAGED                                                                               16113384K
VM_KERN_COUNT_MAP_KALLOC                                    481508K     460800K                       524288K
VM_KERN_COUNT_MAP_KERNEL                                 331566456K  264758024K                    538968056K
VM_KERN_COUNT_MAP_ZONE                                   133194176K   53549092K                    134217536K
VM_KERN_COUNT_WIRED                                                                                  2553936K
VM_KERN_COUNT_WIRED_BOOT                                                                              888096K
VM_KERN_COUNT_WIRED_MANAGED                                                                          2036552K
VM_KERN_COUNT_WIRED_STATIC_KERNELCACHE                                                                 18552K
[...]
                                                                                                          cur
zone views                                                                                              inuse
-------------------------------------------------------------------------------------------------------------
data.kalloc.16[raw]                                                                                      700K
[...]
Page Size
The size of a page on OS X is 4096 bytes.
Wired memory (also called resident memory) stores kernel code and data structures that must never be paged out to disk. Applications, frameworks, and other user-level software cannot allocate wired memory. However, they can affect how much wired memory exists at any time. For example, an application that creates threads and ports implicitly allocates wired memory for the required kernel resources that are associated with them. [...]
Wired memory pages are not immediately moved back to the free list when they become invalid. Instead they are "garbage collected" when the free-page count falls below the threshold that triggers page out events. [...]
The active list contains pages that are currently mapped into memory and have been recently accessed.
The inactive list contains pages that are currently resident in physical memory but have not been accessed recently. These pages contain valid data but may be removed from memory at any time.
The free list contains pages of physical memory that are not associated with any address space of VM object. These pages are available for immediate use by any process that needs them.
When the number of pages on the free list falls below a threshold (determined by the size of physical memory), the pager attempts to balance the queues. It does this by pulling pages from the inactive list. If a page has been accessed recently, it is reactivated and placed on the end of the active list. In OS X, if an inactive page contains data that has not been written to the backing store recently, its contents must be paged out to disk before it can be placed on the free list.
[O]n Mac OS X 10.5 we introduced a new, fifth category of memory, speculative memory, used to hold pages that have been read from disk speculatively.
https://lists.apple.com/archives/darwin-kernel/2008/Jun/msg00001.html
nmond
nmond is a fork of the AIX/Linux nmon tool: https://github.com/stollcri/nmond
Install:
git clone https://github.com/stollcri/nmond
cd nmond/nmond
make
sudo make install
Run:
NMOND=ctmdn nmondnmond does not support the headless logging features of the AIX/Linux nmon, so it is only useful for live monitoring.
Tips
In Finder's Open File dialog, type / (or Shift+Command+G) to open a dialog to paste a direct absolute path of a folder to open.
Network
Disable delayed ACKs: Add net.inet.tcp.delayed_ack=0 to
/etc/sysctl.conf and restart
File I/O
fs_usage
fs_usage traces filesystem syscalls: https://developer.apple.com/library/archive/documentation/Performance/Conceptual/FileSystem/Articles/FileSystemCalls.html#//apple_ref/doc/uid/20001989-97106
Start:
nohup sudo fs_usage -ew -f filesys > fsusage_$(hostname)_$(date +"%Y%m%d_%H%M%S_%N").txtStop:
Ctrl^CExample output:
TIMESTAMP         CALL      FILE DESCRIPTOR       BYTE COUNT  PATHNAME   TIME INTERVAL(W)   PROCESS NAME
07:41:30.599158   open      F=12 (_WC_T_______)               test.txt   0.000113           java.1454892
07:41:30.599161   fstat64   F=12                                         0.000002           java.1454892
07:41:30.599330   write     F=12                  B=0xc                  0.000043           java.1454892
07:41:30.599338   write     F=13                  B=0x171                0.000043           java.1454932
07:41:30.599566   close     F=12                                         0.000082           java.1454892
diskutil
List disks example:
$ diskutil list
/dev/disk0 (internal, physical):
   #:                       TYPE NAME                    SIZE       IDENTIFIER
   0:      GUID_partition_scheme                        *500.3 GB   disk0
   1:                        EFI EFI                     314.6 MB   disk0s1
   2:                 Apple_APFS Container disk1         500.0 GB   disk0s2

/dev/disk1 (synthesized):
   #:                       TYPE NAME                    SIZE       IDENTIFIER
   0:      APFS Container Scheme -                      +500.0 GB   disk1
                                 Physical Store disk0s2
   1:                APFS Volume Macintosh HD - Data     465.4 GB   disk1s1
   2:                APFS Volume Preboot                 78.7 MB    disk1s2
   3:                APFS Volume Recovery                528.9 MB   disk1s3
   4:                APFS Volume VM                      2.1 GB     disk1s4
   5:                APFS Volume Macintosh HD            11.4 GB    disk1s5

/dev/disk2 (external, physical):
   #:                       TYPE NAME                    SIZE       IDENTIFIER
   0:     FDisk_partition_scheme                        *30.8 GB    disk2
   1:             Windows_FAT_32 NO NAME                 30.8 GB    disk2s1
Unmount a disk example:
diskutil unmountDisk /dev/disk2Eject a disk example:
diskutil eject /dev/disk2mds_stores
The mds_stores process may use high CPU as part of file
indexing. If you do not need file indexing, disable it with:
sudo mdutil -a -i offTo show the indexing status:
% sudo mdutil -a -s
/:
    Indexing disabled.
/System/Volumes/Data:
    Indexing disabled.
To re-enable indexing:
sudo mdutil -a -i onIf you do need file indexing, use fs_usage to find which files are driving the indexing and consider excluding their parent directories: System Preferences } Spotlight } Privacy } Add a folder or disk to exclude