z/OS
z/OS Recipe
- CPU core(s) should not be consistently saturated.
- Generally, physical memory should never be saturated and the operating system should not page memory out to disk.
- Input/Output interfaces such as network cards and disks should not be saturated, and should not have poor response times.
- TCP/IP and network tuning, whilst sometimes complicated to investigate, may have dramatic effects on performance.
- Consider tuning TCP/IP network buffer sizes.
- Monitor TCP retransmissions
with
SEGMENTS RETRANSMITTEDin/D TCPIP,,N,STATS. Ideally, for LAN traffic, they should be 0. - Collect and archive various RMF/SMF records on 10 or 15 minute
intervals:
- SMF 30 records
- SMF 70-78 records
- SMF 113 subtype 1 (counters) records
- With recent versions of z/OS, Correlator SMF 98.1 records
- SMF 99 subtype 6 records
- If not active, activate HIS and collect hardware counters:
- Review
ps -p $PID -mandD OMVS,PID=$PIDoutput over time for processes of interest. - Operating system level statistics and optionally process level statistics should be periodically monitored and saved for historical analysis.
- Review system logs for any errors, warnings, or high volumes of messages.
- Review snapshots of process activity, and for the largest users of resources, review per thread activity.
- If the operating system is running in a virtualized guest, review the configuration and whether or not resource allotments are changing dynamically.
- Use the Workload Activity Report to review performance.
- If there is sufficient network capacity for the additional packets, consider reducing the default TCP keepalive timer (TCPCONFIG INTERVAL) from 2 hours to a value less than intermediate device idle timeouts (e.g. firewalls).
- Review
SYS1.PARMLIB(andSYS1.IPLPARMif used) - Test disabling delayed ACKs
Also review the general topics in the Operating Systems chapter.
Documentation
General
z/OS is normally accessed through 3270 clients, telnet, SSH, or FTP.
z/OS uses the EBCDIC character set by default instead of ASCII/UTF;
however, some files produced by Java are written in ASCII or UTF. These
can be converted using the iconv USS command or downloaded
through FTP in BINARY mode to an ASCII/UTF based computer.
Unix System Services (USS) and OMVS
ps
ps may be used to display address space information and
CPU utilization; for example, to list all processes and accumulated CPU
time:
By Process
ps -A -o xasid,jobname,pid,ppid,thdcnt,vsz,vsz64,vszlmt64,time,argsExample output:
ASID JOBNAME         PID       PPID THCNT     VSZ      VSZ64   VSZLMT64        TIME COMMAND
 160 SSHD7      16916941   67248492     1   16192   13631488     16383P    00:00:00 /usr/sbin/sshd -R
 175 KGRIGOR3   84025829   33693995    29  217448 1527775232     20480M    00:00:31 java -Xmx1g ...
  fb KGRIGOR8   50471447     139700     1     456   13631488     20480M    00:00:00 ps -A -o xasid,jobname,pid,ppid,thdcnt,vsz,vsz64,vszlmt64,time,args
By Thread
To display details about each thread of a process, use
-p $PID and -m; for example:
ps -p $PID -m -o xasid,jobname,pid,ppid,xtid,xtcbaddr,vsz,vsz64,vszlmt64,time,semnum,lpid,lsyscall,syscall,state,argsExample output with TIME showing accumulated CPU by
thread:
ASID JOBNAME         PID       PPID              TID  TCBADDR     VSZ      VSZ64   VSZLMT64        TIME  SNUM       LPID LASTSYSC             SYSC S      COMMAND
 175 KGRIGOR3   84025829   33693995                -        -  217448 1513095168     20480M    00:01:38     -          - -                    -    HR     java -Xmx1g ...
   - -                 -          - 1cc3300000000001   8ce048  217448          -          -    00:00:00     -          0 1NOP1NOP1NOP1NOP1NOP 1IPT KU     -
   - -                 -          - 1cc4b00000000002   8fb2f8  217448          -          -    00:01:16     -          0 1NOP1NOP1NOP1NOP1NOP -    RJ     -
   - -                 -          - 1cc4d80000000003   8bce78  217448          -          -    00:00:00     -          0 1NOP1NOP1NOP1NOP1NOP -    RNJV   -
USS Settings
Display
z/OS UNIX System Services (OMVS) settings with
/D OMVS,O to display
Unix configuration.
For example:
BPXO043I 13.46.04 DISPLAY OMVS 850
OMVS     0011 ACTIVE             OMVS=(02,AP,98,PA)
CURRENT UNIX CONFIGURATION SETTINGS:
MAXPROCSYS      =       8192    MAXPROCUSER     =      15000
MAXFILEPROC     =      65000    MAXFILESIZE     = NOLIMIT
MAXCPUTIME      = 2147483647    MAXUIDS         =       8200
MAXPTYS         =       2000    MAXIOBUFUSER    =       2048
MAXMMAPAREA     =      40960    MAXASSIZE       = 2147483647
MAXTHREADS      =      20000    MAXTHREADTASKS  =      10000
MAXCORESIZE     = 2147483647
IPCMSGQBYTES    = 2147483647    IPCMSGQMNUM     =      10000
IPCMSGNIDS      =        500    IPCSEMNIDS      =        500
IPCSEMNOPS      =         25    IPCSEMNSEMS     =       1000
IPCSHMMPAGES    =      25600    IPCSHMNIDS      =       1000
IPCSHMNSEGS     =        500    IPCSHMSPAGES    =     524288
SUPERUSER       = BPXROOT       FORKCOPY        = COPY
STEPLIBLIST     = /etc/steplib
USERIDALIASTABLE=
PRIORITYPG VALUES: NONE
PRIORITYGOAL VALUES: NONE
MAXQUEUEDSIGS   =       2000    SHRLIBRGNSIZE   =  512753664
SHRLIBMAXPAGES  =      40960    VERSION         = RESPB3  ,N
opercmd
opercmd may be an available command to execute operator
commands normally run through a 3270 session, though it requires special
permission. For example:
opercmd "D OMVS,O"Tips
- A dataset may be copied to a file with:
cp "//'cbc.sccnsam(ccnubrc)'" ccnubrc.C - To get to OMVS: ISPF }
6 COMMAND}omvs - OMVS disable autoscroll: NOAUTO } F2
- OMVS enable autoscroll: AUTO } F2
- Convert file from ASCII to EBCDIC:
iconv -fiso8859-1 -tibm-1047 server.xml > server.ebcdic
Language Environment (LE)
z/OS provides a built-in mechanism to recommend fine tuned values for the LE heap. Run with LE RPTSTG(ON) and consult the resulting output: http://www.ibm.com/support/knowledgecenter/SSAW57_8.5.5/com.ibm.websphere.nd.multiplatform.doc/ae/tprf_tunezleheap.html
Ensure that you are NOT using the following options during production: RPTSTG(ON), RPTOPTS(ON), HEAPCHK(ON)
For best performance, use the LPALSTxx parmlib member to ensure that LE and C++ runtimes are loaded into LPA.
Ensure that the Language Environment data sets, SCEERUN and SCEERUN2, are authorized to enable xplink... For best performance, compile applications that use JNI services with xplink enabled.
pax
The pax
command may be used to create or unpack compressed or uncompressed
archive files (similar to POSIX tar and
gzip/gunzip).
- Create with compression:
pax -wzvf $FILE.pax.Z $FILES_OR_DIRS - Create without compression:
pax -wvf $FILE.pax $FILES_OR_DIRS - Unpack (compression autodetected):
pax -ppx -rf $FILE.pax.Z
uncompress
The uncompress
command may be used to decompress .Z files:
uncommpress $FILE.Z3270 Clients
The z/OS graphical user interface is normally accessed through a 3270
session. Commonly used client program are Personal Communications, Host
On-Demand, x3270 (Linux), and c3270 (macOS).
Some notes:
- On some 3270 client keyboard layouts, the right "Ctrl" key is used as the "Enter" key.
- Function keys are used heavily. In general, F3 goes back to the previous screen.
- Some clients such as Host On-Demand allow showing a virtual keyboard (View } Keypad) which may help when needing obscure keys.
- If you receive a red X in the bottom left, then you probably tried to press a key when your cursor was not in an input area. Press the SysReq key and press Enter to reset the screen.
- On some screens, you may move your cursor to any point (normally the top line) and press F2 to split the screen. Use F9 to switch between screens.
- Usually, page up with F7 and page down with F8. If you type
min the input field and press F7 or F8, then you will scroll to the top or bottom, respectively. - Usually, page right with F11 and page left with F10.
- Usually, type
f "SEARCH"to find something and then press F5 to find the next occurrence. Use prev to search backwards:f "SEARCH" prev
z/OS Version
Display z/OS version with /D IPLINFO
Search for the "RELEASE" line:
IEE254I  13.06.07 IPLINFO DISPLAY 033
   SYSTEM IPLED AT 09.38.57 ON 05/15/2018
   RELEASE z/OS 02.02.00    LICENSE = z/OS
   USED LOADRE IN SYS1.IPLPARM ON 00340
   ARCHLVL = 2   MTLSHARE = N
   IEASYM LIST = (05,RE,L)
   IEASYS LIST = (LF,KB) (OP)
   IODF DEVICE: ORIGINAL(00340) CURRENT(00340)
   IPL DEVICE: ORIGINAL(00980) CURRENT(00980) VOLUME(PDR22 )
Interactive System Productivity Facility (ISPF)
After logging in through a 3270 session, it is common to access most programs by typing ISPF.
Typically, if available, F7 is page up, F8 is page down, F10 is page left, and F11 is page right. Typing "m" followed by F7 or F8 pages down to the top or bottom, respectively.
If available, type "F STRING" to find the first occurrence of STRING, and F5 for the next occurrences.
Normally, F3 returns to the parent screen (i.e. exits the current screen).
Command (normally type 6 in ISPF) allows things such as TSO commands or going into Unix System Services (USS).
Utilities - Data Set List (normally type 3.4 in ISPF) allows browsing data sets.
Central Processing Unit (CPU)
z/OS offers multiple different types of processors that may have different costs. The most general processor type is called the general purpose processor or central processor (CP, GCP, or GP). There are also z Integrated Information Processor (zIIPs/IFAs) for Java, etc. workloads, z Application Assist Processors (zAAPs), Integrated Facility for Linux processors (IFLs) for Linux on z/VM, and others.
MSUs
General processor utilization (but not zIIPs/zAAPs/IFLs) is sometimes measured in Million Service Units (MSUs). zAAPs/zIIPs are usually measured in fractional number of processors.
SMF 98.1
With z/OS 2.2 and above, always collect and archive SMF 98.1 records if IBM z/OS Workload Interaction Correlator is entitled. These records provide "valuable data for diagnosing transient performance problems; summary activities with a worst offender and its activity every 5 seconds" with minimal overhead: "IBM benchmarks were run with all available Correlator SMF records being captured and logged and could not detect any additional CPU cost from the increased data collection".
Post-process the output data set using SMF_CORE. To get statistics on the average CP, zIIP, and zAAP utilization and top consumers of each:
java -Xmx1g "-Dcom.ibm.ws390.smf.dateTimeFormat=yyyy-MM-dd'T'HH:mm:ss.SSSZ" -DPRINT_WRAPPER=false -jar smftools.jar "INFILE(DATASET)" "PLUGIN(com.ibm.smf.plugins.Type98CPU,STDOUT)"Example output:
DateTime,LPAR,AvgCpuBusyCP,AvgCpuBusyzAAP,Avg_CpuBusy_zIIP,AddressSpaceMostCPU_CP,AddressSpaceMostCPU_zAAP,AddressSpaceMostCPU_zIIP
2023-12-11T12:30:00.000+0000,DBOC,43,0,41,D2PDDIST,,D2PDDIST
2023-12-11T12:30:05.000+0000,DBOC,50,0,44,D2PDDIST,,D2PDDIST
[...]
Display processors
Display
processors with /D M=CPU displays
various CPU information.
For example, the following shows seven online general purpose processors (MT=1) and ten online zIIP processors (MT=2):
IEE174I 13.44.30 DISPLAY M 926
CORE STATUS: HD=Y   MT=2  MT_MODE: CP=1  zIIP=2
ID    ST   ID RANGE   VP  ISCM  CPU THREAD STATUS
0000   +   0000-0001  H   FC00  +N
0001   +   0002-0003  H   FC00  +N
0002   +   0004-0005  H   0000  +N
0003   +   0006-0007  H   0000  +N
0004   +   0008-0009  H   0000  +N
0005   +   000A-000B  H   0000  +N
0006   +   000C-000D  M   0000  +N
0007   -   000E-000F
0008   -   0010-0011
0009   -   0012-0013
000A   -   0014-0015
000B   -   0016-0017
000C   -   0018-0019
000D   +I  001A-001B  H   0200  ++
000E   +I  001C-001D  H   0200  ++
000F   +I  001E-001F  H   0200  ++
0010   +I  0020-0021  H   0200  ++
0011   +I  0022-0023  H   0200  ++
0012   +I  0024-0025  H   0200  ++
0013   -I  0026-0027
0014   -I  0028-0029
0015   -I  002A-002B
0016   -   002C-002D
0017   -   002E-002F
0018   -   0030-0031
0019   -   0032-0033
001A   -   0034-0035
001B   -   0036-0037
001C   -   0038-0039
001D   +I  003A-003B  H   0200  ++
001E   -I  003C-003D
001F   -I  003E-003F
0020   -I  0040-0041
0021   -I  0042-0043
0022   -I  0044-0045
Display threads in an address space
Display threads in an address space and the accumulated
CPU by thread: /D OMVS,PID=XXX (search for PID in the
joblogs of the address space). This output includes a
CT_SECS field which shows the total CPU seconds consumed by
the address space. Note that the sum of all the ACC_TIME in
the report will not equal CT_SECS or the address CPU as
reported by RMF or SDSF because some threads may have terminated. The
ACC_TIME and CT_SECS fields wrap after 11.5
days and will contain *****; therefore, the
/D OMVS,PID= display is less useful when the address space
has been running for longer than that.
-RO MVSA,D OMVS,PID=67502479
BPXO040I 11.09.56 DISPLAY OMVS 545
OMVS 000F ACTIVE OMVS=(00,FS,0A)
USER JOBNAME ASID PID PPID STATE START CT_SECS
WSASRU WSODRA S 0190 67502479 1 HR---- 23.01.38 13897.128 1
LATCHWAITPID= 0 CMD=BBOSR
THREAD_ID            TCB@    PRI_JOB USERNAME ACC_TIME SC STATE
2621F4D000000008 009C7938                       12.040 PTX JY V
All the threads/TCBs are listed and uniquely identified by their
thread ID under the THREAD_ID column. The accumulated CPU
time for each thread is under the ACC_TIME column. The
thread ID is the first 8 hexadecimal characters in the
THREAD_ID and can be found in a matching
javacore.txt file. In the example above, the Java thread ID
is 2621F4D0.
The threads with eye-catcher WLM are those from the ORB
thread pool which are the threads that run the application enclave
workload. Be careful when attempting to reconcile these CPU times with
CPU accounting from RMF and SMF. This display shows all the threads in
the address space, but remember that threads that are WLM managed (e.g.
the Async Worker threads and the ORB threads) have their CPU time
recorded in RMF/SMF under the enclave which is reported in the RMF
report class that is associated with the related WLM classification rule
for the CB workload type. The other threads will have their
CPU time charged to the address space itself as it is classified in WLM
under the STC workload type.
WebSphere trace entries also contain the TCB address of the thread generating those entries. For example:
THREAD_ID TCB§ PRI_JOB USERNAME ACC_TIME SC STATE
2707058000000078 009BDB58 178.389 STE JY V
Trace: 2009/03/19 08:28:35.069 01 t=9BDB58 c=UNK key=P8 (0000000A)
The SDSF.PS display provides an easy way to issue this command for
one or more address spaces. Type d next to an address space
to get this same output. Type ULOG to see the full output
or view in SDSF.LOG.
Similar information can be found from USS:
$ ps -p $PID -m -o xtid,xtcbaddr,tagdata,state=STATE -o atime=CPUTIME -o syscall
TID TCBADDR STATE CPUTIME SYSC
- - HR 14:12 -
1e4e300000000000 8d0e00 YU 0:20
1e4e400000000001 8d07a8 YJV 0:00
1e4e500000000002 8d0588 YNJV 0:00
1e4e600000000003 8d0368 YJV 1:35
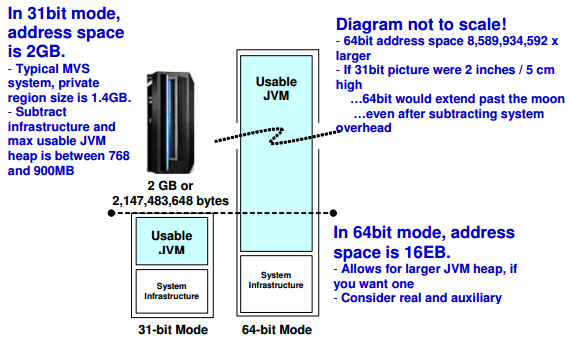
1e4e700000000004 8d0148 YJV 0:2531-bit vs 64-bit
z/OS does not have a 32-bit architecture, but instead only has a 31-bit architecture:
zIIP/zAAP Processors
Review zIIP processors:
- Type
/D IPLINFOand search forLOADY2. - Go to the data set list and type the name from
LOADY2in Dsname level and press enter (e.g.SYS4.IPLPARM). - Type
bto browse the data set members and search forPARMLIB. - Go to the data set list and type the name (e.g.
USER.PARMLIB) and find theIEAOPTmember.
Inside SYS1.PARMLIB(IEAOPTxx), the following options
will affect how the zIIP engines process work.
- IFACrossOver = YES / NO
- YES - work can run on both zIIP and general purpose CPs
- NO - work will run only on zIIPs unless there are no zIIPs
- IFAHonorPriority = YES / NO
- YES - WLM manages the priority of zIIP eligible work for CPs
- NO - zIIP eligible work can run on CPs but at a priority lower than any non-zIIP work
Java zIIP/zAAP usage
Restart with -Xtrace:iprint=j9util.48 and review
stderr for libraries using zIIP/zAAP with the following
message:
validateLibrary shared library [...]/lib/default/zip flagged as zAAP enabledSystem Display and Search Facility (SDSF)
SDSF (normally type S in ISPF) provides a system
overview.
SDSF.LOG
LOG shows the system log and it is the most common place to execute
system commands. Enter a system command by pressing /,
press enter, and then type the command and press enter. Then use F8 or
press enter to refresh the screen to see the command's output.
Display system activity summary: /D A
IEE114I 16.18.32 2011.250 ACTIVITY 733
JOBS     M/S    TS USERS    SYSAS    INITS   ACTIVE/MAX VTAM     OAS
00008    00034    00001      00035    00034    00001/00300       00019
Display users on the system: /D TS,L
IEE114I 16.51.50 2011.251 ACTIVITY 298
JOBS     M/S    TS USERS    SYSAS    INITS   ACTIVE/MAX VTAM     OAS
00008    00039    00002      00039    00034    00002/00300       00029
DOUGMAC  OWT      WITADM1 IN
Check global resource contention with /D GRS,C
SDSF.DA
SDSF.DA shows active
address spaces. CPU/L/Z A/B/C shows current CPU use,
where A=total, B=LPAR usage, and C=zAAP/zIIP usage.
Type PRE * to show all address spaces.
Type SORT X to sort, e.g. SORT CPU%.
Page right to see useful information such as MEMLIMIT,
RPTCLASS, WORKLOAD, and
SRVCLASS.
In the NP column, type S next to an address
space to get all of its output, or type ? to get a member
list and then type S for a particular member (e.g.
SYSOUT, SYSPRINT).
When viewing joblog members of an address space (? in
SDSF.DA), type XDC next to a member to transfer it to a
data set.
SDSF.ST is similar to DA and includes
completed jobs.
Physical Memory (RAM)
Display
memory with /D M=STOR displays
various memory information.
The ONLINE sections show available memory. For example,
this shows 64GB:
D M=STOR
IEE174I 16.00.48 DISPLAY M 238
REAL STORAGE STATUS
ONLINE-NOT RECONFIGURABLE
  0M-64000M
ONLINE-RECONFIGURABLE
  NONE
PENDING OFFLINE
  NONE
0M IN OFFLINE STORAGE ELEMENT(S)
0M UNASSIGNED STORAGE
STORAGE INCREMENT SIZE IS 256M
Display
ASM with /D ASM to display
paging spaces.
The FULL columns for LOCAL entries should
never be greater than 0%. For example:
D ASM
IEE200I 15.30.16 DISPLAY ASM 205
TYPE   FULL STAT  DEV DATASET NAME
PLPA    79%   OK 0414 SYS1.S12.PLPA
COMMON   0%   OK 0414 SYS1.S12.COMMON
LOCAL    0%   OK 0414 SYS1.S12.LOCAL1
LOCAL    0%   OK 0445 SYS1.S12.PAGE01
Display total virtual storage: /D VIRTSTOR,HVSHARE
IAR019I  17.08.47 DISPLAY VIRTSTOR 313
SOURCE = DEFAULT
TOTAL SHARED = 522240G
SHARED RANGE = 2048G-524288G
SHARED ALLOCATED = 262244M
Some systems display free memory with /F AXR,IAXDMEM:
IAR049I DISPLAY MEMORY V1.0 233
PAGEABLE 1M STATISTICS
   66.7GB : TOTAL SIZE
   50.8GB : AVAILABLE FOR PAGEABLE 1M PAGE
 2404.0MB : IN-USE FOR PAGEABLE 1M PAGES
 5238.0MB : MAX IN-USE FOR PAGEABLE 1M PAG
    0.0MB : FIXED PAGEABLE 1M FRAMES
LFAREA 1M STATISTICS - SOURCE = DEFAULT
    0.0MB : TOTAL SIZE
    0.0MB : AVAILABLE FOR FIXED 1M PAGES
    0.0MB : IN-USE FOR FIXED 1M PAGES
    0.0MB : MAX IN-USE FOR FIXED 1M PAGES
LFAREA 2G STATISTICS - SOURCE = DEFAULT
    0.0MB : TOTAL SIZE = 0
    0.0MB : AVAILABLE FOR 2G PAGES = 0
    0.0MB : IN-USE FOR 2G PAGES = 0
    0.0MB : MAX IN-USE FOR 2G PAGES = 0
Job Entry Subsystem (JES)
Use /$DSPOOL to list spool utilization. For example:
$HASP646 41.0450 PERCENT SPOOL UTILIZATIONWorkload Management (WLM)
WLM only makes noticeable decisions about resources when resources are low.
WLM performs better with less service classes.
- Service Classes - goals for a particular type of work - you can have as many of these as you want but from a performance perspective the fewer service classes the better
- Classification Rules - classification rules tie an address space or group of address spaces to a goal or service class
- Report Classes - report classes have nothing to do with classification of work but they do allow you to show reports from a particular perspective for problem and performance diagnosis
Display WLM configuration: /D WLM
IWM025I  14.31.46  WLM DISPLAY 214
ACTIVE WORKLOAD MANAGEMENT SERVICE POLICY NAME: CBPTILE
ACTIVATED: 2011/06/13  AT: 16:15:27  BY: WITADM1   FROM: S12
DESCRIPTION: CB trans w/short percentile goal
RELATED SERVICE DEFINITION NAME: CBPTILE
INSTALLED: 2011/06/13  AT: 16:15:08  BY: WITADM1   FROM: S12
The related service definition name is the currently configured WLM definition.
Classify location service daemons and controllers as SYSSTC or high velocity.
Set achievable percentage response time goals: For example, a goal that 80% of the work will complete in .25 seconds is a typical goal. Velocity goals for application work are not meaningful and should be avoided.
Make your goals multi-period: This strategy might be useful if you have distinctly short and long running transactions in the same service class. On the other hand, it is usually better to filter this work into a different service class if you can. Being in a different service class will place the work in a different servant which allows WLM much more latitude in managing the goals.
Define unique WLM report classes for servant regions and for applications running in your application environment. Defining unique WLM report classes enables the resource measurement facility (RMF) to report performance information with more granularity.
Periodically review the results reported in the RMF Postprocessor workload activity report: Transactions per second (not always the same as client tran rate), Average response times (and distribution of response times), CPU time used, Percent response time associated with various delays
Watch out for work that defaults to SYSOTHER.
Delay monitoring: http://www.ibm.com/support/knowledgecenter/SSAW57_8.5.5/com.ibm.websphere.nd.multiplatform.doc/ae/rprf_wlmdm.html
You can print the entire WLM definition from the main screen:
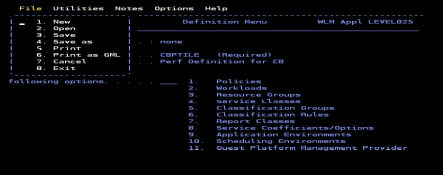
Within the Subsystem types section you will find the classification rules that tie the address spaces to the service classes and report classes. You can also find this by paging right in SDSF.DA.
So what is the Response Time Ratio and what does it tell us? WLM calculates the Response Time Ratio by dividing the actual response time (enclave create to enclave delete) by the GOAL for this service class and multiplying by 100. It is, basically, a percentage of the goal. Note that WLM caps the value at 1000 so if the goal is badly missed you might see some big numbers but they will never exceed 1000. (http://www-03.ibm.com/support/techdocs/atsmastr.nsf/5cb5ed706d254a8186256c71006d2e0a/0c808594b1db5c6286257bb1006118ab/$FILE/ATTHSSAD.pdf/WP102311_SMF_Analysis.pdf)
A CPU goal uses CPU Service Units which normalize across different CPU models: https://www.ibm.com/support/knowledgecenter/en/SSLTBW_2.4.0/com.ibm.zos.v2r4.iear100/calc.htm
HTTP Request Distribution
When multiple servants are bound to the same service class, WLM attempts to dispatch the new requests to a hot servant. A hot servant has a recent request dispatched to it and has threads available. If the hot servant has a backlog of work, WLM dispatches the work to another servant.
Normally running this hot servant strategy is good because the hot servant likely has all its necessary pages in storage, has the just-in-time (JIT) compiled application methods saved close by, and has a cache full of data for fast data retrieval. However, this strategy presents a problem in the following situations: [...]
The default workload distribution strategy uses a hot servant for running requests that create HTTP session objects. Consider configuring the product and the z/OS Workload Manager to distribute your HTTP session objects in a round-robin manner in the following conditions:
- HTTP session objects in memory are used, causing dispatching affinities.
- The HTTP sessions in memory last for many hours or days.
- A large number of clients with HTTP session objects must be kept in memory.
- The loss of a session object is disruptive to the client or server.
- There is a large amount of time between requests that create HTTP sessions.
Execution Velocity
"The execution velocity is a measure of how fast work is running compared to ideal conditions without delays." (https://www.ibm.com/support/knowledgecenter/SSLTBW_2.4.0/com.ibm.zos.v2r4.erbb500/exvel.htm)
System Management Facilities (SMF)
SMF captures operating system statistics to data sets.
Display what SMF is currently recording: /D SMF,O
IEE967I 08.21.08 SMF PARAMETERS 439
MEMBER = SMFPRMT8...
SYS(DETAIL) -- PARMLIB
SYS(TYPE(0,2:10,14,15,20,22:24,26,30,32:34,40,42,47:48,58,64,
70:83,84,88,89,90,100:103,110,120,127:134,148:151,161,199,225,
244,245,253)) -- PARMLIB...
INTVAL(30) -- PARMLIB...
DSNAME(SYS1.S34.MAN2) -- PARMLIB
DSNAME(SYS1.S34.MAN1) -- PARMLIB
ACTIVE -- PARMLIB
The MEMBER is the PARMLIB member holding the configuration. The SYS line shows which SMF types are being monitored. INTVAL is the recording interval (in minutes). The DSNAME members are the working data sets for the SMF data.
Modify the recording interval dynamically: /F RMF,MODIFY ZZ,SYNC(RMF,0),INTERVAL(15M)
Display SMF data set usage: /D SMF
RESPONSE=S12
NAME                  VOLSER SIZE(BLKS) %FULL  STATUS
P-SYS1.S12.MANC       SMF001    180000    79  ACTIVE
S-SYS1.S12.MAND       SMF001    180000     0  ALTERNATE
When the active volume fills up, SMF switches to the alternative. This can be done manually with /I SMF
Example JCL to Dump SMF
//SMFD3 JOB MSGCLASS=H,MSGLEVEL=(1,1),REGION=128M,TIME=5,
//  NOTIFY=&SYSUID
// SET SMFIN=S25J.ZTESTB.S12.SMF.G0213V00
//* OUTPUT DATASET NAME
// SET DUMPOUT=ZPER.WM0.SMFS12.D213
//*
//S0      EXEC PGM=IFASMFDP,REGION=128M
//SYSPRINT DD  SYSOUT=*
//DUMPIN1      DD DISP=SHR,DSN=&SMFIN
//DUMPOUT      DD DISP=(,CATLG,DELETE),UNIT=SYSDA,
//             SPACE=(CYL,(400,100),RLSE),
//             DSN=&DUMPOUT,
//             LRECL=32760,BLKSIZE=23467,RECFM=VBS
//SYSIN        DD *
INDD(DUMPIN1,OPTIONS(DUMP))
OUTDD(DUMPOUT,TYPE(0:255))
/*
Example JCL to Dump Live SMF Data Sets into a Permanent One
//SMFD3 JOB MSGCLASS=H,MSGLEVEL=(1,1),REGION=128M,TIME=5,
//  NOTIFY=&SYSUID
// SET SMFIN=S25J.ZTESTG.S34.SMF.G1017V00
//* OUTPUT DATASET NAME
// SET DUMPOUT=ZPER.S34.MEVERET.D092211.A
//*
//S0      EXEC PGM=IFASMFDP,REGION=128M
//SYSPRINT DD  SYSOUT=*
//DUMPIN1      DD DISP=SHR,DSN=&SMFIN
//DUMPOUT      DD DISP=(,CATLG,DELETE),UNIT=SYSDA,
//             SPACE=(CYL,(400,100),RLSE),
//             DSN=&DUMPOUT,
//             LRECL=32760,BLKSIZE=23467,RECFM=VBS
//SYSIN        DD *
INDD(DUMPIN1,OPTIONS(DUMP))
OUTDD(DUMPOUT,TYPE(0:255))
/*
The output from the JCL contains the types of records and number of records in the raw data:
IFA020I DUMPOUT  -- ZPER.S34.MEVERET.D092211.A
IFA020I DUMPIN1  -- S25J.ZTESTG.S34.SMF.G1017V00
                                           SUMMARY ACTIVITY REPORT
      START DATE-TIME  09/22/2011-09:33:34                         END DATE-TIME
      RECORD RECORDS PERCENT      AVG. RECORD       MIN. RECORD   MAX.
        TYPE     READ        OF TOTAL           LENGTH            LENGTH
          2             1             .00 %                18.00                18
          3             1             .00 %                18.00                18
...
     TOTAL       42,572       100 %             1,233.27                18
     NUMBER OF RECORDS IN ERROR               0
Example JCL to Dump SMF
//SMFR1 JOB MSGLEVEL=(1,1),MSGCLASS=H
//WKLD@PGP EXEC PGM=ERBRMFPP,REGION=0K
//MFPINPUT DD   DSN=ZPER.WM0.SMFS12.D203,DISP=SHR
//PPXSRPTS DD   SYSOUT=*,DCB=(RECFM=FBA,LRECL=133)
//MFPMSGDS DD   SYSOUT=*
//SYSOUT   DD   SYSOUT=*
//SYSIN    DD   *
 ETOD(0000,2400)
 PTOD(0000,2400)
 RTOD(0000,2400)
 STOD(0000,2400)
 SYSRPTS(WLMGL(RCLASS(W*)))
    SYSOUT(H)
/*
 SYSRPTS(WLMGL(SCPER,RCLASS(WT7*)))
/*Example JCL to Clear SMF
//SMFCLEAR JOB MSGLEVEL=(1,1)
//STEP1  EXEC PGM=IFASMFDP
//DUMPIN   DD DSN=SYS1.S12.MANC,DISP=SHR
//*
//* SYS1.S34.MAN1
//* SYS1.S34.MAN2
//*
//*DUMPIN   DD DSN=SYS1.S12.MANC,DISP=SHR
//DUMPOUT DD DUMMY
//SYSPRINT DD SYSOUT=*
//SYSIN    DD *
  INDD(DUMPIN,OPTIONS(CLEAR))
  OUTDD(DUMPOUT,TYPE(000:255))
Resource Measurement Facility (RMF)
- Display if RMF ZZ monitor is running: /F RMF,D ZZ
- Start RMF ZZ monitor: /F RMF,S ZZ
- Start RMFGAT: /F RMF,S III
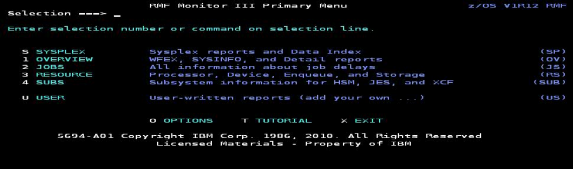
Monitoring RMF in live mode can be very useful (navigate through ISPF). F10 and F11 page backwards and forwards through time.
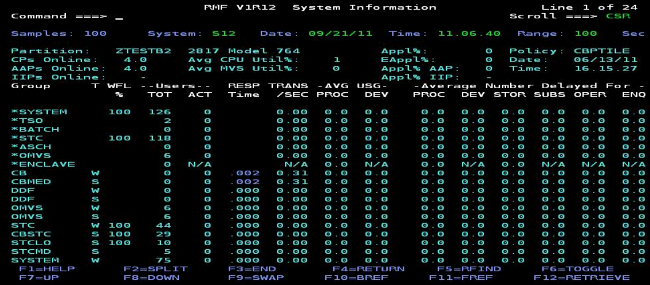
Use RMF Monitor 3 } CPC for overall CPU. Execute procu
for detailed CPU. Execute sysinfo for general information.
Execute syssum for a sysplex summary.
Workload Activity Report
The JCL to produce this was covered above.
Example snippet output:
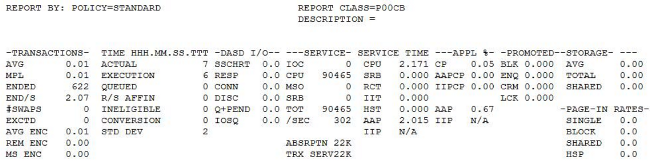
Important values:
- CPU - this is the total amount of processor time (excluding SRB time), used during this interval. It includes time spent on general purpose CPs, zAAPs and zIIPs.
- SRB - this is the amount of processor time consumed by SRBs during the interval. An SRB is a special unit of work used primarily by the operating system to schedule functions that need to run quickly and with high priority.
- AAP - this is the amount of time work was running on zAAP processors during the interval. The IIP field is exactly the same as AAP except it reports time spent on zIIP processors. On our system there were no zIIP processors defined so it will be ignored.
- Ended - this is the total number of WebSphere requests that completed during the interval.
- CP - this value represents the amount of time spent on general
purpose processor. It includes the CP time and the zAAP time that is
reported under the "SERVICE TIME" heading, fields CPU and SRB.
The length of this interval is 5 minutes or 300 seconds so using the CP field value under the "APPL %" heading the amount of CP time is:
(CP * interval length) / 100 or (0.20 * 300) / 100 = 0.600 (rounding error) - AAPCP - this value is the amount of zAAP time that ran on a CP which
could have run on a zAAP had a zAAP processor been available. It is a
subset of the CP value. The system must be configured to capture this
value. It is controlled by the parmlib option xxxxxxxxxxxx. Our system
did not have this option set. To convert this percentage to time is
simple:
(AAPCP * interval length) / 100 - IIPCP - same as AAPCP except for zIIP processors
- AAP - this is the amount of zAAP time consumed during the interval. It reports the same value as the AAP field under the "SERVICE TIME" heading.
- IIP - same as AAP except for zIIP processors.
The APPL% values are processor times reported as a percentage. They are reported as the percentage of a single processor so it is common to see values greater than 100% on multi-processor systems.
Given this information, calculating the amount of processor time used during the interval is very straightforward. The amount of zAAP processor time is simply the value reported in the AAP field, 2.015 seconds. Remember the CPU field contains the time spent on zAAPs so if we want to calculate the total amount of general purpose CP time we must subtract the AAP value from the total of the CPU and SRB values.
In the example above, which is a report class that defines enclave work, the SRB field will always be zero so to calculate the CP time we simply need to subtract the AAP value from the CPU value or 2.171 - 2.015 = 0.156. So in this example, an enclave service class, the total amount of CP and zAAP processor time spent by work executing under this report class is simply the CPU value.
Since we are using a WebSphere example we should also include the amount of processor time consumed by the deployment manager address spaces (control and servant), the node agent address space, and the application server address spaces (control and servant) (the SRB field is non-zero so remember to add that value to the CPU value to get the total amount of CP and zAAP time consumed during the interval. Then just subtract the AAP value from this total to get the amount of CP processor time.)
Example Analysis of Multi-Period Discretionary Delays
        z/OS V2R3               SYSPLEX AAAAAA             DATE 04/16/2020           INTERVAL 15.00.032   MODE = GOAL
                                RPT VERSION V2R3 RMF       TIME 16.00.00

POLICY=BBBBBBBB   WORKLOAD=CCCCCC     SERVICE CLASS=DDDDDDDD     RESOURCE GROUP=*NONE      PERIOD=2 IMPORTANCE=DISC
                                      CRITICAL     =NONE

-TRANSACTIONS--  TRANS-TIME HHH.MM.SS.FFFFFF  TRANS-APPL%-----CP-IIPCP/AAPCP-IIP/AAP  ---ENCLAVES---
AVG        1.48  ACTUAL 3.703426  TOTAL         0.11        0.05  225.28  AVG ENC   1.48
MPL        1.48  EXECUTION          3.702356  MOBILE        0.00        0.00    0.00  REM ENC   0.00
ENDED 494  QUEUED                 1069  CATEGORYA     0.00        0.00    0.00  MS ENC    0.00
END/S      0.55  R/S AFFIN                 0  CATEGORYB     0.00        0.00    0.00
#SWAPS        0  INELIGIBLE                0
EXCTD         0  CONVERSION                0
                 STD DEV 10.163165

----SERVICE----   SERVICE TIME  ---APPL %---  --PROMOTED--  --DASD I/O---  ----STORAGE----  -PAGE-IN RATES-
IOC           0   CPU 2028.572  CP      0.11  BLK    0.000  SSCHRT    4.1  AVG        0.00  SINGLE      0.0
CPU       67902K  SRB    0.000  IIPCP   0.05  ENQ    0.006  RESP      0.6  TOTAL      0.00  BLOCK       0.0
MSO           0   RCT    0.000  IIP   100.47  CRM    0.000  CONN      0.1  SHARED     0.00  SHARED      0.0
SRB           0   IIT    0.000  AAPCP   0.00  LCK    0.134  DISC      0.4                   HSP         0.0
TOT       67902K  HST    0.000  AAP      N/A  SUP    0.000  Q+PEND    0.1
/SEC      75446   IIP  904.286                              IOSQ      0.0
ABSRPTN      51K  AAP      N/A
TRX SERV     51K

GOAL: DISCRETIONARY

         RESPONSE TIME    EX   PERF  AVG   --EXEC USING%--  -------------- EXEC DELAYS % -----------  -USING%-  --- DELAY % ---    %
SYSTEM                    VEL% INDX ADRSP  CPU AAP IIP I/O  TOT IIP CPU                                CRY CNT  UNK IDL CRY CNT  QUI

*ALL        --N/A--       91.5        1.5  0.1 N/A  70 0.1  6.5 6.4 0.1                                0.1 0.0   23 0.0 0.0 0.0  0.0
EE01                      92.0        0.6  0.0 N/A  72 0.0  6.3 6.3 0.0                                0.1 0.0   21 0.0 0.0 0.0  0.0
EE02                      91.1        0.8  0.1 N/A  69 0.1  6.7 6.6 0.2                                0.1 0.0   24 0.0 0.0 0.0  0.0
This is saying that 494 WAS transaction completed in this 15 minute interval ending at 16:00:00 under the discretionary period 2 goal, their average execution time was 3.7 seconds, the execution time standard deviation was 10.1 seconds, and the total sampled execution delays averaged 6.5% (mostly delayed on zIIPs). For detailed descriptions of the fields, see https://www.ibm.com/support/knowledgecenter/en/SSLTBW_2.3.0/com.ibm.zos.v2r3.erbb500/wfields.htm
And, "Set achievable percentage response time goals. Velocity goals for application work are not meaningful and should be avoided. [...] Watch out for work that [...] has a discretionary goal."
FTP
FTP can be used to download both USS files as well as data sets. To download a data set, surround the data set name with apostrophes:
ftp> ascii
200 Representation type is Ascii NonPrint
ftp> get 'WITADM1.SPF1.LIST'
...
To convert character sets from EBCDIC to ASCII, use FTP ASCII mode. If the file was written on the z/OS system with an ASCII character set, then download the file using FTP BINARY mode.
Input/Output (I/O)
Ensure that DASD are of the fastest speed, striping, etc.
Networking
To discover the host name, run the system command /D SYMBOLS and find the TCPIP address space name. In the TCPIP address space joblogs output, find the TCPIP profile configuration data set:
PROFILE DD DISP=SHR,DSN=TCPIP.PROFILE(&SYSN.)...
In 3.4, browse this dataset and this will show the host name and IP address mapping.
Increase MAXSOCKETS and MAXFILEPROC to 64000 (http://www.ibm.com/support/knowledgecenter/SSAW57_8.5.5/com.ibm.websphere.nd.doc/ae/tprf_tunetcpip.html, http://www.ibm.com/support/knowledgecenter/SSLTBW_2.2.0/com.ibm.zos.v2r2.bpxb200/mxflprc.htm)
Consider disabling delayed acknowledgments (NODELAYACKS). Warning: This option may or may not be better depending on the workload (see the discussion of delayed acknowledgments). (http://www.ibm.com/support/knowledgecenter/SSAW57_8.5.5/com.ibm.websphere.nd.doc/ae/tprf_tunetcpip.html)
Set SOMAXCONN=511 (http://www.ibm.com/support/knowledgecenter/SSAW57_8.5.5/com.ibm.websphere.nd.doc/ae/tprf_tunetcpip.html)
Monitoring dispatch requests: http://www.ibm.com/support/knowledgecenter/SSAW57_8.5.5/com.ibm.websphere.nd.multiplatform.doc/ae/tprf_monitor_dispatch_requests.html
Type HOMETEST in ISPF COMMAND to get the IP hostname and address.
Network Statistics
Display
TCPIP netstat with /D TCPIP,,N,STATS displays
various network information.
In general, SEGMENTS RETRANSMITTED should be 0 on LAN
communications.
Example:
EZZ2500I NETSTAT CS 3.1 TCPIP 168
IP STATISTICS
  PACKETS RECEIVED                   = 2056076930
  INBOUND CALLS FROM DEVICE LAYER    = 921422970
  INBOUND FRAME UNPACKING ERRORS     = 0
  INBOUND DISCARDS MEMORY SHORTAGE   = 0
  RECEIVED HEADER ERRORS             = 0
  RECEIVED ADDRESS ERRORS            = 0
  DATAGRAMS FORWARDED                = 0
  UNKNOWN PROTOCOLS RECEIVED         = 0
  RECEIVED PACKETS DISCARDED         = 0
  RECEIVED PACKETS DELIVERED         = 2056097608
  OUTPUT REQUESTS                    = 162709506
  OUTPUT DISCARDS NO ROUTE           = 0
  OUTPUT DISCARDS DLC SYNC ERRORS    = 2
  OUTPUT DISCARDS DLC ASYNC ERRORS   = 0
  OUTPUT DISCARDS MEMORY SHORTAGE    = 0
  OUTPUT DISCARDS (OTHER)            = 0
  REASSEMBLY TIMEOUTS                = 0
  REASSEMBLY REQUIRED                = 204
  REASSEMBLY SUCCESSFUL              = 102
  REASSEMBLY FAILURES                = 0
  DATAGRAMS SUCCESSFULLY FRAGMENTED  = 113
  DATAGRAMS FAILING FRAGMENTATION    = 0
  FRAGMENTS CREATED                  = 226
  INBOUND PACKETS HANDLED BY ZIIP    = 64637
  OUTBOUND PACKETS HANDLED BY ZIIP   = 23502611
ICMP STATISTICS
                            RECEIVED    SENT
                            --------    ----
  MESSAGES                  20949       20875
  ERRORS                    0           0
  DESTINATION UNREACHABLE   20780       20705
  TIME EXCEEDED             0           0
  PARAMETER PROBLEMS        0           0
  SOURCE QUENCHS            0           0
  REDIRECTS                 0           0
  ECHOS                     167         3
  ECHO REPLIES              2           167
  TIMESTAMPS                0           0
  TIMESTAMP REPLIES         0           0
  ADDRESS MASKS             0           0
  ADDRESS MASK REPLIES      0           0
TCP STATISTICS
  CURRENT ESTABLISHED CONNECTIONS     = 3461
  CURRENT STALLED CONNECTIONS         = 0
  CURRENT SERVERS IN CONNECTION FLOOD = 0
  ACTIVE CONNECTIONS OPENED           = 9280137
  PASSIVE CONNECTIONS OPENED          = 9042899
  CONNECTIONS CLOSED                  = 18327988
  ESTABLISHED CONNECTIONS DROPPED     = 6989192
  CONNECTION ATTEMPTS DROPPED         = 624158
  CONNECTION ATTEMPTS DISCARDED       = 354
  TIMEWAIT CONNECTIONS REUSED         = 0
  SEGMENTS RECEIVED                   = 2042354018
  HEADER PREDICTION OK FOR ACK        = 1507326612
  HEADER PREDICTION OK FOR DATA       = 572748731
  DUPLICATE ACKS                      = 8882154
  DISCARDS FOR BAD CHECKSUM           = 0
  DISCARDS FOR BAD HEADER LENGTH      = 0
  DISCARDS FOR DATA TOO SHORT         = 0
  DISCARDS FOR OLD TIMESTAMP          = 890
  SEGMENTS COMPLETELY DUPLICATE       = 3596370
  SEGMENTS PARTIALLY DUPLICATE        = 2162
  SEGMENTS COMPLETELY AFTER WINDOW    = 5
  SEGMENTS PARTIALLY AFTER WINDOW     = 0
  SEGMENTS OUT OF ORDER               = 235749
  SEGMENTS RECEIVED AFTER CLOSE       = 8163706
  WINDOW PROBES RECEIVED              = 0
  WINDOW UPDATES RECEIVED             = 4681217
  SEGMENTS RECEIVED ON OSA BULK QUEUES= 0
  SEGMENTS SENT                       = 140242766
  WINDOW UPDATES SENT                 = 566
  DELAYED ACKS SENT                   = 10067680
  RESETS SENT                         = 10561256
  SEGMENTS RETRANSMITTED              = 3796032
  RETRANSMIT TIMEOUTS                 = 151772
  CONNECTIONS DROPPED BY RETRANSMIT   = 608
  PATH MTU DISCOVERY RETRANSMITS      = 0
  PATH MTU BEYOND RETRANSMIT LIMIT    = 0
  WINDOW PROBES SENT                  = 0
  CONNECTIONS DROPPED DURING PROBE    = 0
  KEEPALIVE PROBES SENT               = 169617
  CONNECTIONS DROPPED BY KEEPALIVE    = 0
  CONNECTIONS DROPPED BY FINWAIT2     = 89
  CONFIGURED EPHEMERAL PORTS          = 63434
  EPHEMERAL PORTS IN USE              = 605
  EPHEMERAL PORTS MAX USAGE           = 1000
  EPHEMERAL PORTS EXHAUSTED           = 0
SMCD STATISTICS
  CURRENT ESTABLISHED SMC LINKS       = 0
  ACTIVE SMC LINKS OPENED             = 0
  PASSIVE SMC LINKS OPENED            = 0
  SMC LINKS CLOSED                    = 0
  CURRENT ESTABLISHED CONNECTIONS     = 0
  ACTIVE CONNECTIONS OPENED           = 0
  PASSIVE CONNECTIONS OPENED          = 0
  CONNECTIONS CLOSED                  = 0
  SEGMENTS RECEIVED                   = 0
  SEGMENTS SENT                       = 0
  RESETS SENT                         = 0
  RESETS RECEIVED                     = 0
SMCR STATISTICS
  CURRENT ESTABLISHED SMC LINKS       = 20
  SMC LINK ACTIVATION TIME OUTS       = 0
  ACTIVE SMC LINKS OPENED             = 20
  PASSIVE SMC LINKS OPENED            = 196
  SMC LINKS CLOSED                    = 196
  CURRENT ESTABLISHED CONNECTIONS     = 23
  ACTIVE CONNECTIONS OPENED           = 160
  PASSIVE CONNECTIONS OPENED          = 98
  CONNECTIONS CLOSED                  = 235
  SEGMENTS RECEIVED                   = 64811
  SEGMENTS SENT                       = 65892
  RESETS SENT                         = 0
  RESETS RECEIVED                     = 0
UDP STATISTICS
  DATAGRAMS RECEIVED                  = 8120313
  NO PORT ERRORS                      = 20705
  RECEIVE ERRORS                      = 0
  DATAGRAMS SENT                      = 8140548
  CONFIGURED EPHEMERAL PORTS          = 64510
  EPHEMERAL PORTS IN USE              = 0
  EPHEMERAL PORTS MAX USAGE           = 42
  EPHEMERAL PORTS EXHAUSTED           = 0
END OF THE REPORT
DNS
By default, the DNS lookup timeout (which Java uses) defaults to 5 seconds.
TCP Congestion Control
Review the background on TCP congestion control.
Consider tuning TCP/IP buffer sizes using TCPCONFIG; for example:
- TCPSENDBFRSIZE=131070
- TCPRCVBUFRSIZE=131070
netstat
netstat
may be used to list sockets from USS. The -A flag provides
details such as send and receive queues. For example:
$ netstat -A | head -50
MVS TCP/IP NETSTAT CS V2R4       TCPIP Name: TCPIP           17:14:53
Client Name: BBODMGR                  Client Id: 0000043D
  Local Socket: ::ffff:9.57.7.207..6001
  Foreign Socket: ::ffff:9.57.7.207..1550
    BytesIn:            00000000000037507439
    BytesOut:           00000000000000240750
    SegmentsIn:         00000000000000001232
    SegmentsOut:        00000000000000001230
    StartDate:          01/20/2021       StartTime:          20:30:14
    Last Touched:       21:10:34         State:              Establsh
    RcvNxt:             1627254963       SndNxt:             0500396862
    ClientRcvNxt:       1627254963       ClientSndNxt:       0500396862
    InitRcvSeqNum:      1589747523       InitSndSeqNum:      0500156111
    CongestionWindow:   0000130966       SlowStartThreshold: 0000065535
    IncomingWindowNum:  1627517107       OutgoingWindowNum:  0500659006
    SndWl1:             1627248788       SndWl2:             0500396862
    SndWnd:             0000262144       MaxSndWnd:          0000262144
    SndUna:             0500396862       rtt_seq:            0500156111
    MaximumSegmentSize: 0000065483       DSField:            00
    Round-trip information:
      Smooth trip time: 0.000            SmoothTripVariance: 0.000
    ReXmt:              0000000000       ReXmtCount:         0000000000
    DupACKs:            0000000000       RcvWnd:             0000262144
    SockOpt:            8C00             TcpTimer:           00
    TcpSig:             05               TcpSel:             40
    TcpDet:             F8               TcpPol:             00
    TcpPrf:             81               TcpPrf2:            22
    TcpPrf3:            00
    DelayAck:           Yes
    QOSPolicy:          No
    RoutingPolicy:      No
    ReceiveBufferSize:  0000262144       SendBufferSize:     0000262144
    ReceiveDataQueued:  0000000000
    SendDataQueued:     0000000000
    SendStalled:        No
    Ancillary Input Queue: N/A
----
Client Name: BBODMGR                  Client Id: 0000021D
  Local Socket: ::..9809
  Foreign Socket: ::..0
[...]
Resource Recovery Service (RRS)
RRS is used to guarantee transactional support.
For best throughput, use coupling facility (CF) logger for the RRS log.
Ensure that your CF logger configuration is optimal by using SMF 88 records.
Set adequate default values for the LOGR policy.
If you don't need the archive log, you should eliminate it since it can introduce extra DASD I/Os. The archive log contains the results of completed transactions. Normally, the archive log is not needed.
SVCDUMPs, SYSTDUMPs
Issue the following command to start dump processing:
/DUMP COMM='Dump Description'
83 IEE094D SPECIFY OPERAND(S) FOR DUMP COMMAND
You will use the number 83 (WTOR) in this case to reply to the system with dump parameters.
In order to reply to the system with the appropriate dump parameters, you need to know the address space ID of the address space you want to dump. There are other options for dumping address spaces; however, we are going to stick to 1 address space at a time using the method in this section. To find the ASIDX go to SDSF.DA (page right with F11).
The template for replying to a dump for a WebSphere address space: [xx],ASID=([yy]),SDATA=(RGN,TRT,CSA,NUC,PSA,GRSQ,LPA,SQA,SUM)
The reply to dump the servant ASIDX 16D is as follows (in SDSF.LOG):
/R 83,ASID=([16D]),SDATA=(RGN,TRT,CSA,NUC,PSA,GRSQ,LPA,SQA,SUM)After 2 minutes or so the following appears:
IEF196I IEF285I   SYS1.DUMP.D111011.T193242.S34.S00005         CATALOGED
IEF196I IEF285I   VOL SER NOS= XDUMP8.
IEA611I COMPLETE DUMP ON SYS1.DUMP.D111011.T193242.S34.S00005 646
The "complete dump on" dataset can be downloaded in binary.
svcdump.jar
svcdump.jar is an "AS IS" utility that can process SVCDUMPs and print various information: https://www14.software.ibm.com/webapp/iwm/web/preLogin.do?source=diagjava
Examples:
- Print threads: java -cp svcdump.jar com.ibm.zebedee.dtfj.PrintThreads <dumpname>
- Extract PHD heapdump: java -cp svcdump.jar com.ibm.zebedee.commands.Convert -a <asid>
Security
When a SAF (RACF or equivalent) class is active, the number of profiles in a class will affect the overall performance of the check. Placing these profiles in a (RACLISTed) memory table will improve the performance of the access checks. Audit controls on access checks also affect performance. Usually, you audit failures and not successes.
Use a minimum number of EJBROLEs on methods.
If using Secure Sockets Layer (SSL), select the lowest level of encryption consistent with your security requirements. WebSphere Application Server enables you to select which cipher suites you use. The cipher suites dictate the encryption strength of the connection. The higher the encryption strength, the greater the impact on performance.
Use the RACLIST to place into memory those items that can improve performance. Specifically, ensure that you RACLIST (if used): CBIND, EJBROLE, SERVER, STARTED, FACILITY, SURROGAT
If you are a heavy SSL user, ensure that you have appropriate hardware, such as PCI crypto cards, to speed up the handshake process.
Here's how you define the BPX.SAFFASTPATH facility class profile. This profile allows you to bypass SAF calls which can be used to audit successful shared file system accesses.
Define the facility class profile to RACF.
RDEFINE FACILITY BPX.SAFFASTPATH UACC(NONE)
Activate this change by doing one of the following:
re-IPL
invoke the SETOMVS or SET OMVS operator commands.Use VLF caching of the UIDs and GIDs
Do not enable global audit ALWAYS on the RACF (SAF) classes that control access to objects in the UNIX file system. If audit ALWAYS is specified in the SETR LOGOPTIONS for RACF classes DIRACC, DIRSRCH, FSOBJ or FSSEC, severe performance degradation occurs. If auditing is required, audit only failures using SETR LOGOPTIONS, and audit successes for only selected objects that require it. After changing the audit level on these classes, always verify that the change has not caused an unacceptable impact on response times and/or CPU usage.
Global Resource Serialization (GRS)
Check global resource contention: /D GRS,C
ISG343I 16.57.02 GRS STATUS 300
NO ENQ RESOURCE CONTENTION EXISTS
NO REQUESTS PENDING FOR ISGLOCK STRUCTURE
NO LATCH CONTENTION EXISTS
WebSphere Application Server for z/OS uses global resource serialization (GRS) to communicate information between servers in a sysplex... WebSphere Application Server for z/OS uses GRS to determine where the transaction is running.
WebSphere Application Server for z/OS uses GRS enqueues in the following situations: Two-phase commit transactions involving more than one server, HTTP sessions in memory, Stateful EJBs, "Sticky" transactions to keep track of pseudo-conversational states.
If you are not in a sysplex, you should configure GRS=NONE, or if you are in a sysplex, you should configure GRS=STAR. This requires configuring GRS to use the coupling facility.
z/VM
z/VM Recipe
- Enable CP Monitor and save data with MONWRITE.
- Consider using the optional priced z/VM Performance Toolkit.
Memory Overcommit
In this document, we will define [overcommit] as the total of the virtual memory of the started (logged on) virtual machines to the total real memory available to the z/VM system.
When planning whether memory can be overcommitted in a z/VM LPAR, the most important thing is to understand the usage pattern and characteristics of the applications, and to plan for the peak period of the day. This will allow you to plan the most effective strategy for utilizing your z/VM system's ability to overcommit memory while meeting application-based business requirements.
For z/VM LPARs where all started guests are heavily-used production WAS servers that are constantly active, no overcommitment of memory should be attempted.
In other cases where started guests experience some idle time, overcommitment of memory is possible.
zLinux
Although a bit old, review https://public.dhe.ibm.com/software/dw/linux390/perf/gm13-0635-00.pdf
Hardware Counters
It is generally recommended to activate HIS and collect hardware counters:
S HIS
MODIFY HIS,BEGIN,CTR=HDWR,CNTFILE=NO,CTRONLY
F HIS,B,TT=‘Text',CTRONLY,CTR=ALL,SI=SYNC,CNTFILE=NO
D HIS