AIX
AIX Recipe
- CPU core(s) should not be consistently saturated.
- Unless energy saving features are required, ensure Power Management is set to Maximum Performance mode.
- Generally, physical memory should never be saturated with computational memory and the operating system should not page computational memory out to disk.
- If you're not tight on RAM, tune Virtual Ethernet Adapter minimum and maximum buffers on all AIX LPARs (including VIO) to maximum possible values to avoid TCP retransmits.
- Test disabling TCP delayed ACKs
- Monitor for TCP retransmissions and test tuning TCP/IP network buffer sizes.
- Use
netstat -vto ensure that network switches are not sending PAUSE frames. - In some situations, enabling network dog threads on multi-processor nodes may avoid a network processing bottleneck with the default single-CPU interrupt processing model.
- Operating system level statistics and optionally process level statistics should be periodically monitored and saved for historical analysis.
- Review operating system logs for any errors, warnings, or high volumes of messages.
- Review snapshots of process activity, and for the largest users of resources, review per thread activity.
- If the operating system is running in a virtualized guest, review the configuration and whether or not resource allotments are changing dynamically.
- If there are firewall idle timeouts between two hosts on a LAN utilizing a connection pool (e.g. between WAS and a database), consider tuning TCP keep-alive parameters.
- Bind your processes properly based on system topology.
- Use MCM memory affinity where appropriate.
- Find the optimal SMT configuration for the machine.
- Find the optimal hardware prefetching setting for your workload.
- Consider AIX-specific tuning for Java applications.
- For large multi-threaded apps, use profiling to make sure that work is allocated equally amongst threads.
- For apps that use a lot of network I/O, tune networking parameters.
- For apps that make heavy use of native memory, experiment with and use the optimal malloc algorithm.
- Use profiling to evaluate the effects of tuning other parameters.
Also review the general topics in the Operating Systems chapter.
Documentation
https://www.ibm.com/docs/en/aix
General
Query AIX level:
$ oslevel
7.2.0.0
Kernel Parameters
The no
command is used to query or set kernel parameters. To display all
current values:
/usr/sbin/no -aTo update a value until the next reboot, use -o, for
example:
/usr/sbin/no -o tcp_nodelayack=1To persist the change across reboots, add the -r
flag:
/usr/sbin/no -r -o tcp_nodelayack=1Therefore, generally, both commands are run for each tunable to apply to the running system and for subsequent reboots.
Query the default value of a parameter using no -L:
$ no -L tcp_nodelayack
--------------------------------------------------------------------------------
NAME                      CUR    DEF    BOOT   MIN    MAX    UNIT
--------------------------------------------------------------------------------
tcp_nodelayack            0      0      0      0      1      boolean
--------------------------------------------------------------------------------
Central Processing Unit (CPU)
Query physical processor information:
$ prtconf
System Model: IBM,9119-FHB
Processor Type: PowerPC_POWER7
Number Of Processors: 2
Processor Clock Speed: 4004 MHz [...]
Use the lssrad
command to display processor and memory layout. For example:
$ lssrad -av
REF1   SRAD        MEM      CPU
0
          0   94957.94      0-47
Simultaneous Multithreading (SMT)
The smtctl
command may be used to query and change CPUs' SMT mode:
$ smtctl
This system supports up to 4 SMT threads per processor.
SMT is currently enabled...
proc0 has 4 SMT threads...
It is important to experiment and use the most optimal SMT setting based on the workload; higher value do not always improve performance:
Workloads that see the greatest simultaneous multithreading benefit are those that have a high Cycles Per Instruction (CPI) count. These workloads tend to use processor and memory resources poorly. Large CPIs are usually caused by high cache-miss rates from a large working set.
Workloads that do not benefit much from simultaneous multithreading are those in which the majority of individual software threads use a large amount of any resource in the processor or memory. For example, workloads that are floating-point intensive are likely to gain little from simultaneous multithreading and are the ones most likely to lose performance.
In addition, consider how
idling with SMT works and whether scaled throughput mode
(vpm_throughput_mode) might be better:
When a single logical CPU (SMT thread) of a virtual processor is used by a logical partition, the rest of the logical CPUs (SMT threads) of this virtual processor remain free and ready for extra workload for this logical partition. Those free logical CPUs are reflected as %idle CPU time until they get busy, and they won't be available at that time for other logical partitions.
CPU Terminology
See the discussion of CPU core(s) as background.
- Physical Processor: An IBM Power CPU core.
- Virtual Processor: The logical equivalent of a Physical Processor, although the underlying Physical Processor may change over time for a given Virtual Processor.
- Logical Processor: If SMT is disabled, a Virtual Processor. If SMT is enabled, an SMT thread in the Virtual Processor.
Micro-Partioning
The LPAR always sees the number of CPUs as reported by "Online
Virtual CPUs" in lparstat -i:
$ lparstat -i
Type                                       : Shared-SMT-4
Mode                                       : Uncapped
Entitled Capacity                          : 0.20
Online Virtual CPUs                        : 2
[...]
We generally recommend setting (Virtual CPUs) / (Physical CPUs) <= 3 for Power7, for example, ideally 1-2. Also note that a virtual processor may be a CPU core thread rather than a CPU core. Review the Operating Systems chapter for background on CPU allocation.
If the LPAR is capped, it can only use up to its entitlement, spread across the online virtual CPUs. In general, if using capped LPARs, it's recommended to set entitlement equal to online virtual CPUs. If the LPAR is uncapped, it can use up to all of the online virtual CPUs, if available.
Consider the overhead of micro-partitioning:
The benefit of Micro-Partitioning is that it allows for increased overall utilization of system resources by applying only the required amount of processor resource needed by each partition. But due to the overhead associated with maintaining online virtual processors, consider the capacity requirements when choosing values for the attributes.
For optimal performance, ensure that you create the minimal amount of partitions, which decreases the overhead of scheduling virtual processors.
CPU-intensive applications, like high performance computing applications, might not be suitable for a Micro-Partitioning environment. If an application uses most of its entitled processing capacity during execution, you should use a dedicated processor partition to handle the demands of the application.
Even if using uncapped, entitled capacity should generally not exceed
100% because the lack of processor affinity may
cause performance problems. Use mpstat
to review processor affinity.
For PowerVM, a dedicated partition is preferred over a shared partition or a workload partition for the system under test.
Processor folding
By default, CPU folding occurs in both capped and uncapped modes,
with the purpose
being to increase CPU cache hits. In general, CPU folding should not
be disabled, but low values of CPU folding may indicate low entitlement.
Consider testing with folding disabled using schedo:
schedo -o vpm_xvcpus=-1vmstat
lparstat
may be used to query processor usage; for example:
$ lparstat 30 2
System configuration: type=Shared mode=Uncapped smt=4 lcpu=48 mem=131072MB psize=42 ent=5.00

%user  %sys  %wait  %idle physc %entc  lbusy  vcsw phint  %nsp  %utcyc
----- ----- ------ ------ ----- ----- ------ ----- ----- -----  ------
 12.7   9.3    0.0   78.0  2.88  57.5    6.3 12915     0   144  30.34
  9.2  13.0    0.0   77.7  2.44  48.8    6.5 10584     0   141  29.27
Key things to look at:
- ent (Entitled Capacity): This is in the first line of output above the statistics. The baseline fraction of physical processor cores guaranteed to this specific LPAR by the hypervisor.
- physc (Physical Processors Consumed): The actual fraction of physical CPU cores the LPAR consumed during that interval. This is read as the number of CPUs; in the above example, the first row shows that 2.88 CPUs were used.
- %entc (Percentage of Entitlement Consumed): Calculated as (physc / ent) * 100. This reveals how much of your guaranteed pool you are using. This is read as a percentage of entitled capacity; in the above example, the first row shows that 57.5% of the entitled capacity was used.
- app (Available Physical Processors): If available, the number of unused cores left in the shared processor pool. If this drops close to zero, uncapped LPARs will struggle to borrow extra performance.
If the percent of entitled capacity is consistantly greater than ~80%, this could lead to performance issues.
vmstat
vmstat
may be used to query processor usage; for example:
$ vmstat -tw 30 2
System configuration: lcpu=8 mem=8192MB ent=0.20
  kthr          memory                         page                       faults                 cpu             time
------- --------------------- ------------------------------------ ------------------ ----------------------- --------
  r   b        avm        fre    re    pi    po    fr     sr    cy    in     sy    cs us sy id wa    pc    ec hr mi se
  9   0     934618     485931     0     0     0     0      0     0    18   2497  1299  4 12 84  0  0.06  27.5 11:49:44
  6   0     934629     485919     0     0     0     0      0     0    21  13938  3162 56 11 32  0  0.29 142.9 11:50:14
Key things to look at:
- The "System configuration" line will report the number of logical CPUs (in this example, 8), which may be more than the number of physical CPUs (due to SMT).
r: This is the run queue which is the sum of the number of threads currently running on the CPUs plus the number of threads waiting to run on the CPUs. This number should rarely go above the number of logical CPUs.b: This is the number of threads which are blocked, usually waiting for I/O, and should usually be zero.pi/po: Pages in and pages out, respectively, should usually be zero (pi in particular).us/sy/id/wa: These report the processor usage in different dimensions.pc: This reports the processor usage as a fraction of the number of physical CPUs. This is read as the number of CPUs; in the above example, the first row shows that 0.06 CPUs were used and in the second row, 0.29 CPUs were used which exceeds the 0.20 entitled (first line of the vmstat output).ec: This reports the processor usage as a fraction of the number of entitled CPUs. This is read as a percentage of entitled capacity; in the above example, the first row shows that 27.5% of the entitled capacity was used and in the second row, entitled capacity was exceeded by 42.9%.
If the percent of entitled capacity is consistantly greater than ~80%, this could lead to performance issues.
topas
topas
may be used to query system resource usage.
nmon
nmon
may be used to query system resource usage.
To run nmon during an issue, review the AIX nmon Recipe.
When using the -f option, nmon will run in
the background so explicitly putting it into the background (using
&) is not necessary. This will create a file with the
name $HOST_$STARTDAY_$STARTTIME.nmon
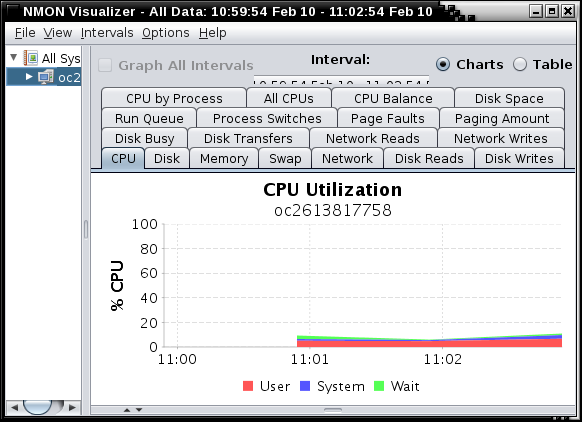
Consider loading nmon files into the NMONVisualizer
tool. Note that AIX nmon defaults to the local timezone (unless
-G is used for UTC), so the local time zone should be
selected when loading in NMONVisualizer.

There is also a Microsoft Excel spreadsheet visualizer tool named Nmon-Analyser.
PoolIdle 0
If nmon shows an LPAR PoolIdle value of 0, then the POWER HMC "Allow performance information collection" option is disabled. Most customers have this enabled in production. Enable this by selecting "Allow performance information collection".
tprof
tprof
may be used as a lightweight, native CPU sampling profiler; for
example:
LDR_CNTRL=MAXDATA=0x80000000 tprof -Rskeuj -x sleep 60Output will go to sleep.prof; for example:
Process                            FREQ  Total Kernel   User Shared  Other
=======                            ====  ===== ======   ==== ======  =====
wait                                  8  30387  30387      0      0      0
java                                 34  17533   9794      0   7277    462
/usr/sbin/syncd                       2     91     91      0      0      0
/usr/bin/tprof                        3      4      4      0      0      0
PID-1                                 1      2      2      0      0      0
/usr/bin/trcstop                      1      1      0      0      1      0
=======                            ====  ===== ======   ==== ======  =====
Total                                54  48023  40283      0   7278    462
The Kernel column is subset of the total samples that
were in system calls, User in user programs,
Shared in shared libraries. For Java, Shared
represents the JVM itself (e.g. GC) or running JNI code, and
Other represents Java methods. Total sampled CPU usage of
all Java processes is the Total column of the
java processes divided by the Total column of
the Total row (for example,
(17533/48023)*100 = 36.5%).
By default, tprof does not provide method names for Java
user code samples (seen as hexadecimal addresses in
SEGMENT-N sections). AIX ships with a JVMTI agent
(libjpa) that allows tprof to see method
names; however, if you've isolated the processor usage in
tprof to user Java code, then it is generally better to use
a profiler such as Health
Center instead. Nevertheless, to use the AIX Java agent, use the
-agentlib:jpa64 argument.
Per-thread CPU usage
tprof output also has a per-thread CPU section; for
example:
Process                 PID      TID  Total Kernel   User Shared  Other
=======                 ===      ===  ===== ======   ==== ======  =====
wait                  53274    61471   4262   4262      0      0      0
wait                  61470    69667   3215   3215      0      0      0
java                 413760   872459   1208    545      0    647     16
java                 413760   925875    964      9      0    955      0
java                 413760   790723    759     12      0    747      0  [...]
This is the same braekdown as for the previous section but on a
thread-based (TID). Review whether particular threads are
consuming most of the CPU or if CPU usage is spread across threads. If a
thread dump was taken, convert the TID to hexadecimal and
search for it in the javacore.
CPU Utilization Reporting Tool (curt)
The curt
tool converts kernel trace data into exact CPU utilization for a period
of time. First, generate
curt data and then review
it.
perfpmr.sh
perfpmr
is a utility used by AIX support for AIX performance issues; for
example:
perfpmr.sh 600The number of seconds passed (in the above example, 600)
is not the duration for the entire script, but the maximum for parts of
it (e.g. tcpdump, filemon, etc.). For the
generally recommended option value of 600, the total duration will be
about 30 minutes; for the minimum option value of 60, the total duration
of the script will be about 10 minutes.
Review processor affinity
To search for processor affinity statistics, run:
curt -i trace.tr -n trace.syms -est -r PURR -o curt.outThen review curt.out. The report is split up into
system, per-CPU, and per-thread analysis. For each thread (section
starts with "Report for Thread Id"), find the "processor affinity:"
line.
grep "processor affinity:" curt.outThe ideal affinity is 1.0 (meaning that the virtual processor is always going back to the same physical processor, thus maximizing cache hits, etc.) and the worst affinity is 0. Affinity may be low if a partition is above its entitlement and the shared processor pool does not have extra capacity or is in flux, because the partition will constantly have to take cycles from other processors.
Perform this before the performance problem occurs (under full load) and during the problem and compare the affinities. If affinity decreased during the problem, then the lack of entitlement may be making things worse. Be careful with cause and effect here: it's unlikely (though possible) that the decreased affinity in and of itself caused the problem, but instead was a secondary symptom that made things worse.
Processor affinity may be worse depending on the "spread" over the physical processors with a large number of configured virtual processors. Recent versions of AIX introduced processor folding which tries to optimize the use of the least number of virtual processors both to increase affinity and to decrease processor management overhead. Nevertheless, it may help to have the number of virtual processors not much higher than the entitled capacity or the effectively used capacity (see the processor folding section on how to calculate virtual processors).
Process system trace
One interesting thing to do is process the system trace:
perfpmr.sh -x trace.sh -rThis creates a file name trace.int; then, for example,
find all file system system calls:
grep java trace.int | grep lookuppnIf you see a lot of activity to the /dev/null device;
for example:
107 -6947396- 64 14288867 2.183578 lookuppn exit: '/dev/null' = vnode F1000A03000D1130Though this is to the bit bucket, it will cause the inode for the
/dev/null device to be update its access times and
modification times. To make this more efficient, run the following
dynamic command:
raso -p -o devnull_lazytime=1truss
truss
traces system calls; however, it may have a large performance
overhead:
truss -d -i -s\!all -o truss.out -p $PIDExample to trace a failing telnet:
truss -d -a -f -l -X -o truss_$(hostname)_$(date +"%Y%m%d_%H%M%S").txt telnet $DESTINATIONPhysical Memory (RAM)
lsps
may be used to query page spaces:
$ lsps -a
Page Space      Physical Volume   Volume Group    Size %Used Active  Auto  Type Chksum
hd6             hdisk0            rootvg        1024MB     2    yes   yes    lv      0
Consider testing with explicit large pages.
vmstat
When the physical memory is full, paging (also known as swapping) occurs to provide additional memory. Paging consists of writing the contents of physical memory to disk, making the physical memory available for use by applications. The least recently used information is moved first. Paging is expensive in terms of performance because, when the required information is stored on disk it must be loaded back into physical memory, which is a slow process.
Where paging occurs, Java applications are impacted because of garbage collection. Garbage collection requires every part of the Java heap to be read. If any of the Java heap has been paged out, it must be paged back when garbage collection runs, slowing down the garbage collection process.
The vmstat output shows whether paging was taking place when the problem occurred. vmstat output has the following format:
kthr     memory             page              faults        cpu        time
----- ----------- ------------------------ ------------ ----------- --------
r  b   avm   fre  re  pi  po  fr   sr  cy  in   sy  cs us sy id wa hr mi se
0  0 45483   221   0   0   0   0    1   0 224  326 362 24  7 69  0 15:10:22
0  0 45483   220   0   0   0   0    0   0 159   83  53  1  1 98  0 15:10:23
2  0 45483   220   0   0   0   0    0   0 145  115  46  0  9 90  1 15:10:24
The columns of interest are pi and po (page
in and page out) for AIX. Non-zero values indicate that paging is taking
place.
svmon
svmon
may be used to review memory usage in detail. Unless otherwise noted,
numbers such as inuse and virtual are in numbers of frames, which are
always 4KB each, even if there are differently sized pages involved.
Example output for global statistics:
$ svmon -G
               size      inuse       free        pin    virtual
memory       524288     297790     226498      63497     107144
pg space     131072        257

               work       pers       clnt
pin           63497          0          0
in use       107144     164988      25658
The values in the svmon -G output have the following meanings:
memory: pages of physical memory (RAM) in the systempg space: pages of paging space (swap space) in the systempin: pages which can only be stored in physical memory and may not be paged to diskin use: pages which are currently backed by physical memory
Columns
size: the total size of the resourceinuse: the number of pages which are currently being usedfree: the number of pages which are currently not being usedpin: the number of pages which are currently in use that can only be stored in physical memory and may not be stolen bylrudvirtual: the number of pages that have been allocated in the process virtual spacework: the number of pages being used for application datapers: the number of pages being used to cache local files (e.g. JFS)clnt: the number of pages being used to cache NFS/JFS2/Veritas/etc. files
Memory inuse on the first row is the physical memory
being used. This is split on the second section between
work for processes, pers for file cache (e.g.
JFS) and clnt for NFS/JFS2/Veritas/etc. file cache. Total
file cache size can be determined by adding pers and
clnt inuse values.
If the memory inuse value is equal to the memory
size value, then all the physical memory is being used.
Some of this memory will most likely be used to cache file system data
as the AIX kernel allows file caching to use up to 80% of the physical
memory by default. Whilst file caching should be released before paging
out application data, depending on system demand the application memory
pages may be swapped out. This maximum usage of the physical memory by
file caching can be configured using the AIX vmtune command
along with the the minperm and maxperm values.
In addition, it is recommended that you set strict_maxperm
to 1 in order to prevent AIX from overriding the maxperm
setting.
If all the physical memory is being used, and all or the majority of the in use memory shown in the second section is for work pages, then the amount of physical memory should be increased. It is suggested that the rate of increase be similar to the amount of paging space used (see pg space inuse value).
Notes:
- 32-bit processes have up to 16 segments of 256MB each.
- 64-bit processes have up to 2^36 segments of 256MB each.
- Physical memory pages are called memory frames.
- The VSID is a system-wide segment ID. If two processes are referencing the same VSID, then they are sharing the same memory.
- The ESID (effective segment ID) is a process level segment ID. A
typical virtual address, e.g.
0xF1000600035A6C00, starts with the segment and the last 7 hex digits are the page/offset. - Larger page sizes may reduce page faults and are more efficient for addressing, but may increase overall process size due to memory holes.
- Dynamic page promotion occurs when a set of contiguous pages (e.g.
4K) add up to a page of the next higher size (e.g. 16 4K pages = one 64K
page). This is done by
psmd(Page Size Management Daemon). mbufmemory is network-related memory usage.
32-bit Memory Model
The 32-bit AIX virtual memory space is split into 16, 256MB segments
(0x0 - 0x15). Segment 0x0 is always reserved for the kernel. Segment 0x1
is always reserved for the executable code (e.g. java). The
rest of the segments may be laid out in different ways depending on the
LDR_CNTRL=MAXDATA environment variable or the
maxdata parameter compiled in the executable.
By default, IBM Java and Semeru Java will choose a generally appropriate MAXDATA value depending on -Xmx. Potential options:
-Xmx> 3GB:MAXDATA=0@DSA= 3.5GB user space, 256MB malloc, 3.25GB mmap- 2.25GB <
-Xmx<= 3GB:MAXDATA=0XB0000000@DSA= 3.25GB user space, malloc grows up, mmap grows down -Xmx<= 2.25GB:MAXDATA=0XA0000000@DSA= 2.75GB user space, malloc grows up, mmap grows down, shared libraries in 0xD and 0xFMAXDATA=0@DSAis not very practical because it only leaves a single segment for native heap (malloc) which is usually insufficient
If you need more native memory (i.e. native OOM but not a leak), and
your -Xmx is less than 2.25GB, explicitly setting
0xB@DSA may be useful by increasing available native memory
by approximately 400MB to 600MB. This causes the shared/mapped storage
to start at 0xF and grow down. The cost is that shared libraries are
loaded privately which increases system-wide virtual memory load (and
thus potentially physical memory requirements). If you change X JVMs on
one machine to the 0xB@DSA memory model, then the total
virtual and real memory usage of that machine may increase by up to
(N*(X-1)) MB, where N is the size of the
shared libraries' code and data. Typically, for stock WebSphere
Application Server, N is about 50MB to 100MB. The change should not
significantly affect performance, assuming you have enough additional
physical memory.
Another effect of changing to the 0xB@DSA memory model
is that segment 0xE is no longer available for
mmap/shmat, but instead those allocations grow
down in the same way as the Java heap. If your -Xmx is a
multiple of 256MB (1 segment), and your process uses
mmap/shmat (e.g. client files), then you will
have one less segment for native memory. This is because native memory
allocations (malloc) cannot share segments with
mmap/shmat (Java heap, client files, etc.). To
fully maximize this last segment for native memory, you can calculate
the maximum amount of memory that is
mmap'ped/shmat'ed at any one time using
svmon (find mmap'ped sources other than the
Java heap and clnt files), and then subtract this amount
from -Xmx. -Xmx is not required to be a
multiple of 256MB, and making room available in the final segment may
allow the mmap'ped/shmat'ted allocations to be
shared with the final segment of the Java heap, leaving the next segment
for native memory. This only works if said
mmaps/shmats are not made to particular
addresses.
When setting MAXDATA for Java, set both
LDR_CNTRL and IBM_JVM_LDR_CNTRL_NEW_VALUE
envars.
Java
Consider AIX environment variable tuning for Java applications:
AIXTHREAD_SCOPE=S
The default value for this variable is S, which signifies system-wide contention scope (1:1).AIXTHREAD_MUTEX_DEBUG=OFF
Maintains a list of active mutexes for use by the debugger.AIXTHREAD_COND_DEBUG=OFF
Maintains a list of condition variables for use by the debugger.AIXTHREAD_RWLOCK_DEBUG=OFF
Maintains a list of active mutual exclusion locks, condition variables, and read-write locks for use by the debugger. When a lock is initialized, it is added to the list if it is not there already. This list is implemented as a linked list, so searching it to determine if a lock is present or not has a performance implication when the list gets large. The problem is compounded by the fact that the list is protected by a lock, which is held for the duration of the search operation. Other calls to the pthread_mutex_init() subroutine must wait while the search is completed. For optimal performance, you should set the value of this thread-debug option to OFF. Their default is ON.SPINLOOPTIME=500
Number of times that a process can spin on a busy lock before blocking. This value is set to 40 by default. If the tprof command output indicates high CPU usage for the check_lock routine, and if locks are usually available within a short amount of time, you should increase the spin time by setting the value to 500 or higher.
Input/Output (I/O)
Disk
Consider mounting with
noatime:
For filesystems with a high rate of file access, performance can be improved by disabling the update of the access time stamp. This option can be added to a filesystem by using the "-o noatime" mount option, or permanently set using "chfs -a options=noatime."
iostat
Investigate disk performance using iostat.
Start iostat:
nohup iostat -DRlT 10 >iostat.txt 2>&1 &Stop iostat:
kill $(ps -ef | grep iostat | grep -v grep | awk '{print $2}')Example iostat output:
System configuration: lcpu=56 drives=2 paths=8 vdisks=0

Disks:               xfers                                read                                write                                  queue                    time
-------- -------------------------------- ------------------------------------ ------------------------------------ -------------------------------------- ---------
           %tm    bps   tps  bread  bwrtn   rps    avg    min    max time fail   wps    avg    min    max time fail    avg    min    max   avg   avg  serv
           act                                    serv   serv   serv outs              serv   serv   serv outs        time   time   time  wqsz  sqsz qfull
hdisk0     0.1  86.4K   2.3   0.0   86.4K   0.0   0.0    0.0    0.0     0    0   2.3   0.5    0.3    1.2     0    0   0.0    0.0    0.0    0.0   0.0   0.0  03:54:59
hdisk1     0.0  86.4K   2.3   0.0   86.4K   0.0   0.0    0.0    0.0     0    0   2.3   0.4    0.3    0.8     0    0   0.0    0.0    0.0    0.0   0.0   0.0  03:54:59

Disks:               xfers                                read                                write                                  queue                    time
-------- -------------------------------- ------------------------------------ ------------------------------------ -------------------------------------- ---------
           %tm    bps   tps  bread  bwrtn   rps    avg    min    max time fail   wps    avg    min    max time fail    avg    min    max   avg   avg  serv
           act                                    serv   serv   serv outs              serv   serv   serv outs        time   time   time  wqsz  sqsz qfull
hdisk0     0.9 133.2K  21.3   0.0  133.2K   0.0   0.0    0.0    0.0     0    0  21.3   0.3    0.3    0.9     0    0   0.0    0.0    0.0    0.0   0.0   0.0  03:55:09
hdisk1     0.9 133.2K  21.3   0.0  133.2K   0.0   0.0    0.0    0.0     0    0  21.3   0.3    0.2    0.8     0    0   0.0    0.0    0.0    0.0   0.0   0.0  03:55:09
Review how
to interpret iostat. The key metric is
%tm_act which reports the percent of time spent waiting
on that disk for that period.
inode cache
Here are considerations about the inode cache from an AIX expert:
The ioo settings for j2 inode cache and meta data cache sizes need to be evaluated on a case by case basis. Determine if the values are too high by comparing the number of client segments in the
svmon -Soutput with the number of unused segments. Also consider the absolute number of client segments. As files are opened, we expect these numbers to go up. Do not adjust anything unless the number of client segments exceeds about 250,000 and the number of unused segments is greater than about 95%. In most cases, reduce them to 100 each.
Such a change may be done with:
ioo -p -o j2_inodeCacheSize=100 -o j2_metadataCacheSize=100Networking
Network interfaces
Query network interfaces:
$ ifconfig -a
en0: flags=1e080863,480<UP,BROADCAST,NOTRAILERS,RUNNING,SIMPLEX,MULTICAST,GROUPRT,64BIT,CHECKSUM_OFFLOAD(ACTIVE),CHAIN>
        inet 10.20.30.10 netmask 0xffffff00 broadcast 10.20.30.1
        tcp_sendspace 262144 tcp_recvspace 262144 rfc1323 1
Query the Maximum Transmission Unit (MTU) of a network adapter:
$ lsattr -El en0 | grep "^mtu"
mtu           1500         Maximum IP Packet Size for This Device     True
Review common kernel tuning based on the interface type and MTU size of the adapter.
If dedicated network adapters are set up for inter-LPAR network traffic, recent versions of AIX support super jumbo frames up to 65280 bytes:
chdev -l en1 -a mtu=65280Interface speed
Query the maximum speed of each interface with entstat;
for example:
$ entstat -d en0
Media Speed Selected: Autonegotiate
Media Speed Running: 10000 Mbps / 10 Gbps, Full Duplex
Also, in general, review that auto negotiation of duplex mode is configured.
Also consider jumbo frames on gigabit ethernet interfaces.
Interface statistics
Use netstat -I
to show per-interface statistics; for example:
$ netstat -I en0
Name   Mtu   Network     Address        Ipkts     Ierrs        Opkts     Oerrs  Coll
en40   1500  link#2      10.20.30.1   4840798     0          9107485     0      0
An additional parameter may be passed as the number of seconds to update the statistics:
$ netstat -I en0 5
    input (en0)       output           input   (Total)         output
  packets  errs  packets  errs colls   packets  errs    packets  errs colls
158479802     0 21545659     0     0 178974399     0   42040363     0     0
      25      0        1     0     0        29     0          5     0     0
      20      0        4     0     0        22     0          6     0     0
Ethernet statistics
Use the netstat -v
command to check for Packets Dropped: 0,
Hypervisor Send Failures,
Hypervisor Receive Failures, and
Receive Buffer; for example:
$ netstat -v
[...]
Hypervisor Send Failures: 0
Hypervisor Receive Failures: 0
Packets Dropped: 0
[...]
Receive Information
  Receive Buffers
    Buffer Type              Tiny    Small   Medium    Large     Huge
    Min Buffers               512      512      128       24       24
    Max Buffers              2048     2048      256       64       64
    Allocated                 512      512      128       24       24
    Registered                512      512      128       24       24
    History
      Max Allocated           512     1138      128       24       24
      Lowest Registered       506      502      128       24       24
If Max Allocated for a column is greater than
Min Buffers for that column, this may cause reduced
performance. Increase the buffer minimum using, for example:
chdev -P -l ${INTERFACE} -a min_buf_small=2048If Max Allocated for a column is equal to
Max Buffers for that column, this may cause dropped
packets. Increase the buffer maximum using, for example:
chdev -P -l ${INTERFACE} -a max_buf_small=2048It is necessary to bring down the network interface(s) and network device(s) changed by the above commands and then restart those devices and interfaces. Some customers prefer to simply reboot the LPAR after running the command(s).
Kernel network buffers
The netstat -m
command can be used to query mbuf kernel network buffers;
for example:
$ netstat -m
Kernel malloc statistics:
******* CPU 0 *******
By size           inuse     calls failed   delayed    free   hiwat   freed
64                  778  16552907      0        13     182   10484       0
128                 521   1507449      0        16     183    5242       0 [...]
The failed and delayed columns should be
zero.
Hostname resolution
For hostname resolution, by default, DNS is tried before
/etc/hosts, unless DNS is not set up (no
/etc/resolv.conf file). If you would like to optimize DNS
lookup by placing entries into /etc/hosts, then consider changing
the order of hostname lookup, either through
/etc/irs.conf or the environment variable
NSORDER.
Test network throughput
Network throughput may be tested with FTP:
ftp> put "|dd if=/dev/zero bs=64k count=100000" /dev/null
200 PORT command successful.
150 Opening data connection for /dev/null.
100000+0 records in.
100000+0 records out.
226 Transfer complete.
6553600000 bytes sent in 170.2 seconds (3.761e+04 Kbytes/s)
local: |dd if=/dev/zero bs=64k count=100000 remote: /dev/null
TCP Delayed Acknowledgments
TCP delayed acknowledgments (delayed ACKs) are generally recommended to be disabled if there is sufficient network and CPU capacity for the potential added ACK-only packet load.
To see if a node is delaying ACKs, review netstat -s for
the "N delayed" value; for example:
$ netstat -s | grep "delayed)"
                13973067635 ack-only packets (340783 delayed)
To dynamically disable delayed ACKs without persisting it through reboots:
/usr/sbin/no -o tcp_nodelayack=1To permanently disable delayed ACKs (and also apply it dynamically immediately):
/usr/sbin/no -p -o tcp_nodelayack=1TCP Congestion Control
Monitor for TCP retransmissions. In most modern, internal (LAN)
networks, a healthy network should not have any TCP retransmissions. If
it does, you've likely got a problem. Use a tool like netstat
to watch for retransmissions. For example, periodically run the
following command and monitor for increases in the values:
$ netstat -s -p tcp | grep retrans
        1583979 data packets (9088131222 bytes) retransmitted
        15007 path MTU discovery terminations due to retransmits
        185201 retransmit timeouts
        34466 fast retransmits
        344489 newreno retransmits
        7 times avoided false fast retransmits
        0 TCP checksum offload disabled during retransmit
If you observe retransmissions, engage your network team and AIX
support (if needed) to review whether the retransmission are true
retransmissions or not and to investigate the cause(s). One common cause
is a saturation of AIX
OS TCP buffers and you may consider testing tuning such as the
following using the no
command; for example:
no -o tcp_sendspace=524176
no -r -o tcp_sendspace=524176
no -o tcp_recvspace=524176
no -r -o tcp_recvspace=524176
no -o sb_max=1048352
no -r -o sb_max=1048352
Review advanced network tuning.
Virtual Ethernet Adapter (VEA)
View VEA Buffer Sizes
Display VEA adapter buffers (min_buf* and
max_buf*). Example:
$ lsattr -E -l ent0
--------------------
alt_addr        0x000000000000 Alternate Ethernet Address                 True
buf_mode        min            Receive Buffer Mode                        True
chksum_offload  yes            Enable Checksum Offload for IPv4 packets   True
copy_buffs      32             Transmit Copy Buffers                      True
copy_bytes      65536          Transmit Copy Buffer Size                  True
desired_mapmem  0              I/O memory entitlement reserved for device False
ipv6_offload    no             Enable Checksum Offload for IPv6 packets   True
max_buf_control 64             Maximum Control Buffers                    True
max_buf_huge    128            Maximum Huge Buffers                       True
max_buf_large   256            Maximum Large Buffers                      True
max_buf_medium  2048           Maximum Medium Buffers                     True
max_buf_small   4096           Maximum Small Buffers                      True
max_buf_tiny    4096           Maximum Tiny Buffers                       True
min_buf_control 24             Minimum Control Buffers                    True
min_buf_huge    128            Minimum Huge Buffers                       True
min_buf_large   256            Minimum Large Buffers                      True
min_buf_medium  2048           Minimum Medium Buffers                     True
min_buf_small   4096           Minimum Small Buffers                      True
min_buf_tiny    4096           Minimum Tiny Buffers                       True
Monitor for potential VEA buffer size issues
Hypervisor
send and receive failures record various types of errors sending and
receiving TCP packets which may include TCP retransmissions and other
issues. As with TCP retransmissions, they should generally be 0 and are
relatively easy to monitor using netstat (or
entstat):
$ netstat -v | grep "Hypervisor.*Failure"
Hypervisor Send Failures: 0
Hypervisor Receive Failures: 14616351
The last line above is for receiving buffers and if that counter increases often, then it may be due to insufficient VEA buffers. These buffers are given to the hypervisor by the VEA driver so that the VIOS or other LPARs in the same frame can send packets to this LPAR.
The Send Failures is when sending packets out of ths
LPAR to the remote LPAR (either the VIOS or another LPAR in the same
frame). If you get Receive Failures under the
Send Failures section, then it's the other LPAR which is
running out. If you get Send errors, then it's something
going on with this local LPAR.
These are often caused by insufficient Virtual Ethernet Adapter (VEA) buffers so you may consider tuning them to their maximum values as there is little downside other than increased memory usage.
Insufficient virtual ethernet adapter buffers may cause TCP
retransmits. A symptom of this might be when a non-blocking
write appears to block with low CPU, whereas it would
normally block in poll.
Change Virtual Ethernet Adapter Buffers
The min values specify how many buffers are preallocated. Max is the upper limit on buffers that can be allocated dyamically as needed. Once not needed any more, they are freed. However in bursty situations, AIX may not be able to dynamically allocate buffers fast enough so that could risk dropping packets, so many tune both min and max values to the max that they can be.
There is little downside to using maximum values other than memory usage. Here are the sizes of the buffers used depending on the packet size:
- Tiny: 512 bytes
- Small: 2048 bytes
- Medium: 16384 bytes
- Large: 32768 bytes
- Huge: 65536 bytes
If the smaller buffers run out, then the larger buffers can be borrowed by the VEA driver temporarily.
Review the maximum value for each parameter. For example:
$ lsattr -R -l ent0 -a max_buf_small
512...4096 (+1)
Use the chdev
command to change the buffer sizes. For example:
chdev -P -l ent0 -a max_buf_small=4096Perform this for the following:
min_buf_tinymax_buf_tinymin_buf_smallmax_buf_smallmin_buf_mediummax_buf_mediummin_buf_largemax_buf_largemin_buf_hugemax_buf_huge
Changing the virtual ethernet adapter buffers requires rebooting the node.
PAUSE Frames
If ethernet flow control is enabled, in general, a healthy network
should show no increase in PAUSE frames
(e.g. from network switches). Monitor the number of XOFF
counters (PAUSE ON frame). For example:
$ netstat -v | grep -i xoff
        Number of XOFF packets transmitted: 0
        Number of XOFF packets received: 0
        Number of XOFF packets transmitted: 0
        Number of XOFF packets received: 0
        Number of XOFF packets transmitted: 0
        Number of XOFF packets received: 0
        Number of XOFF packets transmitted: 0
        Number of XOFF packets received: 0
This is also available in netstat.int in a perfpmr collection and search for
Number of Pause ON Frames. For example:
$ awk '/Time .* run/ { print; } /ETHERNET STATISTICS/ { interface=$3; gsub(/\(|\)/, "", interface); } /Number of Pause ON Frames Received/ { print interface " " $0; }' netstat.int
Time before run:   Sat Nov 14 02:33:49 EST 2020
ent0    Number of Pause ON Frames Received: 68491
ent4    Number of Pause ON Frames Received: 48551
ent2    Number of Pause ON Frames Received: 0
ent6    Number of Pause ON Frames Received: 0
ent3    Number of Pause ON Frames Received: 2945314679
ent5    Number of Pause ON Frames Received: 278601624
Time after run :   Sat Nov 14 02:38:49 EST 2020
ent0    Number of Pause ON Frames Received: 68491
ent4    Number of Pause ON Frames Received: 48551
ent2    Number of Pause ON Frames Received: 0
ent6    Number of Pause ON Frames Received: 0
ent3    Number of Pause ON Frames Received: 2945317182
ent5    Number of Pause ON Frames Received: 278606502
Dog threads
Enabling dog threads on a multi-CPU system may increase network processing throughput by distributing packet processing across multiple CPUs, although it may also increase latency.
Symptoms that dog threads are worth considering include CPU saturation of the default single processor handling the interrupts and/or a large number of Hypervisor Receive Failures. The latter may also be caused by insufficient Virtual Ethernet Adapter buffers, so ensure those are increased before investigating dog threads.
This feature should be tested and evaluated carefully as it has some potential costs as discussed in the documentation.
Example enabling dog threads:
ifconfig en0 threadExample specifying the number of CPUs to use:
no -o ndogthreads=1In general, test a low number and increase it as needed. Using 0 will use all available CPUs up to a maximum of 256.
Review the processing that the threads are doing using
netstat -s. For example:
$ netstat -s| grep hread
352 packets processed by threads
0 packets dropped by threads
ARP Table
The Address Resolution Protocol (ARP) table is a fixed size table for ARP entries. If it shows evidence of being purged, then it may be increased.
Use netstat -p arp to check if ARP entries are being
purged:
$ netstat -p arp
arp:
        1633 packets sent
        0 packets purged
The buckets may be displayed with arp -a.
There is a number of table buckets (arptab_nb; default 149)
and a per-bucket size (arptab_bsiz; default 7). If ARP
entries are being purged, test increasing
the size of the bucket with no.
$ no -o arptab_bsiz=10
$ no -r -o arptab_bsiz=10
TCP Traffic Regulation
Recent versions of AIX include a TCP Traffic Regulation (TR) feature
which is designed to protect against network attacks. By default it is
off, but security hardening commands such as aixpert may
enable it indirectly. If you are experiencing mysterious connection
resets at high load, this may be working as designed and you can tune or
disable this function using the tcptr
command.
Interrupt coalescing
By default, multiple arriving packets are coalesced into a fewer
number of interrupts using interrupt
coalescing/moderation to reduce interrupt overhead. Under light
loads, this may introduce latency. Consider testing different values of
rx_int_delay to find the best option.
TIME_WAIT
TIME_WAIT is
a normal TCP socket state after a socket is closed. In case this
duration becomes a bottleneck, consider reducing the wait amount (in
15-second intervals; i.e. 1 = 15 seconds):
$ no -o tcp_timewait=1
$ no -r -o tcp_timewait=1
iptrace
Capture network packets using iptrace.
Note: iptrace may have a significant
performance overhead (up to ~50%) unless -S is used to
limit the maximum captured bytes per packet. In general, test
iptrace overhead under load before long-term use. It's also
important that the file name is always the last argument after any
flags.
Start capturing all traffic with no limits:
startsrc -s iptrace "-a -b -B /tmp/aixiptrace.bin"To creating rolling output files, use the -L $bytes
option which will roll to a single historical file. For example, the
following limits to 2GB per file, so with one historical file, that's up
to 4GB total. There is no way to create more than one historical
file.
startsrc -s iptrace "-a -b -B -L 2147483648 /tmp/aixiptrace.bin"To limit the bytes captured per packet (and thus reduce the overhead
and disk usage of iptrace), use the -S $bytes option
(-B and -i are needed to use -S).
For example, the following limits each packet to 80 bytes:
startsrc -s iptrace "-a -b -B -S 80 /tmp/aixiptrace.bin"Therefore, for a low-overhead, rotating iptrace up to 4GB of total disk space, use:
startsrc -s iptrace "-a -b -B -L 2147483648 -S 80 /tmp/aixiptrace.bin"Filter to only capture traffic coming into or going out of port 80:
startsrc -s iptrace "-a -b -B -p 80 /tmp/aixiptrace.bin"Stop capturing traffic:
stopsrc -s iptraceUse Wireshark to analyze.
tcpdump
In general, iptrace is used
instead of tcpdump; nevertheless, tcpdump
is available.
For example, capture all traffic in files of size 100MB and up to 10
historical files (-C usually requires -Z):
(nohup tcpdump -n -i $INTERFACE -s 0 -C 100 -Z root -w capture$(hostname)_$(date +"%Y%m%d_%H%M").dmp &); sleep 1; cat nohput.outTo stop the capture:
ps -elf | grep tcpdump | grep -v grep | awk '{print $4}' | xargs kill -INTUse Wireshark to analyze.
TCP Keep-Alive
TCP Keep-Alive
periodically sends packets on idle connections to make sure they're
still alive. This feature is disabled by default and must be explicitly
enabled on a per-socket basis (e.g. using setsockopt
with SO_KEEPALIVE or a higher-level API like Socket.setKeepAlive).
TCP keepalive is different from HTTP
KeepAlive.
In general, the purpose of enabling and tuning TCP keepalive is to set it below any firewall idle timeouts between two servers on a LAN using connection pools between them (web service client, DB, LDAP, etc.) to reduce the performance overhead of connection re-establishment.
If TCP Keep-Alive is enabled, there are three kernel parameters to tune for TCP keep-alive:
tcp_keepidle: The number of half-seconds after which a socket is considered idle after which the kernel will start to send TCP keepalive probes while it's idle. This defaults to 14400 half-seconds (2 hours) and is the major TCP keep-alive tuning knob. In general, this should be set to a value below the firewall timeout. This may also be set withsetsockoptwithTCP_KEEPIDLE.tcp_keepintvl: The number of seconds to wait between sending each TCP keep-alive probe. This defaults to 150 half-seconds. This may also be set withsetsockoptwithTCP_KEEPINTVL.tcp_keepcnt: The maximum number of probes to send without responses before giving up and killing the connection. This defaults to 8. This may also be set withsetsockoptwithTCP_KEEPCNT.
For example, with a firewall idle timeout of 60 seconds:
no -o tcp_keepidle=90
no -o tcp_keepintvl=10
no -o tcp_keepcnt=2
Nagle's Algorithm (RFC 896, TCP_NODELAY)
In general, Nagle's
algorithm does not need to be disabled at an AIX level as products
such as WebSphere disable it on a per-socket basis; however, it may be
disabled globally using no:
$ no -o tcp_nagle_limit=0
$ no -r -o tcp_nagle_limit=0
Other Kernel and Process Settings
Update the maximum open files ulimit by adding the following lines to
/etc/security/limits;
for example:
nofiles = 50000
nofiles_hard = 50000
Processor sets/pinning
The AIX scheduler generally does a good job coordinating CPU usage
amongst threads and processes; however, manually assigning processes to
CPUs can provide more stable, predictable behavior. Binding processes to
particular CPUs is especially important on systems with multiple
processing modules and non-uniform memory access, and also depending on
how various levels of cache are shared between processors. It is best to
understand the system topology and partition resources accordingly,
especially when multiple CPU intensive processes must run on the
machine. The easiest way to do this is using the execrset
command to specify a list of CPUs to bind a command (and its children)
to (running this command as non-root requires the
CAP_NUMA_ATTACH property):
execrset -c $CPUs -e $COMMANDFor example:
execrset -c 0-3 -e java -Xmx1G MemoryAccessNote that on SMT-enabled machines the list of CPUs will represent logical CPUs. For example, if the machine was booted in SMT4 mode, CPUs 0-3 represent the 4 hardware threads that the physical CPU 0 can support.
It is important to note that currently the J9 JVM configures itself
based on the number of online processors in the system, not the number
of processors it is bound to (which can technically change on the fly).
Therefore, if you bind the JVM to a subset of CPUs you should adjust
certain thread-related options, such as -Xgcthreads, which
by default is set to the number of online processors.
attachrset
attachrset
is an alternative to execrset above and dynamically
attaches a process and its threads to a CPU set. For example:
attachrset -F -c 0-3 $PIDUse the lsrset
command to list the current rset of a process:
lsrset -p $PIDMemory Affinity
Memory affinity can be an important consideration when dealing with
large systems composed of multiple processors and memory modules.
POWER-based SMP systems typically contain multiple processor modules,
each module housing one or more processors. Each processing module can
have a system memory chip module (MCM) attached to it, and while any
processors can access all memory modules on the system, each processor
has faster access to its local memory module. AIX memory affinity
support allows the OS to allocate memory along module boundaries and is
enabled by default. To enable/disable it explicitly, use
vmo -o memory_affinity=1/0.
If memory affinity is enabled, the default memory allocation policy
is a round-robin scheme that rotates allocation amongst MCMs. Using the
environment variable MEMORY_AFFINITY=MCM will change the
policy to allocate memory from the local MCM whenever possible. This is
especially important if a process has been bound to a subset of
processors, using execrset for example; setting
MEMORY_AFFINITY=MCM may reduce the amount of memory
allocated on non-local MCMs and improve performance.
Disabling Hardware Prefetching
The dscrctl
command sets the hardware prefetching policy for the system. Hardware
prefetching is enabled by default and is most effective when memory
access patterns are easily predictable. The hardware prefetcher can be
configured with various schemes; however, most transaction oriented Java
workloads may not benefit from hardware prefetching so you may see
improved performance by disabling it using dscrctl -n -s 1.
J9 Java provides the -XXsetHWPrefetch command-line switch
to set the hardware prefetch policy for its process only. Use
-XXsetHWPrefetch:none to disable prefetching and
-XXsetHWPrefetch=N to enable a specific prefetch policy,
where N is a value recognized by dscrctl.
Recent versions of J9 Java disable hardware prefetching by default, so
consider testing -XXsetHWPrefetch:os-default to revert to
the previous behavior and allow the JVM process to use the policy
currently set with dscrctl. Also test the option
-XnotlhPrefetch.
Native Memory Allocation (malloc) Algorithms
In one benchmark, throughput improved by 50% simply by restarting
with the AIX environment variable MALLOCOPTIONS=multiheap.
This is particularly
valuable where there is heavy, concurrent malloc usage;
however, in many cases of WAS/Java, this is not the case, although it can
be a possibility. Also consider
MALLOCOPTIONS=pool,buckets.
mallocis often a bottleneck for application performance, especially under AIX [...] By default, the [AIX]mallocsubsystem uses a single heap, which causes lock contention for internal locks that are used bymallocin case of multi-threaded applications. By enabling [the multiheap] option, you can configure the number of parallel heaps to be used by allocators. You can set the multiheap by exportingMALLOCOPTIONS=multipheap[:n], wherencan vary between1-32and32is the default ifnis not specified. Use this option for multi-threaded applications, as it can improve performance.
The multiheap option does have costs, particularly increased virtual and physical memory usage. The primary reason is that each heap's free tree is independent, so fragmentation is more likely. There is also some additional metadata overhead.
Increasing the number of malloc heaps does not significantly increase the virtual memory usage directly (there are some slight increases because each heap has some bookkeeping that it has to do). However, while each heap's free tree is independent of others, the heap areas all share the same data segment, so native memory fragmentation becomes more likely, and thus indirectly virtual and physical memory usage may increase. It is impossible to predict by how much because it depends on the rate of allocations and frees, sizes of allocations, number of threads, etc. It is best to take the known physical and virtual memory usage of a process before the change (rss, vsz) at peak workload, so let's call this X GB (for example, 9 GB). Then apply the change and run the process to peak workload and monitor. The additional usage will normally be no more than 5% of X (in the above example, ~500MB). As long as there is that much additional physical memory available, then things should be okay. It is advised to continue to monitor rss/vsz after the change, especially over time (fragmentation has a tendency to build up).
How do you know if this is affecting you? Consider:
A concentration of execution time in the
pthreadslibrary [...] or in kernel locking [...] routines [...] is associated with a locking issue. This locking might ultimately arise at the system level (as seen with malloc locking issues on AIX), or at the application level in Java code (associated with synchronized blocks or methods in Java code). The source of locking issues is not always immediately apparent from a profile. For example, with AIX malloc locking issues, the time that is spent in the malloc and free routines might be quite low, with almost all of the impact appearing in kernel locking routines.
Here is an example tprof that shows this problem using
tprof -ujeskzl -A -I -X -E -r report -x sleep 60:
Process                          FREQ  Total Kernel   User Shared  Other   Java
=======                          ====  ===== ======   ==== ======  =====   ====
/usr/java5/jre/bin/java           174  22557  11850      0   7473     86   3148

Shared Object                                  Ticks    %    Address  Bytes
=============                                  ===== ======  =======  =====
/usr/lib/libc.a[shr_64.o]                       3037   9.93 900000000000d00 331774
/usr/lib/libpthread.a[shr_xpg5_64.o]            1894   6.19 9000000007fe200  319a8

  Total Ticks For All Processes (KERNEL) = 15045
Subroutine                 Ticks    %   Source                Address  Bytes
==========                 ===== ====== ======                =======  =====
._check_lock                2103   6.88 low.s                    3420     40

  Total Ticks For All Processes (/usr/lib/libc.a[shr_64.o]) = 3037
Subroutine                 Ticks    %   Source                Address  Bytes
==========                 ===== ====== ======                =======  =====
.malloc_y                    856   2.80 ../../../../../../../src/bos/usr/ccs/lib/libc/malloc_y.c    41420    840
.free_y                      669   2.19 ../../../../../../../src/bos/usr/ccs/lib/libc/malloc_y.c    3f980    9a0

  Total Ticks For All Processes (/usr/lib/libpthread.a[shr_xpg5_64.o]) = 1894

Subroutine                 Ticks    %   Source                Address  Bytes
==========                 ===== ====== ======                =======  =====
.global_unlock_ppc_mp        634   2.07 pth_locks_ppc_mp.s      2d714     6c
._global_lock_common         552   1.81 ../../../../../../../../src/bos/usr/ccs/lib/libpthreads/pth_spinlock.c     2180    5e0
.global_lock_ppc_mp_eh       321   1.05 pth_locks_ppc_mp_eh.s    2d694     6c
The key things to notice are:
- In the first
Processsection, theKerneltime is high (about half ofTotal). This will also show up intopas/vmstat/psas high system CPU time. - In the
Shared Objectlist,libcandlibpthreadare high. - In the
KERNELsection,._check_lockis high. - In the
libc.asection,.malloc_yand.free_yare high. - In the
libpthread.asection,.global_unlock_ppc_mpand other similarly named functions are high.
If you see a high percentage in the KERNEL section in
unlock_enable_mem, this is usually caused by calls to sync 1/sync L/lwsync.
It has been observed in some cases that this is related to the default,
single threaded malloc heap.
AIX also offers other allocators and allocator options that may be useful:
- Buckets
This suboption is similar to the built-in bucket allocator of the Watson allocator. However, with this option, you can have fine-grained control over the number of buckets, number of blocks per bucket, and the size of each bucket. This option also provides a way to view the usage statistics of each bucket, which be used to refine the bucket settings. In case the application has many requests of the same size, then the bucket allocator can be configured to preallocate the required size by correctly specifying the bucket options. The block size can go beyond 512 bytes, compared to the Watson allocator or malloc pool options.
You can enable the buckets allocator by exporting MALLOCOPTIONS=buckets. Complete details about the buckets options for fine-grained control are available 1 . Enabling the buckets allocator turns off the built-in bucket component if the Watson allocator is used- malloc pools
This option enables a high performance front end to malloc subsystem for managing storage objects smaller than 513 bytes. This suboption is similar to the built-in bucket allocator of the Watson allocator. However, this suboptions maintains the bucket for each thread, providing lock-free allocation and deallocation for blocks smaller than 513 bytes. This suboption improves the performance for multi-threaded applications, as the time spent on locking is avoided for blocks smaller than 513 bytes.
The pool option makes small memory block allocations fast (no locking) and memory efficient (no header on each allocation object). The pool malloc both speeds up single threaded applications and improves the scalability of multi-threaded applications.
Example Automation Script
Customize paths and commands as needed. Example usage:
/opt/diag.sh javacore sleep10 javacore sleep10 javacore sleep10 collect cleantmp
#!/bin/sh
# usage: diag.sh cmd...
# Version history:
# * 0.0.1: First version

myversion="0.0.1"
outputfile="diag_$(hostname)_$(date +"%Y%m%d_%H%M%S").log"

msg() {
  echo "diag: $(date +"%Y%m%d %H%M%S %N %Z") : ${@}" | tee -a "${outputfile}"
}

severeError() {
  echo ""
  echo "***** ERROR *****"
  msg "${@}"
  echo "***** ERROR *****"
  echo ""
  exit 1
}

msg "Starting diag version ${myversion} for $(hostname) to ${outputfile}"

defaultcommands="uptime vmstat lparstat iostat svmon netstatan netstatv lparstati"

msg "Running commands: ${defaultcommands} ${@}"

for cmd in ${defaultcommands} "${@}"; do

  msg "Processing command ${cmd}"

  if [ "${cmd}" = "uptime" ]; then

    msg "Getting uptime"
    uptime 2>&1 | tee -a "${outputfile}"

  elif [ "${cmd}" = "vmstat" ]; then

    msg "Getting a quick vmstat"
    vmstat 1 2 2>&1 | tee -a "${outputfile}"

  elif [ "${cmd}" = "lparstat" ]; then

    msg "Getting a quick lparstat"
    lparstat 1 2 2>&1 | tee -a "${outputfile}"

  elif [ "${cmd}" = "iostat" ]; then

    msg "Getting a quick iostat"
    iostat 1 2 2>&1 | tee -a "${outputfile}"

  elif [ "${cmd}" = "svmon" ]; then

    msg "Getting svmon -G"
    svmon -G 2>&1 | tee -a "${outputfile}"

  elif [ "${cmd}" = "netstatan" ]; then

    msg "Getting netstat -an"
    netstat -an >> "${outputfile}" 2>&1

  elif [ "${cmd}" = "netstatv" ]; then

    msg "Getting netstat -v"
    netstat -v >> "${outputfile}" 2>&1

  elif [ "${cmd}" = "lparstati" ]; then

    msg "Getting lparstat -i"
    lparstat -i >> "${outputfile}" 2>&1

  elif [ "${cmd}" = "sleep10" ]; then

    msg "Sleeping for 10 seconds"
    sleep 10

  elif [ "${cmd}" = "javacore" ]; then

    pid="$(cat /cmd/IBM/WebSphere/AppServer/profiles/AppSrv01/logs/server1/server1.pid)"
    msg "Requesting javacore for PID ${pid}"
    kill -3 ${pid} 2>&1 | tee -a "${outputfile}"

  elif [ "${cmd}" = "collect" ]; then

    collectoutputfile="diag_$(hostname)_$(date +"%Y%m%d_%H%M%S").tar"
    msg "Collecting all logs to ${collectoutputfile}"

    tar cvf "${collectoutputfile}" "${outputfile}" \
                                   "/opt/IBM/WebSphere/AppServer/profiles/AppSrv01/logs/server1/" \
                                   "/opt/IBM/WebSphere/AppServer/profiles/AppSrv01/logs/ffdc/" \
                                   "/opt/IBM/WebSphere/AppServer/profiles/AppSrv01/javacore"* \
                                   "/opt/IBM/WebSphere/AppServer/profiles/AppSrv01/heapdump"* \
                                   "/opt/IBM/WebSphere/AppServer/profiles/AppSrv01/core."* \
            2>&1 | tee -a "${outputfile}"

    compress "${collectoutputfile}" 2>&1 | tee -a "${outputfile}"

    msg "Wrote ${collectoutputfile}.Z"

  elif [ "${cmd}" = "cleantmp" ]; then

    msg "Cleaning any temporary files"

    rm -e "/opt/IBM/WebSphere/AppServer/profiles/AppSrv01/javacore"* "/opt/IBM/WebSphere/AppServer/profiles/AppSrv01/heapdump"* "/opt/IBM/WebSphere/AppServer/profiles/AppSrv01/core."* 2>&1 | tee -a "${outputfile}"

  else
    severeError "Unknown command ${cmd}"
  fi
done

msg "Finished diag. Wrote to ${outputfile}"