Troubleshooting OpenJ9 and IBM J9 JVMs
IBM Java Versions
Each Java release has service releases which are fixpack upgrades, normally with APARs, but sometimes with feature enhancements, for example SR1. Finally, service releases themselves may have fix packs, for example FP1. An example IBM Java version commonly seen is: IBM Java Version 7R1 SR1 FP1
Debug symbols
Click "Show all X assets" under a release to find
*debugimage* packages that have *.debuginfo,
*.pdb/*.map, and *.dSYM
files:
Thread Dump (javacore.txt)
IBM Java can produce a javacore.txt file, also called a javadump. An example file name is javacore.20140930.025436.9920.0003.txt.
In general, javacores are very low overhead. They usually take no more than a few hundred milliseconds to produce. However, there are known defects in IBM Java that cause the entire JVM to freeze when requesting a javacore. These are usually caused by race conditions and are more likely the more javacores that are taken. Therefore, there is some risk in taking javacores in production, and this risk is proportional to the number of javacores taken. Before taking a lot of javacores, ensure that you have fixes installed for the most common of these hangs:
Staring with IBM Java 5, you may see threads in a javacore which are in Conditional Wait (CW) state that you would expect to be Runnable (R). This is by design; however, starting with Java 7.1 SR2, Java 7.0 SR8, and Java 6.1 SR8 FP2, such threads are reported as Runnable and the internal state is reported in the vmstate field.
Request Thread Dump
Additional methods of requesting thread dumps are documented in the Troubleshooting WAS chapter.
- On non-Windows operating systems, by default, the command
kill -3 ${PID}will request a thread dump. - For Semeru Java, use jcmd:
jcmd $PID Dump.java - For IBM Java >= 8.0.6.0:
java -Xbootclasspath/a:%JAVA_HOME%\lib\tools.jar openj9.tools.attach.diagnostics.tools.Jcmd %PID% Dump.java - For IBM Java >= 8.0.7.20 and Semeru >= 11.0.17.0 on
non-Windows platforms, restart with:
Then request the system dump with:-Xdump:java:events=user2,request=exclusive+preemptkill -USR2 $PID - Create a javacore when a process starts or
other triggers; for example:
-Xdump:java:events=vmstart - On recent versions of IBM Java, use Java
Surgery:
$ java -jar surgery.jar -pid ${PID} -command JavaDump - Programmatically with
com.ibm.jvm.Dump.JavaDump() - The trace
engine may be used to request a thread dump on method entry and/or
exit. The following example JVM argument requests a thread dump when the
Example.trigger() method is called:
-Xtrace:maximal=mt,trigger=method{com/ibm/example/Example.trigger,javadump}
By default, a user requested javacore has the request=exclusive option which asks for exclusive access before executing the javacore. However, unlike other agents, if exclusive access cannot be granted, the javacore creation will still proceed with some data excluded for safety. There is a known APAR IV68447/PI32843 where heap corruption may occur if a javacore runs during a garbage collection cycle.
Process Limits (ulimits)
On recent versions of IBM Java and applicable operating systems, a javacore includes a section with the current ulimit values of the process:
1CIUSERLIMITS  User Limits (in bytes except for NOFILE and NPROC)
NULL           ------------------------------------------------------------------------
NULL           type                            soft limit           hard limit
2CIUSERLIMIT   RLIMIT_AS                        unlimited            unlimited
2CIUSERLIMIT   RLIMIT_CORE                      unlimited            unlimited
2CIUSERLIMIT   RLIMIT_CPU                       unlimited            unlimited
2CIUSERLIMIT   RLIMIT_DATA                      unlimited            unlimited
2CIUSERLIMIT   RLIMIT_FSIZE                     unlimited            unlimited
2CIUSERLIMIT   RLIMIT_LOCKS                     unlimited            unlimited
2CIUSERLIMIT   RLIMIT_MEMLOCK                       65536                65536
2CIUSERLIMIT   RLIMIT_NOFILE                         8192                 8192
2CIUSERLIMIT   RLIMIT_NPROC                        213234               213234
2CIUSERLIMIT   RLIMIT_RSS                       unlimited            unlimited
2CIUSERLIMIT   RLIMIT_STACK                       8388608            unlimited
2CIUSERLIMIT   RLIMIT_MSGQUEUE                     819200               819200
2CIUSERLIMIT   RLIMIT_NICE                              0                    0
2CIUSERLIMIT   RLIMIT_RTPRIO                            0                    0
2CIUSERLIMIT   RLIMIT_SIGPENDING                   213234               213234
When requesting a system dump using the IBM system dump mechanism, the JVM will ensure that the RLIMIT_CORE hard limit is used.
NATIVEMEMINFO
In recent versions of IBM Java, the NATIVEMEMINFO section summarizes native memory allocations that the JVM has made.
0SECTION       NATIVEMEMINFO subcomponent dump routine
1MEMUSER       JRE: 4,786,464,960 bytes / 14237 allocations
2MEMUSER       +--VM: 4,734,576,408 bytes / 11959 allocations
3MEMUSER       |  +--Classes: 130,832,328 bytes / 5225 allocations
3MEMUSER       |  +--Memory Manager (GC): 4,388,855,680 bytes / 1502 allocations
4MEMUSER       |  |  +--Java Heap: 4,294,967,296 bytes / 1 allocation...
On 64-bit Java, the "Unused <32bit allocation regions: 6,708,704 bytes" line summarizes how much native memory is free in the pooled region allocations underneath 4GB.
If -Dcom.ibm.dbgmalloc=true is specified, then additional information will be added to NATIVEMEMINFO including native memory used by the Zip/Jar SDK code:
4MEMUSER | | +--Zip: 5,913,128 bytes / 2271 allocations
4MEMUSER | | +--Wrappers: 64,320 bytes / 193 allocations
5MEMUSER | | | +--Malloc: 64,320 bytes / 193 allocations
As an alternative, or in addition to, NATIVEMEMINFO analysis, Andrew
Hall wrote a wonderful little Perl script named get_memory_use.pl
that takes an IBM javacore.txt file and prints the number of reserved
bytes for each IBM Java native memory segment (the many pages of hex
addresses towards the top of the javacore). Native memory segments are
all of the (pooled) native memory allocations that IBM Java makes, such
as the Java heap itself, classes, JIT, etc. This script has been enhanced
to: 1) print the NATIVEMEMINFO section if available, and 2) summarize
the virtual memory layout of the sections based on 256MB sized
segments:
$ perl get_memory_use.pl javacore.20140507.195651.17236140.0001.txtVirtual Memory Layout
A virtual memory layout of native memory allocations made by IBM Java may be created by simply listing the start and end addresses of all IBM Java native memory segments:
$ grep 1STSEGMENT javacore*.txt | awk '{print $3,$5}' | sortThis list may be useful to correlate to an operating system virtual memory layout to figure out what is allocated by IBM Java versus native allocations oustide of IBM Java.
First, determine whether most of the native memory is accounted for
by Java or not. If RSS is much larger than expected, then gather either
1) the output of /proc/${PID}/smaps, or 2) a core file
(you'll also need the java executable to load in gdb). #1 will look
something like this:
...
7f3498000000-7f34a0000000 rw-p 00000000 00:00 0
Size:             131072 kB
Rss:              131072 kB
Pss:              131072 kB...
In the case of #2, you can get an output that's a subset of #1
through gdb by running "info files" and reviewing the core dump section
(you can also get this info without gdb by running
readelf --program-headers core.dmp):
$ gdb ${PATH_TO_JAVA_EXE} ${PATH_TO_CORE}
(gdb) info files
Symbols from "java".
Local core dump file:
    `core.16721.dmp', file type elf64-x86-64.
    ...
    0x00007f3498000000 - 0x00007f34a0000000 is load51...
Create a list of the sizes of these virtual memory areas (VMAs) and then cross-reference their ranges with the memory segment ranges in the javacore ($3 for the start and $5 for the end):
$ grep "1STSEGMENT " javacore.20140703.171909.16721.0002.txt | awk '{print $3}' | sortIf you've found large VMAs that aren't accounted for by IBM Java,
then it may be worth exploring their raw memory to figure out whodunnit.
GDB has the x command to print raw memory, but it's not
easy on the eye:
(gdb) x/32xc 0x00007f3498000000
0x7f3498000000: 32 ' '  0 '\000'    0 '\000'    28 '\034'   54 '6'  127 '\177'  0 '\000'    0 '\000'
0x7f3498000008: 0 '\000'    0 '\000'    0 '\000'    -92 '\244'  52 '4'  127 '\177'  0 '\000'    0 '\000'
0x7f3498000010: 0 '\000'    0 '\000'    0 '\000'    4 '\004'    0 '\000'    0 '\000'    0 '\000'    0 '\000'
0x7f3498000018: 0 '\000'    0 '\000'    0 '\000'    4 '\004'    0 '\000'    0 '\000'    0 '\000'    0 '\000'
Another option is to dump memory to a file and then spawn an xxd process from within gdb to dump that file:
(gdb) define xxd
Type commands for definition of "xxd".
End with a line saying just "end".
>dump binary memory dump.bin $arg0 $arg0+$arg1
>shell xxd dump.bin
>shell rm -f dump.bin
>end
(gdb) xxd 0x00007f3498000000 32
0000000: 2000 001c 367f 0000 0000 00a4 347f 0000   ...6.......4...
0000010: 0000 0004 0000 0000 0000 0004 0000 0000  ................
In this example, we found out later that this was a Glibc malloc
arena. Unfortunately, Glibc doesn't put an eye catcher at the top of
each arena, so the only way to know for sure would be to point to the
debuginfo packages and walk the arena chain (first,
p main_arena.next, cast to malloc_state and
dereference,
p *((struct malloc_state *(0x00007f3498000000), and so on
until next == p &main_arena).
For large VMAs, it's probably best to just dump the VMA to a file:
dump binary memory dump.bin 0x00007f3498000000 0x00007f34a0000000And then just xxd the file and pipe to less. If you have smaps output, then review the Rss line to see how much of the VMA was resident in RAM at the time.
If the VMA was mmap'ped (like a malloc arena), then remember that mmap will zero the chunk of memory first, so unused parts will be zeros. A simple trick to filter those out is to remove all zero lines:
$ xxd dump.bin | grep -v "0000 0000 0000 0000 0000 0000 0000 0000" | lessJVM-Allocated Native Memory
Every JVM-allocated native memory chunk is allocated
with a header and a footer of type J9MemTag.
The first 32 bytes is an eye catcher, the second 32 bytes is a checksum,
the third word is the allocation size, the fourth word is a pointer to a
string describing the type of allocation, and the fifth word is a
pointer to the allocation category. The header
eyecatcher is 0xB1234567 for an active allocation and
0xBADBAD67 for a freed allocation. The footer
eyecatcher is 0xB7654321 for an active allocation and
0xBADBAD21 for a freed allocation. Note that malloc
libraries such as Linux glibc will overwrite the first two words of a
freed chunk as housekeeping pointers. On 64-bit, this means that the
eyecatcher, checksum, and allocation size will be overwritten in the
header tag; however, the same data is available in the footer tag, so
it's best to use that.
Accumulated CPU Time
Compare accumulated CPU time between threads across two javacores (replace the first two lines with the javacore file names):
JAVACORE1=javacore.20171117.145059.26621.0001.txt; \
JAVACORE2=javacore.20171117.145108.26621.0003.txt; \
  join -a 1 -a 2 \
    <(\
      grep -e '3XMTHREADINFO ' -e 3XMCPUTIME "${JAVACORE1}" | \
        grep -v 'Anonymous native thread' | \
        sed '$!N;s/\n/ /' | \
        sed 's/3XMTHREADINFO.*J9VMThread://g' | \
        sed 's/,.*CPU usage total://g' | \
        sed 's/ secs.*//g' | \
        sort
     )\
    <(\
      grep -e '3XMTHREADINFO ' -e 3XMCPUTIME "${JAVACORE2}" | \
        grep -v 'Anonymous native thread' | \
        sed '$!N;s/\n/ /' | \
        sed 's/3XMTHREADINFO.*J9VMThread://g' | \
        sed 's/,.*CPU usage total://g' | \
        sed 's/ secs.*//g' | \
        sort
     ) | \
       awk '{ printf "%s %.9f\n", $0, $3-$2 }' | sort -nr -k 4
Thread States
The Javacore.txt thread dump shows the state of each thread at the time of the dump; most commonly, R for runnable, CW for conditional wait, B for blocked, and P for parked. It has been a common confusion since IBM Java version 5 that threads which are effectively running (R) are actually reported as waiting (CW). This is because the JVM uses a cooperative mechanism to try to quiesce running threads for the duration of the Javacore to reduce the chances of problems creating the javacore itself. Tools such as IBM TMDA naïvely report the thread dump state without taking this into account:
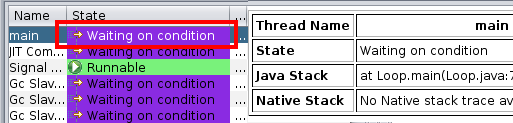
2LKREGMON          Thread public flags mutex lock (0x00000000015E0438): <unowned>
3LKNOTIFYQ            Waiting to be notified:
3LKWAITNOTIFY            "main" (0x00000000015F6000)
However, starting with Java 8, Java 7, Java 6.1, and Java 6 SR16 FP4,
the javacore.txt file reports
these thread states as runnable, and moves the "true" state into the
vmstate field: "Threads that were running Java code
when the javacore was triggered have a Java thread state of R (Runnable)
and an internal VM thread state of CW (Condition Wait)." (<>)
3XMTHREADINFO      "main" J9VMThread:0x00000000210E3100, j9thread_t:0x00007F0FB4007C30, java/lang/Thread:0x0000000020FE1D98, state:R, prio=5
3XMJAVALTHREAD            (java/lang/Thread getId:0x1, isDaemon:false)
3XMTHREADINFO1            (native thread ID:0x13DA, native priority:0x5, native policy:UNKNOWN, vmstate:CW, vm thread flags:0x00000001)
3XMTHREADINFO2            (native stack address range from:0x00007F0FBA12B000, to:0x00007F0FBAB2C000, size:0xA01000)
Check which thread has exclusive access in a javacore
- Find all threads whose
vm thread flagsbit flags have J9_PUBLIC_FLAGS_VM_ACCESS (0x20). Ensure that only one thread has this and that all other threads have the big flag J9_PUBLIC_FLAGS_HALT_THREAD_EXCLUSIVE (0x1). For example,WebContainer : 7has 0x20 and the others have 0x1:$ grep -e "XMTHREADINFO " -e "vm thread flags" javacore*.txt 3XMTHREADINFO "WebContainer : 7" J9VMThread:0x0000000004C82700, omrthread_t:0x0000153A040C9248, java/lang/Thread:0x00000000F3FBB0D8, state:R, prio=5 3XMTHREADINFO1 (native thread ID:0x106E, native priority:0x5, native policy:UNKNOWN, vmstate:R, vm thread flags:0x00001020) 3XMTHREADINFO "WebContainer : 10" J9VMThread:0x0000000004EB9400, omrthread_t:0x00001539A401C7F8, java/lang/Thread:0x00000000F3CE9BC8, state:R, prio=5 3XMTHREADINFO1 (native thread ID:0x1078, native priority:0x5, native policy:UNKNOWN, vmstate:CW, vm thread flags:0x00000081) [...]
For a more complete picture, perform this on a core dump using jdmpview.
Heapdumps and system dumps
A heapdump contains information on the Java heap. This is used for investigating OutOfMemoryErrors, tuning Java heap usage, etc. On IBM Java, historically, a heapdump was equivalent to an IBM Portable Heapdump (PHD) file. A PHD heapdump is written by code in IBM Java and is generally limited to object reference analysis. Recently, IBM Java has pushed a new strategic direction to use system dumps instead of PHD heapdumps. A system dump is equivalent to the operating system process memory dump (Unix=core, Windows=dump, z/OS=DUMP, etc.). System dumps are written by the operating system. In essence, system dumps are a superset of PHD heapdumps. Not only do they include the Java heap, but they also include object memory (for example, the actual value of a String, etc.), which brings them to parity with HotSpot HPROF heapdumps. Additionally, system dumps include more detailed thread information (including some of the Java stack frame locals on each stack frame, which can be incredibly useful, such as finding out which database SQL query is executing), more accurate garbage collection root information, native memory information, and more.
Starting in IBM Java 626 (WAS 8.0.0.2), a system dump has been added for the first OutOfMemoryError. Thus, the default has changed to produce a PHD heapdump, javacore, snap file, and a system dump on OOM.
In older versions of IBM Java, the jextract tool was required to post-process a system dump. This was cumbersome and time consuming. Starting with Java 5 >= SR12 (WAS >= 6.1.0.33), Java 6 >= SR9 (WAS >= 7.0.0.15), Java 626 (WAS 8), DTFJ-based tools such as the Eclipse Memory Analyzer Tool (MAT) with IBM DTFJ plugin can read a system dump directly, just like a PHD heapdump. Jextract may still be useful for investigating native memory information (because jextract will also gather native libraries from the filesystem), but in general, a system dump is now as easy to use as a PHD heapdump.
Unfortunately, most customers on Unix operating systems are still configured with constrained ulimits which truncate system dumps, making them usually useless. It is critical that you properly configure Unix systems for full core dumps:
System dumps usually compress to 25% of original size using zip, gzip, etc.
For the best system dump performance, ensure significant free physical memory so that the operating system can write it to RAM and then asynchronously flush to disk.
To analyze both heapdumps and system dumps, see the Eclipse Memory Analyzer Tool chapter.
To disable heapdumps and core dumps on OOM but keep core dumps on crashes:
-Xdump:heap:none -Xdump:system:none:events=systhrow,filter=java/lang/OutOfMemoryErrorPortable Heap Dump (PHD)
In general, IBM Java uses two formats for heapdumps: IBM Portable Heapdump (PHD) and an operating system dump. The latter is a superset of the former.
The operating system dump is simply a core dump of the virtual address space (Unix=core, Windows=userdump, z/OS=SYSDUMP) of the process. In older versions of IBM Java, the JVM's jextract tool was required to be run on an operating system dump before it could be analyzed. Starting with Java 5 >= SR12, Java 6 >= SR9, and later Java releases, jextract is not necessary because IBM has created file readers for operating system dumps for all operating systems on which IBM Java runs. Tools such as the IBM Memory Analyzer Tool use the IBM Diagnostic Tool Framework for Java API to read the heapdump from jextracted ZIPs or operating system dumps.
An IBM PHD file contains basic information about the Java heap such as the graph of relationships between objects and their size. An operating system dump is a superset of a PHD heap dump and includes everything about the process; thus, in general, it will be larger and take longer to produce than an IBM PHD file. An operating system dump is usually compressable down to 25% of its original size for transportation.
Request heap dump
Additional methods of requesting heap dumps are documented in the Troubleshooting WAS chapter.
- For Semeru Java, use jcmd:
jcmd $PID Dump.heap - For IBM Java >= 8.0.6.0:
java -Xbootclasspath/a:%JAVA_HOME%\lib\tools.jar openj9.tools.attach.diagnostics.tools.Jcmd %PID% Dump.heap - For IBM Java >= 8.0.7.20 and Semeru >= 11.0.17.0 on
non-Windows platforms, restart with:
Then request the system dump with:-Xdump:heap:events=user2,request=exclusive+prepwalkkill -USR2 $PID - Use Java
Surgery:
java -jar surgery.jar -pid ${PID} -command HeapDump - Extract a PHD heapdump from a system
dump using the
heapdump command injdmpview - Restart with
-Xdump:heap:events=userto take one on kill -3/Ctrl+Break. Note that we do not recommend running with this option permanently because the default handler only produces javacores which are often used for performance investigations whereas a heap dump causes its own significant performance overhead. - Programmatically with
com.ibm.jvm.Dump.HeapDump() - From within the IBM Memory Analyzer Tool: File } Acquire Heap Dump
- The trace
engine may be used to request a heap dump on method entry and/or
exit. The following example JVM argument produces a heap dump when the
Example.trigger() method is called:
-Xtrace:maximal=mt,trigger=method{com/ibm/example/Example.trigger,heapdump}
System Dumps (core.dmp)
System dumps on Linux
On Linux, when IBM Java requests the system dump, it forks itself and then kills the forked child process:
Linux does not provide an operating system API for generating a system dump from a running process. The JVM produces system dumps on Linux by using the fork() API to start an identical process to the parent JVM process. The JVM then generates a SIGSEGV signal in the child process. The SIGSEGV signal causes Linux to create a system dump for the child process. The parent JVM processes and renames the system dump, as required, by the -Xdump options, and might add additional data into the dump file. The system dump for the child process contains an exact copy of the memory areas used in the parent. The SDK dump viewer can obtain information about the Java threads, classes, and heap from the system dump. However, the dump viewer, and other system dump debuggers show only the single native thread that was running in the child process.
IBM Java then looks at /proc/PID/maps and tries to append information to the core dump that wouldn't otherwise be there (in some cases this is not possible because the VMA does not have read permission): "The Linux operating system core dump might not contain all the information included in a core dump produced by the JVM dump agents".
In general, it is recommended to get the output of /proc/${PID}/smaps at the same time as getting a system dump if you will be interested in virtual memory.
System dumps on Windows
If core dumps are truncated, test setting DumpType to a value such as 2 or 0 and custom bitflags. For example:
HKEY_LOCAL_MACHINE\SOFTWARE\Microsoft\Windows\Windows Error Reporting\LocalDumps- DWORD Decimal = 2
Request system dump
Additional methods of requesting system dumps are documented in the Troubleshooting Operating Systems and Troubleshooting WAS chapter.
- For Semeru Java, use jcmd:
jcmd $PID Dump.system - For IBM Java >= 8.0.6.0:
java -Xbootclasspath/a:%JAVA_HOME%\lib\tools.jar openj9.tools.attach.diagnostics.tools.Jcmd %PID% Dump.system - For IBM Java >= 8.0.7.20 and Semeru >= 11.0.17.0 on
non-Windows platforms, restart with:
Then request the system dump with:-Xdump:system:events=user2,request=exclusive+prepwalkkill -USR2 $PID - Use Java
Surgery:
java -jar surgery.jar -pid $PID -command SystemDump - Use
-Xdump:java+system:events=user,request=exclusive+prepwalkto take one onkill -3/Ctrl+Break. Note that we do not recommend running with this option permanently because the default handler only produces javacores which are often used for performance investigations whereas a system dump causes its own significant performance overhead. - Use
-Xdump:system:defaults:request=exclusive+prepwalkto change the system dump default to requestexclusive+prepwalkand then use some mechanism that requests a system dump within the JVM. Note that we do not recommend running with this option permanently because then investigating JVM crashes may be problematic. - Use
-Xdump:tool:events=user,request=exclusive+prepwalk,exec="gcore %pid"to execute a program that requests the core dump onkill -3/Ctrl+Break. Note that we do not recommend running with this option permanently because the default handler only produces javacores which are often used for performance investigations whereas a system dump causes its own significant performance overhead. - Automatically produced on a crash
- Starting with Java 6.26 SR1, a system dump is produced on the first OutOfMemoryError
- In earlier versions of Java, a system dump may be produced on OOM
with:
-Xdump:heap:none -Xdump:java+system:events=systhrow,filter=java/lang/OutOfMemoryError,range=1..4,request=exclusive+prepwalk - Programmatically with
com.ibm.jvm.Dump.triggerDump("system:request=exclusive+prepwalk") - IBM Health Center can acquire a dump: Monitored JVM } Request a dump } System Dump
- The IBM Java
systemDump Agent can take a system dump on various events. See Table 2 in Debugging from Dumps. For example, the following will create a core dump when the Example.bad method throws a NullPointerException:-Xdump:system:events=throw,range=1..1,request=exclusive+prepwalk,filter=java/lang/NullPointerException#com/ibm/example/Example.bad - The trace
engine may be used to request a system dump on method entry and/or
exit. The following example JVM argument produces a system dump when the
Example.trigger() method is called:
-Xtrace:maximal=mt,trigger=method{com/ibm/example/Example.trigger,sysdump} - From within the Eclipse Memory Analyzer Tool: File } Acquire Heap Dump
Exclusive-access for System Dumps
One of the main issues with requesting system dumps is that the default dump agent for system dumps does not request exclusive access.
This is required because some GPFs, aborts, and other conditions need to take system dumps without requesting exclusive access (for example, if there is a bug within the GC itself that causes a crash).
The problem is that if a system dump is requested while a garbage collection is running, this normally means that the system dump will be unusable by tools such as Memory Analyzer Tool. The garbage collector is modifying core data structures and moving pointers and references which will utterly confuse memory analysis tools. The API com.ibm.jvm.Dump.SystemDump which is used by most mechanisms to request system dumps (e.g. wsadmin, Liberty server dump, etc.) uses the default dump agent which means it does not request exclusive access.
On IBM Java >= 7.1, the exclusive option may be passed to the triggerDump API call:
com.ibm.jvm.Dump.triggerDump("system:request=exclusive+prepwalk");The Java Surgery tool's SystemDump command uses this API if it is available.
On IBM Java < 7.1, there aren't many good options to ensure that requesting a system dump requests exclusive access to avoid such a situation. The most obvious option would be to create a system dump on the user event (kill -3) and request exclusive access there; but, in general, the user event should be used for lightweight diagnostics such as thread dumps and it should not be used for heapdumps or system dumps.
The best option is to create a dump agent which requests a system dump with the exclusive option when a diagnostic exception is thrown and then use a tool such as Java surgery to inject a small JAR into the JVM that throws such an exception. First, set the following JVM option:
-Xdump:system:events=throw,filter=com/ibm/rdci/surgery/builtin/commands/CustomException1,request=exclusive+prepwalkThen use Java Surgery to attach and throw the exception:
java -jar surgery.jar -command ThrowException -pid ${PID}In addition, as part of J9's post-processing of system dumps, additional information is added to the dump that is not added by the operating system. For example, on Linux, from older documentation: "The Linux operating system core dump might not contain all the information included in a core dump produced by the JVM dump agents."
Signal handler shutdown
On POSIX operating systems, the SIGTERM,
SIGINT, and SIGHUP signals will cause the
JVM to spawn a thread ("SIGTERM handler", "SIGINT handler", and "SIGHUP
handler", respectively)
that calls
java/lang/Shutdown.exit. This will process any shutdown
hooks. Example thread dump taken during such handling for a
SIGTERM:
3XMTHREADINFO      "SIGTERM handler" J9VMThread:0x00000000024D9300, omrthread_t:0x000014B93A1CB880, java/lang/Thread:0x000000079C662F10, state:CW, rawStateValue:0x4, prio=10
3XMJAVALTHREAD            (java/lang/Thread getId:0x70CF, isDaemon:true)
3XMJAVALTHRCCL            sun/misc/Launcher$AppClassLoader(0x000000060CAB4200)
3XMTHREADINFO1            (native thread ID:0xEAA5B, native priority:0xA, native policy:UNKNOWN, vmstate:CW, vm thread flags:0x00000181)
3XMTHREADINFO2            (native stack address range from:0x000014B8AB0C5000, to:0x000014B8AB105000, size:0x40000)
3XMCPUTIME               CPU usage total: 0.001781117 secs, current category="Application"
3XMTHREADBLOCK     Waiting on: com/ibm/ws/runtime/component/ServerCollaborator$ShutdownHook@0x000000060CE157C8 Owned by: <unowned>
3XMHEAPALLOC             Heap bytes allocated since last GC cycle=4096 (0x1000)
3XMTHREADINFO3           Java callstack:
4XESTACKTRACE                at java/lang/Object.waitImpl(Native Method)
4XESTACKTRACE                at java/lang/Object.wait(Object.java:248(Compiled Code))
4XESTACKTRACE                at java/lang/Object.wait(Object.java:216(Compiled Code))
4XESTACKTRACE                at java/lang/Thread.join(Thread.java:748)
4XESTACKTRACE                at java/lang/Thread.join(Thread.java:703)
4XESTACKTRACE                at java/lang/ApplicationShutdownHooks.runHooks(ApplicationShutdownHooks.java:118)
4XESTACKTRACE                at java/lang/ApplicationShutdownHooks$1.run(ApplicationShutdownHooks.java:57)
4XESTACKTRACE                at java/lang/Shutdown.runHooks(Shutdown.java:140)
4XESTACKTRACE                at java/lang/Shutdown.exit(Shutdown.java:184)
5XESTACKTRACE                   (entered lock: java/lang/Shutdown@0x000000060C001818, entry count: 1)
4XESTACKTRACE                at java/lang/Terminator$1.handle(Terminator.java:63)
4XESTACKTRACE                at sun/misc/Signal$1.run(Signal.java:224)
4XESTACKTRACE                at java/lang/Thread.run(Thread.java:821(Compiled Code))
Eclipse OpenJ9 0.57 (e.g. IBM Java 8.0.8.60, IBM Semeru Runtimes 8.0.482.0, 11.0.30.0, 17.0.18.0, 21.0.10.0, and 25.0.2.0) adds the PID that sent the signal in the javacore. For example:
1TISIGPID Signalling process id 11007 name "/apps/wsserver/8.5/base/java/jre/bin/java"WebSphere Application Server traditional has a shutdown hook (in
com/ibm/ws/runtime/component/ServerCollaborator$ShutdownHook.run)
that takes a thread dump when detecting an "unexpected" shutdown (i.e. a
shutdown not done through an expected mechanism such as stopServer,
stopNode,
AdminControl.stopServer,
etc.) and a resulting thread dump will have a stack such as the
following (in addition to the handler stack above). A
SIGTERM signal is considered "unexpected".
1XMCURTHDINFO  Current thread
3XMTHREADINFO      "Thread-6" J9VMThread:0x00000000038C9C00, omrthread_t:0x000014B8C023A908, java/lang/Thread:0x000000060CE157C8, state:R, rawStateValue:0x1, prio=5
3XMJAVALTHREAD            (java/lang/Thread getId:0x29, isDaemon:false)
3XMJAVALTHRCCL            com/ibm/ws/bootstrap/ExtClassLoader(0x000000060CABFE68)
3XMTHREADINFO1            (native thread ID:0xEAA5F, native priority:0x5, native policy:UNKNOWN, vmstate:R, vm thread flags:0x00041020)
3XMTHREADINFO2            (native stack address range from:0x000014B8ABB6F000, to:0x000014B8ABBAF000, size:0x40000)
3XMCPUTIME               CPU usage total: 0.027337575 secs, current category="Application"
3XMHEAPALLOC             Heap bytes allocated since last GC cycle=102408 (0x19008)
3XMTHREADINFO3           Java callstack:
4XESTACKTRACE                at com/ibm/jvm/Dump.JavaDumpImpl(Native Method)
4XESTACKTRACE                at com/ibm/jvm/Dump.JavaDump(Dump.java:123)
4XESTACKTRACE                at com/ibm/ejs/util/debug/ThreadDump.invoke(ThreadDump.java:48)
4XESTACKTRACE                at com/ibm/ws/runtime/component/ServerCollaborator$ShutdownHook.run(ServerCollaborator.java:905)
4XESTACKTRACE                at com/ibm/ws/runtime/component/ServerCollaborator$ShutdownHook.run(ServerCollaborator.java:887)
Late attach
On z/OS, late attach is disabled by default and may be enabled with
-Dcom.ibm.tools.attach.enable=yes
A diagnostic log may be enabled for J9's late attach mechanism with the logging option:
-Dcom.ibm.tools.attach.logging=yesBy default, this creates a file named $PID.log in the
current working directory of the process (the file prefix may be changed
with -Dcom.ibm.tools.attach.log.name).
Example output:
1617637336015(Mon Apr 05 15:42:16 UTC 2021) 2458: 19 [Attach API initializer]: AttachHandler initialized
[...]
1617637364670(Mon Apr 05 15:42:44 UTC 2021) 2458: 23 [Attachment 32835]: connectToAttacher localPort=43314 remotePort=32835
1617637364671(Mon Apr 05 15:42:44 UTC 2021) 2458: 23 [Attachment 32835]: streamSend ATTACH_CONNECTED e4404c99752ab0ec
1617637364672(Mon Apr 05 15:42:44 UTC 2021) 2458: 22 [Attach API wait loop]: Blocking lock succeeded
1617637364673(Mon Apr 05 15:42:44 UTC 2021) 2458: 22 [Attach API wait loop]: iteration 0 checkReplyAndCreateAttachment releaseLock
1617637364673(Mon Apr 05 15:42:44 UTC 2021) 2458: 22 [Attach API wait loop]: unlocking file /tmp/.com_ibm_tools_attach/2458/attachNotificationSync
1617637364673(Mon Apr 05 15:42:44 UTC 2021) 2458: 22 [Attach API wait loop]: closing /tmp/.com_ibm_tools_attach/2458/attachNotificationSync
1617637365177(Mon Apr 05 15:42:45 UTC 2021) 2458: 23 [Attachment 32835]: doCommand ATTACH_LOADAGENT(instrument,/opt/surgery/surgery.jar=[...])
1617637365178(Mon Apr 05 15:42:45 UTC 2021) 2458: 23 [Attachment 32835]: loadAgentLibrary instrument:/opt/surgery/surgery.jar=[...] decorate=true
1617637365621(Mon Apr 05 15:42:45 UTC 2021) 2458: 23 [Attachment 32835]: streamSend ATTACH_ACK
1617637365624(Mon Apr 05 15:42:45 UTC 2021) 2458: 23 [Attachment 32835]: doCommand ATTACH_DETACH
1617637365624(Mon Apr 05 15:42:45 UTC 2021) 2458: 23 [Attachment 32835]: streamSend ATTACH_DETACHED
jextract
Recent versions of IBM Java do not require running jextract on the core dump for memory analysis (Java 5 >= SR12, Java 6 >= SR9, etc.). The reason is that the dump readers (DTFJ) are able to read operating system core dump files directly using DirectDumpReader (DDR) technology.
However, jextract is useful for investigating native memory issues because jextract will gather the java executable and native libraries which may be loaded into a debugger along with the core dump.
Jextract -interactive runs on the core file itself, not the jextracted ZIP. Example output:
# jextract -interactive core.20100624.110917.7576.0001.dmp
Loading dump file...
Read memory image from core.20100624.110917.7576.0001.dmp
Jextract interactive mode.
Type '!j9help' for help.
Type 'quit' to quit.
(Commands must be prefixed with '!')
>
!findallcallsites (or !dumpallsegments)
Searching for all memory block callsites...
Finished search. Bytes scanned: 4294958661
 total alloc   | largest
 blocks| bytes | bytes | callsite
-------+-------+-------+-------+-------+-------+-------+-------+-------+-------
      1      11      11 common/j9nls.c:427
      1     176     176 ParallelGlobalGC.cpp:162...
jcmd
OpenJ9 provides the jcmd tool:
Pass the PID followed by the command. List available commands:
$ jcmd 2440 help
Dump.heap
Dump.java
Dump.snap
Dump.system
GC.class_histogram
GC.heap_dump
GC.run
Thread.print
help
List the help contents for a particular command:
$ jcmd 2440 help Dump.java
Dump.java: Create a javacore file.
 Format: Dump.java <file path>
 <file path> is optional, otherwise a default path/name is used.
 Relative paths are resolved to the target's working directory.
 The dump agent may choose a different file path if the requested file exists.
Example requesting a javacore:
$ jcmd 2440 Dump.java
Dump written to /home/was/javacore.20200302.213647.2440.1.txt
Help for the commands above:
$ for i in $(jcmd 2440 help); do jcmd 2440 help $i; done
Dump.heap: Create a heap dump.
 Format: Dump.heap <file path>
 <file path> is optional, otherwise a default path/name is used.
 Relative paths are resolved to the target's working directory.
 The dump agent may choose a different file path if the requested file exists.
GC.heap_dump is an alias for Dump.heap
Dump.java: Create a javacore file.
 Format: Dump.java <file path>
 <file path> is optional, otherwise a default path/name is used.
 Relative paths are resolved to the target's working directory.
 The dump agent may choose a different file path if the requested file exists.

Dump.snap: Dump the snap trace buffer.
 Format: Dump.snap <file path>
 <file path> is optional, otherwise a default path/name is used.
 Relative paths are resolved to the target's working directory.
 The dump agent may choose a different file path if the requested file exists.

Dump.system: Create a native core file.
 Format: Dump.system <file path>
 <file path> is optional, otherwise a default path/name is used.
 Relative paths are resolved to the target's working directory.
 The dump agent may choose a different file path if the requested file exists.

GC.class_histogram: Obtain heap information about a Java process
 Format: GC.class_histogram [options]
 Options:
          all : include all objects, including dead objects (this is the default option)
         live : include all objects after a global GC collection
NOTE: this utility may significantly affect the performance of the target VM.

GC.heap_dump: Create a heap dump.
 Format: Dump.heap <file path>
 <file path> is optional, otherwise a default path/name is used.
 Relative paths are resolved to the target's working directory.
 The dump agent may choose a different file path if the requested file exists.
GC.heap_dump is an alias for Dump.heap
GC.run: Run the garbage collector.
 Format: GC.run
NOTE: this utility may significantly affect the performance of the target VM.

Thread.print: List thread information.
 Format: Thread.print [options]
 Options: -l : print information about ownable synchronizers

help: Show help for a command
 Format:  help <command>
 If no command is supplied, print the list of available commands on the target JVM.
-Xdump
Changing the Default Directory of Dump Artifacts
On recent versions of Java, change the default directory of dump artifacts with the generic JVM argument:
-Xdump:directory=$DIRFor particular dump types:
-Xdump:java:defaults:file=/var/dumps/javacore.%Y%m%d.%H%M%S.%pid.%seq.txtStack Traces of Large Object Allocations
The filter is the number of megabytes:
-Xdump:stack:events=allocation,filter=#5mExample output in stderr:
JVMDUMP039I Processing dump event "allocation", detail "5242880 bytes, type java.util.concurrent.ConcurrentHashMap$HashEntry[]" at 2015/09/14 07:36:49 - please wait.
Thread=main (00007F8830007C30) Status=Running
    at java/util/concurrent/ConcurrentHashMap$HashEntry.newArray(I)[Ljava/util/concurrent/ConcurrentHashMap$HashEntry; (ConcurrentHashMap.java:311) (Compiled Code)
    ...
To get a core dump instead, for example:
-Xdump:system:events=allocation,filter=#20m,range=1..1,request=exclusive+prepwalkThrown Exceptions
-Xdump may be used to execute agents when an exception
is thrown, including from a particular method. For example:
-Xdump:system:events=throw,range=1..1,request=exclusive+prepwalk,filter=java/lang/NullPointerException#com/ibm/SomeClass.fooStarting with Java 8, exceptions may be further filtered by the exception message. For example, to trigger a javacore on a java/lang/VerifyError exception that contains the text string "wrong initializer"
-Xdump:java:events=throw,filter=java/lang/VerifyError,msg_filter=*wrong initializer*Tool Agent
The tool agent may be used to execute arbitrary process commands. For example, to print /proc/meminfo on Linux when there is an OOM:
-Xdump:tool:events=systhrow,filter=java/lang/OutOfMemoryError,request=exclusive+prepwalk,range=1..0,priority=999,exec="cat /proc/%pid/smaps > smaps.%Y%m%d.%H%M%S.%pid.%seq.txt; cat /proc/meminfo > meminfo.%Y%m%d.%H%M%S.%pid.%seq.txt"Running a command on the last artifact produced:
-Xdump:tool:events=user,exec="bin/jextract %last"Caught Exceptions
-Xdump may be used to execute agents when an exception
is caught, including from a particular method. For example:
-Xdump:system:events=catch,request=exclusive,range=1..1,filter=*#Play.fooUse the second number in the range option to control the maximum number of core dumps produced. In the above example, no more than 1 cores will be produced.
The system dump agent is often useful because the system dump can be loaded in a tool such as the Memory Analyzer Tool and various stack frame locals may be reviewed that may help understand the exception.
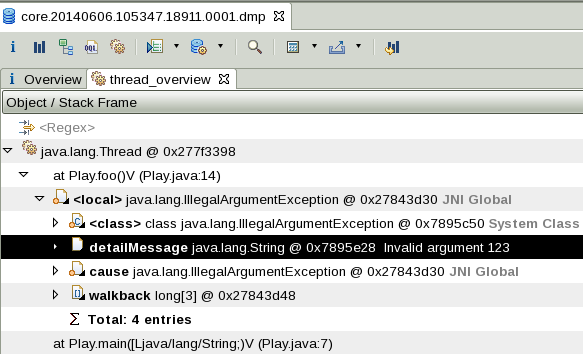
In general, it's a malpractice to catch an exception and suppress its detailed information (the best practice is to re-throw it or log the details). For example:
public class Play {
  public void foo() {
    try {
      // Work
    } catch (Throwable t) {
    }
  }
}
The TechNote above goes over how to correctly deal with this situation, but sometimes it's difficult to quickly update code when there's a problem. If we know which method is catching the exception, then we can just use the above technique to find the cause.
-Xtrace
Until Java 7.1, enabling certain -Xtrace options may affect the performance of the entire JVM (see the -Xtrace section in the IBM Java chapter).
If you want to dump the default Xtrace to stderr, use
-Xtrace:print=all{level1},exception=j9mm{gclogger}
Tracing Methods
The simplest usage of -Xtrace is to trace entry and exit of some method(s). For example (this uses a wildcard to match all methods of a class):
-Xtrace:print=mt,methods={com/ibm/ws/kernel/launch/internal/FrameworkManager.*}Example output (goes to stderr):
20:45:41.867 0x1b34700              mt.0        > com/ibm/ws/kernel/launch/internal/FrameworkManager.addShutdownHook(Z)V bytecode method, this = 0xe014d508
20:45:41.868 0x1b34700              mt.6        < com/ibm/ws/kernel/launch/internal/FrameworkManager.addShutdownHook(Z)V bytecode method
The text () may be added after the method name(s) to add
additional lines of output showing passed-in arguments and returned
results (if the method has not been JIT-compiled yet):
-Xtrace:print=mt,methods={java/nio/HeapByteBuffer.getShort()}Example output:
17:23:43.134 0x11b06400              mt.0        > java/nio/HeapByteBuffer.getShort()S bytecode method, this = 0x7fff903c8
17:23:43.134 0x11b06400              mt.18       - this: java/nio/HeapByteBuffer@00000007FFF903C8 method arguments: ()
17:23:43.134 0x11b06400              mt.6        < java/nio/HeapByteBuffer.getShort()S bytecode method
17:23:43.134 0x11b06400              mt.28       - return value: (short)0
The method may be JIT-excluded to always print the additional information although this may have a large performance impact. For example:
-Xjit:exclude={java/nio/HeapByteBuffer.getShort()*}A stack trace may be dumped with the trigger option to show which method is calling the traced method:
-Xtrace:iprint=mt,methods={com/ibm/ws/kernel/launch/internal/FrameworkManager.launchFramework()},trigger=method{com/ibm/ws/kernel/launch/internal/FrameworkManager.launchFramework,jstacktrace}Example output:
20:45:41.034 0x1b34700              mt.0        > com/ibm/ws/kernel/launch/internal/FrameworkManager.launchFramework(Lcom/ibm/ws/kernel/boot/BootstrapConfig;Lcom/ibm/wsspi/logprovider/LogProvider;)V bytecode method, this = 0xffe89298
20:45:41.034 0x1b34700              mt.18       - this: com/ibm/ws/kernel/launch/internal/FrameworkManager@00000000FFE89298 method arguments: (com/ibm/ws/kernel/boot/BootstrapConfig@00000000E0030150,com/ibm/ws/logging/internal/impl/LogProviderImpl@00000000E00ACEE8)
20:45:41.035 0x1b34700       j9trc_aux.0        - jstacktrace:
20:45:41.035 0x1b34700       j9trc_aux.1        - [1] com.ibm.ws.kernel.launch.internal.FrameworkManager.launchFramework (FrameworkManager.java:198)
20:45:41.035 0x1b34700       j9trc_aux.1        - [2] com.ibm.ws.kernel.launch.internal.LauncherDelegateImpl.doFrameworkLaunch (LauncherDelegateImpl.java:114)
20:45:41.035 0x1b34700       j9trc_aux.1        - [3] com.ibm.ws.kernel.launch.internal.LauncherDelegateImpl.launchFramework (LauncherDelegateImpl.java:100)
20:45:41.035 0x1b34700       j9trc_aux.1        - [4] com.ibm.ws.kernel.boot.internal.KernelBootstrap.go (KernelBootstrap.java:213)
20:45:41.035 0x1b34700       j9trc_aux.1        - [5] com.ibm.ws.kernel.boot.Launcher.handleActions (Launcher.java:241)
20:45:41.035 0x1b34700       j9trc_aux.1        - [6] com.ibm.ws.kernel.boot.Launcher.createPlatform (Launcher.java:117)
20:45:41.035 0x1b34700       j9trc_aux.1        - [7] com.ibm.ws.kernel.boot.cmdline.EnvCheck.main (EnvCheck.java:59)
20:45:41.035 0x1b34700       j9trc_aux.1        - [8] com.ibm.ws.kernel.boot.cmdline.EnvCheck.main (EnvCheck.java:35)
Instead of printing to stderr, you may print to binary files and then post-process them (ideally using the same version of Java that produced them) to dump human-readable output. For example:
-Xtrace:methods={com/ibm/ws/kernel/launch/internal/FrameworkManager.*},output={jvmtrace#.trc,100M,10},maximal=mtThen on each jvmtrace*.trc file, run the trace
formatter; for example:
$ java com.ibm.jvm.TraceFormat jvmtrace0.trcForced Garbage Collections
Forced garbage collections (System.gc() or Runtime.gc()) can be investigated by printing stack traces whenever they're called using the generic JVM argument:
-Xtrace:trigger=method{java/lang/Runtime.gc,jstacktrace},print=mtOutput goes to native_stderr.log. There may be some
performance overhead to this option so before running in production (see
the -Xtrace
section in the IBM Java chapter), so test the overhead in a test
environment. Example output:
12:02:55.436*0x191de00 mt.2 > java/lang/Runtime.gc()V Native method, This = 1b24188
12:02:55.463 0x191de00 mt.18 - Instance method receiver: java/lang/Runtime@00002B8F6249AA70 arguments: ()
12:02:55.463 0x191de00j9trc_aux.0 - jstacktrace:
12:02:55.464 0x191de00j9trc_aux.1 - [1] java.lang.Runtime.gc (Native Method)
12:02:55.464 0x191de00j9trc_aux.1 - [2] java.lang.System.gc (System.java:278)
12:02:55.464 0x191de00j9trc_aux.1 - [3] Test.main (Test.java:3)
If you are on IBM Java >=6 and < 7.1, then you may instead use -Xdump:stack:events=fullgc
This will print a stack trace to stderr every time a full garbage collection occurs:
Thread=WebContainer : 263509055 (F6C04688) Status=Running
    at java/lang/Runtime.gc()V (Native Method)
    at java/lang/System.gc()V (System.java:312)
    at Test.main([Ljava/lang/String;)V (Test.java:6)
JVMDUMP013I Processed dump event "fullgc", detail "".
However, it will also print a stack any time a full GC occurs for non-explicit reasons. You can simply look for any stacks that begin with Runtime.gc to figure out which ones are explicit.
Requesting Full GCs
If it is required to request full GCs, here are some options (assuming -Xdisableexplicitgc is not set):
- MBean: MemoryMXBean.gc
- Create a JSP/Servlet or other type of application that executes System.gc based on some HTTP request or other input
- Use the Java Surgery tool with -command CollectGarbage (this one is probably the closest to jcmd, although see the caveats on the page)
- Use -Xdump or -Xtrace to trigger on certain method invocations (hard to configure)
- Request a heapdump: this will force a GC as part of taking the heapdump
Stack Traces of the Sources of Threads
The sources of threads may be tracked by dumping where those threads are instantiated, which is likely the code that will subsequently spawn those threads. For example, if there is a thread with the following stack:
3XMTHREADINFO3  Java callstack:
4XESTACKTRACE     at java/lang/Object.wait(Native Method)
4XESTACKTRACE     at java/lang/Object.wait(Object.java:196(Compiled Code))
4XESTACKTRACE     at java/lang/ref/ReferenceQueue.remove(ReferenceQueue.java:102(Compiled Code))
4XESTACKTRACE     at sun/rmi/transport/DGCClient$EndpointEntry$RenewCleanThread.run(DGCClient.java:492(Compiled Code))
4XESTACKTRACE     at java/lang/Thread.run(Thread.java:736(Compiled Code))
Then the thread class is
sun/rmi/transport/DGCClient$EndpointEntry$RenewCleanThread.
Next, construct an -Xtrace option which prints the stack
trace of the constructor call to stderr. For example:
-Xtrace:print=mt,methods={sun/rmi/transport/DGCClient$EndpointEntry$RenewCleanThread.<init>*},trigger=method{sun/rmi/transport/DGCClient$EndpointEntry$RenewCleanThread.<init>*,jstacktrace}As another example, for Timers with stacks such as:
3XMTHREADINFO      "Thread-2572" ...
3XMTHREADINFO3           Java callstack:
4XESTACKTRACE                at java/lang/Object.wait(Native Method)
4XESTACKTRACE                at java/lang/Object.wait(Object.java:196(Compiled Code))
4XESTACKTRACE                at java/util/Timer$TimerImpl.run(Timer.java:246(Compiled Code))
5XESTACKTRACE                   (entered lock: java/util/Timer$TimerImpl@0x0000000720737468, entry count: 1)
Add the following generic JVM argument:
-Xtrace:print=mt,methods={java/util/Timer$TimerImpl.<init>*},trigger=method{java/util/Timer$TimerImpl.<init>*,jstacktrace}Example output:
20:05:02.535*0x23b3f500              mt.0        > java/util/Timer$TimerImpl.<init>(Ljava/lang/String;Z)V Bytecode method, This = 20884938
20:05:02.535 0x23b3f500       j9trc_aux.0        - jstacktrace:
20:05:02.535 0x23b3f500       j9trc_aux.1        - [1] java.util.Timer$TimerImpl.<init> (Timer.java:201)
20:05:02.535 0x23b3f500       j9trc_aux.1        - [2] java.util.Timer.<init> (Timer.java:364)
20:05:02.535 0x23b3f500       j9trc_aux.1        - [3] com.ibm.TimerTestServlet.service (TimerTestServlet.java:22)...
20:05:02.535 0x23b3f500              mt.6        < java/util/Timer$TimerImpl.<init>(Ljava/lang/String;Z)V Bytecode method
Enabling certain -Xtrace options may affect the performance of the entire JVM on older versions of Java (see the -Xtrace section).
I/O Tracing
-Xtrace:none,maximal=j9scar.136,trigger=tpnid{j9scar.136,jstacktrace},output={"trace_%p.bin",100m}Network Tracing
To enable tracing for the SDK's java/net classes, you may use:
-Xtrace:methods={java/net/*},print=mtThis writes to native_stderr.log. For example:
20:32:41.615 0x13d86800              mt.0        > java/net/InetAddress.getCanonicalHostName()Ljava/lang/String; Bytecode method, This = 4125660
20:32:41.615 0x13d86800              mt.18       - Instance method receiver: java/net/Inet4Address@0000000004125660 arguments: ()
20:32:41.855 0x13d86800              mt.6        < java/net/InetAddress.getCanonicalHostName()Ljava/lang/String; Bytecode method
Equivalently, the trace may be sent to files. For example:
-Xtrace:methods={java/net/*},output={jvmtrace#.trc,100M,10},maximal=mtThen on each jvmtrace*.trc file, run the trace
formatter; for example:
$ java com.ibm.jvm.TraceFormat jvmtrace0.trcIn the following example, we can see the first call doesn't find the host name in the cache, then puts it in the cache:
21:07:36.564789000  0x0000000013c6ba00 mt.0                Entry      >java/net/InetAddress.getCanonicalHostName()Ljava/lang/String; Bytecode method, This = 0x435f2b0
21:07:36.564790000  0x0000000013c6ba00 mt.18               Event       Instance method receiver: java/net/Inet4Address@0x435f2b0 arguments: ()
...
21:07:36.783388000  0x0000000013c6ba00 mt.3                Entry      >java/net/InetAddress.cacheAddress(Ljava/lang/String;Ljava/lang/Object;Z)V Bytecode static method
...
21:07:36.783425000  0x0000000013c6ba00 mt.0                Entry      >java/net/InetAddress$Cache.put...
s = 0x1f0e930
21:07:36.783428000  0x0000000013c6ba00 mt.18               Event       Instance method receiver: java/net/InetAddress$Cache@0x1f0e930 arguments: (java/lang/String@00000000043A9D60...
000043AA260)
...
21:07:36.783656000  0x0000000013c6ba00 mt.6                Exit       <java/net/InetAddress.getCanonicalHostName()Ljava/lang/String; Bytecode method
In the next call, there is no put; therefore, it found it in the cache:
21:07:41.373200000  0x0000000013c6ba00 mt.0                Entry      >java/net/InetAddress.getCanonicalHostName()Ljava/lang/String; Bytecode method, This = 0x43ba250
21:07:41.373201000  0x0000000013c6ba00 mt.18               Event       Instance method receiver: java/net/Inet4Address@0x43ba250 arguments: ()
...
21:07:41.493092000  0x0000000013c6ba00 mt.3                Entry      >java/net/InetAddress.getCachedAddress(Ljava/lang/String;)Ljava/lang/Object; Bytecode static method
...
21:07:41.493165000  0x0000000013c6ba00 mt.6                Exit       <java/net/InetAddress.getCanonicalHostName()Ljava/lang/String; Bytecode method
Enabling certain -Xtrace options may affect the performance of the entire JVM on older versions of Java (see the -Xtrace section).
Debugging File Leaks
If core dump analysis does not discover the cause of file leaks (this may be particularly difficult on Windows when a particular leaked file must be found, because the file descriptor identifiers in Java objects do not directly map to Windows HANDLE addresses), then IO trace points may be used. IO trace points differ by operating system, so you may start with all IO trace points (print=IO), but in this example we show Windows trace points:
-Xtrace:print=IO.100-105,trigger=tpnid{IO.103,jstacktrace}This also adds jstacktrace on IO.103 which is a file open.
21:40:27.491 0x2479c200              IO.103      > IO_CreateFileW(filename=C:\WAS\profiles\...\.metadata\.plugins\...\properties.version...
21:40:27.491 0x2479c200       j9trc_aux.0        - jstacktrace:
21:40:27.491 0x2479c200       j9trc_aux.1        - [1] java.io.FileOutputStream.open (Native Method)
21:40:27.491 0x2479c200       j9trc_aux.1        - [2] java.io.FileOutputStream.<init> (FileOutputStream.java:233) (Compiled Code)
21:40:27.491 0x2479c200       j9trc_aux.1        - [3] java.io.FileOutputStream.<init> (FileOutputStream.java:183) (Compiled Code)
21:40:27.491 0x2479c200       j9trc_aux.1        - [4] org.eclipse.core.internal.localstore.BucketTree.saveVersion (BucketTree.java:145)
21:40:27.491 0x2479c200       j9trc_aux.1        - [5] org.eclipse.core.internal.localstore.BucketTree.close (BucketTree.java:80)
21:40:27.491 0x2479c200       j9trc_aux.1        - [6] org.eclipse.core.internal.properties.PropertyManager2.shutdown (PropertyManager2.java:169)
21:40:27.491 0x2479c200       j9trc_aux.1        - [7] org.eclipse.core.internal.resources.Workspace.shutdown (Workspace.java:1829)
21:40:27.491 0x2479c200       j9trc_aux.1        - [8] org.eclipse.core.internal.resources.Workspace.close (Workspace.java:369)
21:40:27.491 0x2479c200       j9trc_aux.1        - [9] org.eclipse.core.resources.ResourcesPlugin.shutdown (ResourcesPlugin.java:344)
21:40:27.491 0x2479c200       j9trc_aux.1        - [10] org.eclipse.core.internal.compatibility.PluginActivator.stop (PluginActivator.java:46)
21:40:27.491 0x2479c200       j9trc_aux.1        - [11] org.eclipse.osgi.framework.internal.core.BundleContextImpl$2.run (BundleContextImpl.java:843)
21:40:27.491 0x2479c200       j9trc_aux.1        - [12] java.security.AccessController.doPrivileged (AccessController.java:341) (Compiled Code)
21:40:27.491 0x2479c200       j9trc_aux.1        - [13] org.eclipse.osgi.framework.internal.core.BundleContextImpl.stop (BundleContextImpl.java:836)
21:40:27.491 0x2479c200       j9trc_aux.1        - [14] org.eclipse.osgi.framework.internal.core.BundleHost.stopWorker (BundleHost.java:501)
21:40:27.491 0x2479c200       j9trc_aux.1        - [15] org.eclipse.osgi.framework.internal.core.AbstractBundle.suspend (AbstractBundle.java:550)
21:40:27.491 0x2479c200       j9trc_aux.1        - [16] org.eclipse.osgi.framework.internal.core.Framework.suspendBundle (Framework.java:1101)
21:40:27.491 0x2479c200       j9trc_aux.1        - [17] org.eclipse.osgi.framework.internal.core.StartLevelManager.decFWSL (StartLevelManager.java:597)
21:40:27.491 0x2479c200       j9trc_aux.1        - [18] org.eclipse.osgi.framework.internal.core.StartLevelManager.doSetStartLevel (StartLevelManager.java:257)
21:40:27.491 0x2479c200       j9trc_aux.1        - [19] org.eclipse.osgi.framework.internal.core.StartLevelManager.shutdown (StartLevelManager.java:215)
21:40:27.491 0x2479c200       j9trc_aux.1        - [20] org.eclipse.osgi.framework.internal.core.InternalSystemBundle.suspend (InternalSystemBundle.java:266)
21:40:27.491 0x2479c200       j9trc_aux.1        - [21] org.eclipse.osgi.framework.internal.core.Framework.shutdown (Framework.java:694)
21:40:27.491 0x2479c200       j9trc_aux.1        - [22] org.eclipse.osgi.framework.internal.core.Framework.close (Framework.java:592)
21:40:27.491 0x2479c200       j9trc_aux.1        - [23] org.eclipse.osgi.framework.internal.core.InternalSystemBundle$1.run (InternalSystemBundle.java:243)
21:40:27.491 0x2479c200       j9trc_aux.1        - [24] java.lang.Thread.run (Thread.java:863)
21:40:27.492 0x2479c200              IO.105      < IO_CreateFileW - return code=5072
21:40:27.492 0x2479c200              IO.100      > IO_CloseHandle(Handle=5072)
21:40:27.492 0x2479c200              IO.102      < IO_CloseHandle - return code=1
In the above example, an open returns the file handle 5072 (the result in the method exit of CreateFileW), and that is immediately followed by a CloseHandle on 5072, which succeeds. Finding an open without a close will discover the leak.
Tracing Profiler
See https://www-01.ibm.com/support/docview.wss?uid=swg21657391
jdmpview
List all instances of a class
> x/j java/lang/StringShow details of a class
> info class java/lang/StringJava object information
> x/j 0xfcdd4b58
         heap #1 - name: Generational@145a9013c6c0

          java/lang/String @ 0xfcdd4b58
           declared fields:
            private final char[] value = <object> @ 0xfcdd4bd8
            private final int count = 14 (0xe)
            private int hashCode = 0 (0x0)

            references:
              0xfcdd4bd8
Detailed information:
> !j9object 0xfcdd4b58
J9VMJavaLangString at 0x00000000FCDD4B58 {
struct J9Class* clazz = !j9class 0x1294B00 // java/lang/String
Object flags = 0x00000030;
[C value = !fj9object 0xfcdd4bd8 (offset = 0) (java/lang/String)
I count = 0x0000000E (offset = 4) (java/lang/String)
I hashCode = 0x00000000 (offset = 8) (java/lang/String)
"/daytrader/app"
}
Static fields of a class with pointer
> !j9statics 0x1294B00
Static fields in java/lang/String:
        0x0000000001294F00 serialVersionUID J (!j9romstaticfieldshape 0x0000145A4F06B218) = 0xA0F0A4387A3BB342 (-6849794470754667710)
        [...]
Dump arbitrary memory
Dump arbitrary memory:
> xx 0xf1afdc10,10,4
0xf1afdc10 :  4C6DB928 00000000 E1A88FD0 00000000 [ (.mL............]
In the above example, 4C6DB928 was a Java object.
Extracting Xtrace
Use the !snapformat command to extract the Xtrace
buffers.
The second column is the thread ID which may be inspected with
!j9vmthread. For example:
15:45:48.434563585 *0x58AE400 j9vm.361             Entry      >Attempting to acquire exclusive VM access.

> !j9vmthread 0x58AE400
    0xa0: j9object_t threadObject = !j9object 0x0000000048BA4D50 // com/Test/MyThread
What caused a core dump
- Run
!snapformatto format the Xtrace and search for the core dump file name:> !snapformat | grep core.20200804.025942.3576.0001.dmp 02:59:42.174160000 *0x1981C00 j9dmp.9 Event Preparing for dump, filename=/opt/ibm/wlp/output/defaultServer/core.20200804.025942.3576.0001.dmp - Take the thread ID of that message and search the Xtrace for that
thread and look at the end of the output:
> !snapformat | grep 0x1981C00 02:59:42.016594000 *0x1981C00 j9vm.294 Entry >setCurrentException index=11 constructorIndex=0 detailMessage=0xf0001ad0 02:59:42.016612000 0x1981C00 j9vm.10 Entry >internalSendExceptionConstructor 02:59:42.016620000 *0x1981C00 j9vm.246 Entry >dispatchAsyncEvents asyncEventFlags=0x4 02:59:42.016627000 0x1981C00 j9vm.247 Event call event handler: handlerKey=2 eventHandler=0x145a8df844e0 userData=0x0 02:59:42.016642000 *0x1981C00 j9vm.248 Exit <dispatchAsyncEvents 02:59:42.172975000 *0x1981C00 j9vm.11 Exit <internalSendExceptionConstructor 02:59:42.174160000 *0x1981C00 j9dmp.9 Event Preparing for dump, filename=/opt/ibm/wlp/output/defaultServer/core.20200804.025942.3576.0001.dmp - Take the address of the
detailMessageobject in thesetCurrentExceptionmessage and print that object:> !j9object 0xf0001ad0 J9VMJavaLangString at 0x00000000F0001AD0 { struct J9Class* clazz = !j9class 0x1294B00 // java/lang/String Object flags = 0x00000000; [C value = !fj9object 0xf0001ae0 (offset = 0) (java/lang/String) I count = 0x0000000F (offset = 4) (java/lang/String) I hashCode = 0x00000000 (offset = 8) (java/lang/String) "Java heap space" - In this example, the
detailMessage"Java heap space" means it was due to a Java OutOfMemoryError.
There may also be messages like the following showing a fatal allocation failure and its size:
15:45:48.464090000 *0x0 j9mm.101 Event J9AllocateIndexableObject() returning NULL! 277962536 bytes requested for object of class 0x87f00 from memory space 'Generational' id=0x3ff900852b0Strong paths to GC roots
NOTE: These queries also provide paths through phantom, weak, soft, and finalizable references which should be ignored if searching for a strong path to GC roots.
!strongrootpathfindall 0x...This command is the same as !rootpathfindall.
Or just the first one:
!strongrootpath 0x...This command is the same as !rootpathfind.
Find details about an object and its heap generation
whatis 0x...Search for object references
!findall pointer 0x...Accumulated CPU time of threads
Accumulated CPU time in javacores are queried when producing a javacore but no such standardized information is in core dumps; however, z/OS and Windows can get such information from the OS structures.
- On Windows
using
info thread:
Multiply each by 100 to get nanoseconds.KernelTime=200625000 UserTime=207656250
Advanced Commands
Object size histogram
Show class histogram of object sizes, excluding static memory usage (the final line under the "Space used" column shows total heap usage [reachable and unreachable]):
> !objectsizeinfo

Object field size summary
=========================
Class                    Total size  Data size  Space used  Instances  char  byte     short   int    long  float  double  boolean  object   hidden
-----------------------  ----------  ---------  ----------  ---------  ----  -------  ------  -----  ----  -----  ------  -------  -------  ------
boolean[]                N/A         N/A        32400       916        0     0        0       0      0     0      0       0        0        0
boolean[][]              N/A         N/A        128         3          0     0        0       0      0     0      0       0        0        0
byte[]                   N/A         N/A        61279440    8180       0     0        0       0      0     0      0       0        0        0
byte[][]                 N/A         N/A        4440        41         0     0        0       0      0     0      0       0        0        0
char[]                   N/A         N/A        16388632    153884     0     0        0       0      0     0      0       0        0        0
char[][]                 N/A         N/A        343224      21126      0     0        0       0      0     0      0       0        0        0
char[][][]               N/A         N/A        456         2          0     0        0       0      0     0      0       0        0        0
com/ibm/AllocateObject   16          12*        16          1          0     0        0       0      0     0      0       0        0        0
[...]
Class                    Total size  Data size  Space used  Instances  char  byte     short   int    long  float  double  boolean  object   hidden
Heap summary             34832704    22956148   123317456   1529720    719   1763123  155493  41343  0     0      0       0        2651309  5199
Native memory usage
!nativememinfo dumps out the same structure that's
commonly used in javacores:
> !nativememinfo
JRE: 14,115,609,464 bytes / 65049 allocations
+--VM: 13,622,156,544 bytes / 55708 allocations
|  +--Classes: 245,835,968 bytes / 32251 allocations
Java heap segments
To find out the size of the Java heap:
> !dumpallregions
+----------------+----------------+----------------+----------------+--------+----------------+----------------------
|    region      |     start      |      end       |    subspace    | flags  |      size      |      region type
+----------------+----------------+----------------+----------------+--------+----------------+----------------------
 000000500867eb00 0000000080000000 000000009acc0000 000000500862add0 00000009         1acc0000 ADDRESS_ORDERED
 000000500867ee30 000000009acc0000 000000009f7a0000 000000500862f2e0 0000000a          4ae0000 ADDRESS_ORDERED
 000000500867ed20 000000009f7a0000 00000000a0000000 00000050118d5530 0000000a           860000 ADDRESS_ORDERED
+----------------+----------------+----------------+----------------+--------+----------------+----------------------
All native memory segments
Dump all segments:
> !dumpallsegments
memorySegments - !j9memorysegmentlist 0x66b5a0
+----------------+----------------+----------------+----------------+--------+--------+
|    segment     |     start      |     alloc      |      end       |  type  |  size  |
+----------------+----------------+----------------+----------------+--------+--------+
 00007f24ddc07968 00007f23f151f030 00007f23f15725b0 00007f23f161f030 00800040   100000
 00007f24ddc07c88 00007f23f5ecc030 00007f23f5fcc010 00007f23f5fcc030 00800040   100000 [...]
Loaded native libraries
List loaded native libraries at the time of the dump:
> !dclibs
Showing library list for /opt/dockerdebug/fedorawasdebug/supplemental/exampledata/liberty/verbosegc_and_oom/core.20191106.195108.1845.0001.dmp
exe = java
Lib : java
    Library is not appended to the core file, it may be present on the local disk
Lib : java
    Library is not appended to the core file, it may be present on the local disk
Lib : /lib64/ld-linux-x86-64.so.2
    Library is not appended to the core file, it may be present on the local disk
Lib : /lib64/libpthread.so.0
    Library is not appended to the core file, it may be present on the local disk [...]
Show dump agents
Show registered dump agents:
> !showdumpagents
Registered dump agents
----------------------
-Xdump: [...]
Native allocations by callsite
List known native allocations by callsite:
> !findallcallsites
 total alloc   | largest
 blocks| bytes | bytes | callsite
-------+-------+-------+-------+-------+-------+-------+-------+-------+-------
   3043 65892984   74168 segment.c:233
Native allocations by one callsite
List native allocations by a particular callsite:
> !findcallsite dmpagent.c:1713
 !j9x 0x00002B248403AA90,0x0000000000000078    dmpagent.c:1713
 !j9x 0x00002B248403AB50,0x0000000000000078    dmpagent.c:1713
 !j9x 0x00002B248403AC10,0x0000000000000078    dmpagent.c:1713
 !j9x 0x00002B248403ACD0,0x0000000000000078    dmpagent.c:1713
 !j9x 0x00002B248403AD90,0x0000000000000078    dmpagent.c:1713
 !j9x 0x00002B248403AE50,0x0000000000000078    dmpagent.c:1713
 !j9x 0x00002B248403AF10,0x0000000000000078    dmpagent.c:1713
 !j9x 0x00002B248403AFD0,0x0000000000000078    dmpagent.c:1713
 !j9x 0x00002B24EC083520,0x0000000000000078    dmpagent.c:1713
Call site count = 9
If investigating a triggerDump API call, the last callsite can be cast to the expected struct:
> !J9RASdumpAgent 0x00002B24EC083520
J9RASdumpAgent at 0x2b24ec083520 {
  Fields for J9RASdumpAgent:
    0x0: struct J9RASdumpAgent * nextPtr = !j9rasdumpagent 0x0000000000000000
    0x8: void * shutdownFn = !j9x 0x00002B2483DA2240
    0x10: UDATA eventMask = 0x00000000004A2000 (4857856)
    0x18: char * detailFilter = !j9x 0x0000000000000000
    0x20: UDATA startOnCount = 0x0000000000000001 (1)
    0x28: UDATA stopOnCount = 0x0000000000000000 (0)
    0x30: UDATA count = 0x0000000000000000 (0)
    0x38: char * labelTemplate = !j9x 0x00002B2484034BF0 // "/opt/IBM/WebSphere/AppServer/profiles/AppSrv01/cor..."
    0x40: void * dumpFn = !j9x 0x00002B2483DA5660
    0x48: char * dumpOptions = !j9x 0x0000000000000000
    0x50: void * userData = !j9x 0x0000000000000000
    0x58: UDATA priority = 0x00000000000003E7 (999)
    0x60: UDATA requestMask = 0x0000000000000008 (8)
    0x68: UDATA prepState = 0x0000000000000101 (257)
    0x70: char * subFilter = !j9x 0x0000000000000000
}
The requestMask lists the request options
Check if core dump is in an exclusively locked state
- Find the
j9javampointer:> !context *0 : PID: 4374; !j9javavm 0x153a38026560 - Print it and search for
exclusiveAccessState:> !j9javavm 0x153a38026560 | grep exclusiveAccessState 0x1968: UDATA exclusiveAccessState = 0x0000000000000002 (2) - Review the bit
flag value:
#define J9_XACCESS_NONE 0
#define J9_XACCESS_PENDING 1
#define J9_XACCESS_EXCLUSIVE 2
#define J9_XACCESS_HANDING_OFF 3
#define J9_XACCESS_HANDED_OFF 4
#define J9_XACCESS_HANDING_OFF_FROM_EXTERNAL_THREAD 5
Check which thread has exclusive access in a core dump
- Find all threads whose
publicFlagsbit flags have J9_PUBLIC_FLAGS_VM_ACCESS (0x20). Ensure that only one thread has this and that all other threads have the bit flag J9_PUBLIC_FLAGS_HALT_THREAD_EXCLUSIVE (0x1). For example,WebContainer : 7has 0x20 and the others have 0x1:
To quickly search for the exclusive access thread:> !threads flags !j9vmthread 0x29106e00 publicFlags=1020 privateFlags=2 inNative=0 // Default Executor-thread-28408 !j9vmthread 0x294d7d00 publicFlags=a1 privateFlags=2 inNative=1 // Default Executor-thread-27795 [...]> !threads flags | grep "20 privateFlags" !j9vmthread 0x29106e00 publicFlags=1020 privateFlags=2 inNative=0 // Default Executor-thread-28408 - Print the details of that thread and search for
omrthread_t:> !j9vmthread 0x29106e00 | grep omrthread_t 0x138: omrthread_t osThread = !j9thread 0x000000595631C648 - Print the
omrthread_tand search fortid:> !j9thread 0x000000595631C648 | grep tid 0x420: uintptr_t tid = 0x00000000275F2800 (660547584) - Remove any
0-padding after0xand pass that toinfo thread:> info thread 0x275F2800 process id: 84410739 thread id: 0x275f2800 registers: PSW = 0x070c0000817384d6 R0 = 0x0000000000000003 R1 = 0x0000000026c90508 R2 = 0x0000005000a3b0cf R3 = 0x000000001c011720 R4 = 0x0000005400000000 R5 = 0x00000000000201bb R6 = 0x00000000078d0401 R7 = 0x0000000001d9d470 R8 = 0x000000006e366f00 R9 = 0x0000000026c90508 R10 = 0x0000000000000000 R11 = 0x0000005000000000 R12 = 0x00000051bf7fec60 R13 = 0x0000005417efcaa0 R14 = 0x000000000170a6ae R15 = 0x0000000000000000 native stack sections: 0x5417efa000 to 0x5417f00000 (length 0x6000) native stack frames: bp: 0x0000005417efbd80 pc: 0x0000000026c8e0f0 ExtraSymbolsModule::CEEOPCT+0x6a40 bp: 0x0000005417efc340 pc: 0x0000000026feed76 ExtraSymbolsModule::pthread_cond_wait+0x1ee bp: 0x0000005417efc4c0 pc: 0x00000000273f7680 libj9thr29.so::monitor_wait_original+0xcb8 bp: 0x0000005417efc640 pc: 0x00000000273fda6c libj9thr29.so::omrthread_monitor_wait+0x84 bp: 0x0000005417efc740 pc: 0x000000007ad628a2 ExtraSymbolsModule::MM_Scavenger::getNextScanCache(MM_EnvironmentStandard*)+0x1062 [...] - To get the
vmStateof the thread:- Find the
OMR_VMThreadusing the J9VMThread above:> !j9vmthread 0x29106e00 | grep omr_vmthread 0x930: struct OMR_VMThread * omrVMThread = !omr_vmthread 0x0000000006B9F3B8 - Search the
OMR_VMThreadforvmState:> !omr_vmthread 0x0000000006B9F3B8 | grep vmState 0x40: uintptr_t vmState = 0x0000000000000000 (0) - A state of
0is the Java interpreter. A state of0x20xxxmeans the thread is performing garbage collection. Other states may be found withJ9VMSTATE_*.
- Find the
Map method address to method name
> !j9method 0x0000000005674478 --> com/example/ExampleClass.play()VDump byte codes of a class
> !classforname com/example/ExampleClass
Searching for classes named 'com/example/ExampleClass' in VM=7f363402a320
!j9class 0x0000000005C22300 named com/example/ExampleClass
Found 1 class(es) named com/example/ExampleClass
> !j9class 0x0000000005C22300 | grep romClass
    0x8: struct J9ROMClass * romClass = !j9romclass 0x00007F342513DEF0
> !dumpromclass 0x00007F342513DEF0
Dump byte codes of a method
> !methodforname com/example/ExampleClass.play
Searching for methods named 'com/example/ExampleClass.play' in VM=0x00007F6BB4013720...
!j9method 0x0000000005674478 --> com/example/ExampleClass.play()V
Found 1 method(s) named com/example/ExampleClass.play
> !bytecodes 0x0000000005674478
  Name: play
  Signature: ()V
  [...]
    0 ldc2lw 70 (long) 0x0000000000000030
    3 lstore 5
    5 aconstnull
    6 astore 7
    8 iconstm1 [...]
Query Min and Max Heap
- Find the
j9javampointer:> !context *0 : PID: 4374; !j9javavm 0x153a38026560 - Find the
gcExtensionspointer:!j9javavm 0x153a38026560 | grep gcExtensions | charsfrom -e j9x 0x000000500B5904D0 - Cast the
gcExtensionspointer to get the min and max heap sizes:> !MM_GCExtensions 0x000000500B5904D0 | grep memoryMax 0x20a8: UDATA memoryMax = 0x0000000100000000 (4294967296) > !MM_GCExtensions 0x000000500B5904D0 | grep initialMemorySize 0x20b0: UDATA initialMemorySize = 0x0000000040000000 (1073741824)
Custom DDR Command
- Create a Java project and place
j9ddr.jaron the classpath - Create a class that extends
com.ibm.j9ddr.tools.ddrinteractive.Commandand uses thecom.ibm.j9ddr.tools.ddrinteractive.annotations.DebugExtensionannotation. For example:import com.ibm.j9ddr.CorruptDataException; import com.ibm.j9ddr.tools.ddrinteractive.Command; import com.ibm.j9ddr.tools.ddrinteractive.Context; import com.ibm.j9ddr.tools.ddrinteractive.DDRInteractiveCommandException; import com.ibm.j9ddr.tools.ddrinteractive.annotations.DebugExtension; import com.ibm.j9ddr.vm29.j9.DataType; import com.ibm.j9ddr.vm29.pointer.generated.J9JavaVMPointer; import com.ibm.j9ddr.vm29.pointer.helper.J9RASHelper; @DebugExtension(VMVersion="*") public class CustomCommand extends Command { { @SuppressWarnings("unused") CommandDescription cd = addCommand("customcommand", "", "Help description"); } @Override public void run(String command, String[] args, Context context, PrintStream out) throws DDRInteractiveCommandException { try { out.println("Hello World"); J9JavaVMPointer jvm = J9RASHelper.getVM(DataType.getJ9RASPointer()); out.println("!j9javavm " + jvm.getHexAddress()); } catch (CorruptDataException e) { throw new DDRInteractiveCommandException("Error processing " + e.getClass().getCanonicalName(), e); } } } - Package the class into a
jarfile. - Run
jdmpviewwith the path to thejarfile. For example:jdmpview -J-Dplugins=$HOME/customddrcommands-1.0-SNAPSHOT.jar -core core.20200804.025942.3576.0001.dmp - Execute your command name with
!in front. For example:> !customcommand Hello World !j9javavm 0x000000500886EF70
Debugging jdmpview
Example enabling DTFJ logging:
> log j9ddr.structure_reader FINEST-Xcheck
-Xcheck:memory
may be used to investigate native memory issues within the JVM
itself.
Snap Traces
Snap traces contain tracepoint data held in JVM trace bufffers (-Xtrace). Think of a snap trace as a black box flight recorder. An example file name is Snap.20140930.025436.9920.0004.trc. To process a snap trace, use the same Java version that produced the file to run the trace formatter on the snap file. For example:
$ java com.ibm.jvm.TraceFormat Snap.20140930.025436.9920.0004.trcIf you are formatting a snap dump from another JVM, download their
*.dat files ($WAS/java/jre/lib/) to a local
directory and then use:
java com.ibm.jvm.format.TraceFormat Snap...trc.gz -datdir $DIROn z/OS, FTP the .dat files down in ASC.
The TraceFormatter will produce an output file with the same name plus a .fmt suffix which is a human readable output of the snap file. For example:
09:54:40.168724484 *0x000000002d2e4e00 j9prt.527           Exception  * j9vmem_reserve_memory (failure)
09:54:40.168736220  0x000000002d2e4e00 j9prt.468           Exception  * allocate_memory32 failed to allocate byteAmount=8388608 callSite=segment.c:211
09:54:40.168740272  0x000000002d2e4e00 j9prt.1049          Exception  * vmem allocate normal region failed. Callsite = segment.c:211, regionSize = 8388608
09:54:40.168744813  0x000000002d2e4e00 j9prt.1045          Exception  * memory32 allocate returned null pointer. Callsite = segment.c:211, byteAmount = 32832
09:54:40.168747956  0x000000002d2e4e00 j9vm.199            Exception  * Failed to allocate memory for segment in list 0x19fa50 (size=32768 type=0x10000)
09:54:40.168768913  0x000000002d2e4e00 j9vm.201            Exit       <allocateMemorySegmentInList result=0x0
09:54:40.168776807  0x000000002d2e4e00 j9vm.94             Exception  * Unable to allocate 1912 bytes for RAM class. Throw OutOfMemoryError
Excessive Direct Byte Buffers
In addition to the section on excessive direct byte buffers in the general Troubleshooting Java chapter, IBM Java offers additional potential mitigations to excessive DBBs:
- Use -Xgc:maxScavengeBeforeGlobal=N to force System.gc()s after every N scavenges. This option may have performance implications.
- Use a non-generational garbage collection policy such as -Xgcpolicy:optthruput or -Xgcpolicy:optavgpause. This option may have performance implications. As the article quoted above mentions, this may not completely solve the issue.
A recent IBM javacore shows how much native memory is currently in use by DirectByteBuffers. For example:
5MEMUSER | | | +--Direct Byte Buffers: 1,865,530,448 bytes / 150746 allocationsDirect byte buffer allocations and frees may be tracked with the following -Xtrace:
-Xtrace:print=j9jcl.335-342For additonal detail:
-Xtrace:none,output={directbytebuffers%p_#.trc,100m,5},maximal=j9jcl.335-342,trigger=tpnid{j9jcl.335-342,jstacktrace}Log files named
directbytebuffers${PID_NUMBER}_${FILECOUNT}.trc will be
written to the current working directory of the JVM, which is normally
the profile directory (i.e. where javacores go by default). For each
file, execute the following command:
${WebSphere}/java/bin/java com.ibm.jvm.TraceFormat directbytebuffersPID_NUMBER.trc directbytebuffersPID_NUMBER.trc.txtFor example:
${WebSphere}/java/bin/java com.ibm.jvm.TraceFormat directbytebuffers30799_0.trc directbytebuffers30799_0.trc.txtCreate a ZIP of the directbytebuffers files and formatting data files:
${WebSphere}/java/bin/jar cvf directbytebuffers.jar directbytebuffers*trc* ${WebSphere}/java/jre/lib/J9TraceFormat.dat ${WebSphere}/java/jre/lib/TraceFormat.datUpload directbytebuffers.jar along with WAS and other logs.
JIT
Excluding JIT methods
The JIT exclude option may only be specified once; however, it
supports a regular expression so multiple methods may be specified with
|. For example:
-Xjit:exclude={java/lang/invoke/MutableCallSite.invalidate*|org/eclipse/ui/application/WorkbenchAdvisor.eventLoopException*}Always JITting methods
-Xjit:{method}(count=0)Tracing the JIT sampler
-Xjit:verbose{sampling}OutOfMemoryError
Starting with IBM Java 6.0.1, a system dump is produced on the first OufOfMemoryError in addition to the previous artifacts (PHD, javacore, snap).
Native OutOfMemoryErrors on 64-bit
There are three broad types of native OutOfMemoryErrors on 64-bit:
- With compressed references, insufficient virtual address space below 4GB for native classes, threads, and monitors.
- Ulimit exhaustion on certain operating systems such as Linux and AIX.
- If malloc or mmap return NULL or fail for any reason (e.g. physical
memory and swap are exhausted). For example, on Linux, with
overcommit_memory=2, if the amount of committed bytes (Committed_ASin /proc/meminfo) will exceed (Swap + (RAM*overcommit_ratio)) or (Swap +overcommit_kbytes).
When using IBM Java in 64-bit mode and with a maximum heap size less than 25GB, then Compressed References (-Xcompressedrefs) are enabled by default (defaults may be different on older versions of Java on some operating systems).
Compressed references will "decrease the size of Java objects and make more effective use of the available space. The result is less frequent garbage collection and improved memory cache utilization."
There are important implications to compressed references related to native OutOfMemoryErrors:
When you are using compressed references, the following structures are allocated in the lowest 4 GB of the address space: Classes, Threads, Monitors. Additionally, the operating system and native libraries use some of this address space. Small Java heaps are also allocated in the lowest 4 GB of the address space. Larger Java heaps are allocated higher in the address space.
Native memory OutOfMemoryError exceptions might occur when using compressed references if the lowest 4 GB of address space becomes full, particularly when loading classes, starting threads, or using monitors. You can often resolve these errors with a larger -Xmx option to put the Java heap higher in the address space.
A command-line option can be used with -Xcompressedrefs to allocate the heap you specify with the -Xmx option, in a memory range of your choice. This option is
-Xgc:preferredHeapBase=<address>, where<address>is the base memory address for the heap. In the following example, the heap is located at the 4GB mark, leaving the lowest 4GB of address space for use by other processes.-Xgc:preferredHeapBase=0x100000000
The first key point is that some maximum heap sizes below 4GB may cause the Java heap to be placed in the 0-4GB address space range (when possible). Compressed references technology works by compressing and decompressing pointers at runtime using bit shift arithmetic. However, if the Java heap can be fit under 4GB, then these extra instructions are not required. In one benchmark, when the Java heap moved above the 0-4GB range, there was a relative throughput decrease of ~2.5%. Note that this 2.5% effect was not under ceteris paribus conditions because the heap size was increased rather than using -Xgc:preferredHeapBase. The purpose of using -Xgc:preferredHeapBase (or alternatively, increasing the maximum heap size) is that you are forcing the JVM to take this performance hit in order to give more space to the native class, thread, and monitor data structures to avoid Native OutOfMemoryErrors (NOOMs).
The second key point is that native class, thread, and monitor data structures must all be allocated below 4GB when using compressed references. The operating system and other native allocations may further limit the available space under 4GB, so if you continue to get native OutOfMemoryErrors even with the Java heap allocated above the 0-4GB range, then you must address the number and size of the class, thread, and monitor data structures. In many cases, this is caused by a class, classloader, or thread leak which you can investigate with various tools, but it's easiest to start off by analyzing the javacore from the NOOM. If there are no leaks, then there may be other ways to reduce these data structures such as reducing reflection inflation, using shared classes, etc.
One option to avoid these problems and NOOMs is to disable compressed references entirely; however, one benchmark shows a 10-20% relative throughput decrease when doing so: "Analysis shows that a 64-bit application without CR yields only 80-85% of 32-bit throughput but with CR yields 90-95%. Depending on application requirements, CR can improve performance up to 20% over standard 64-bit". You may be able to recover some of this drop by increasing L2/L3 processor cache sizes or efficiency (using processor sets). Disabling compressed references will also dramatically increase Java heap usage by up to 70% (because the pointers are doubled, the same Java object reference takes more of the Java heap).
Common causes of exhaustion below 4GB even if the heap is above:
- Too many classes, classloaders, threads, or monitors.
- Too many other, non-Class/Thread/Monitor allocations going below
4GB. Starting with Java 6.0.1 SR8 FP3 and Java 7 SR8 FP10, consider
reserving more of this space for Classes/Threads/Monitors with
-Xmcrs#MB. For older releases, an equivalent but undocumented and unsupported option is-Xgc:suballocatorInitialSize=#MB. - On Windows, its default allocation strategy fills up the virtual
memory below 4GB, which is not
necessary. Set
HKLM\System\CurrentControlSet\Control\Session Manager\Memory Management\AllocationPreferenceto(REG_DWORD)=0x100000
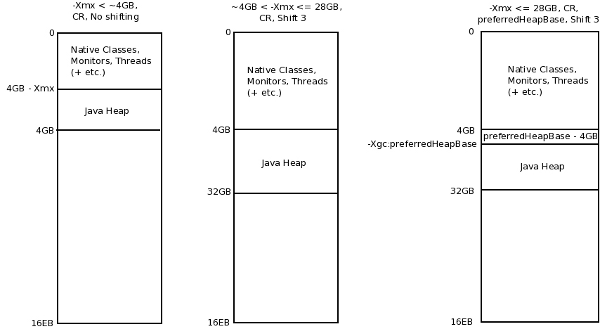
In IBM Java <= 5 for Linux, the IBM_MALLOCTRACE
option is available which calls glibc's mtrace. Starting with IBM Java
6, this option was changed to function equivalent to -Xcheck:memory:all
instead of calling mtrace.
Useful jdmpview commands:
info thread *- In recent versions, includes detailed native thread informationinfo mmap -verbose- On some operating systems such as Linux, includes detailed information available in /proc
Native Stack Size (-Xss)
Due to padding, alignment, and other operating system requirements, the actual native thread stack size may be larger than that specified by -Xss.
Known Crashes
org/eclipse/swt/internal/cairo/Cairo._cairo_fill(Native Method):-Dorg.eclipse.swt.internal.gtk.cairoGraphics=false
Debug Mode
In one case, removing the options -Xdebug -Xnoagent
improved debug performance by 300%. In general, the only required
arguments are
-agentlib:jdwp=transport=dt_socket,server=y,suspend=n,address=7777
LaunchAnywhere
If you see the following error launching the installer:
An internal LaunchAnywhere application error has occured and this application cannot proceed.  (LAX)

Stack Trace:
java.lang.IllegalArgumentException: Malformed \uxxxx encoding.
  at java.util.Properties.loadConvert(Properties.java:618)
  at java.util.Properties.load0(Properties.java:435)
  at java.util.Properties.load(Properties.java:330)
  at com.zerog.common.java.util.PropertiesUtil.loadProperties(Unknown Source)
  at com.zerog.lax.LAX.(DashoA8113)
  at com.zerog.lax.LAX.main(DashoA8113)
Then try first exporting the following environment variables:
export PS1="> "
export TITLEBAR="> "
Build OpenJ9
- Choose the desired version of build instructions
- Follow the instructions for your operating system, ultimately
leading to the final make step and you may instead run:
make images - Execute the JVM:
build/*/images/jdk/bin/java -version
OutOfMemoryErrors Due to Excessive Garbage Collection
There can be cases in Java where the JVM enters a GC thrashing
condition and never throws an OutOfMemoryError. The threshold at which
the JVM fully "gives up" and throws an OOM for excessive GC is
configured with -Xgc:excessiveGCratio which defaults to a
very conservative value and that's what can cause a GC thrashing zombie
JVM situation. In that case, the JVM is nearly OOM and spending most of
its time GCing, and if the rate of additional garbage creation happens
to approximately match the rate of GCing (or if there is a leak or
excessive memory usage that can't be cleaned up but there's just enough
space for some temporary objects to come in and be cleaned up making the
JVM think it's still accomplishing enough), then a JVM can stay in this
state for hours or even longer. The general recommendation is to monitor
whether or not there is GC thrashing, and if there is, then it may not
go OOM for a long time or never and it's just there being a black hole
for incoming work, so then one should manually take an OS core dump
(using a mechanism that uses request=exclusive+prepwalk),
and then forcefully restart the JVM (and potentially tune
-Xgc:excessiveGCratio for each environment's needs).
Unfortunately, there is no easy statistic to check for GC thrashing.
Basically what you're looking for is the proportion of time in GC over
some time period (roughly, this is what
-Xgc:excessiveGCratio is looking at using a rolling
average). This can be checked using JVM statistics on GC, or parsing
verbosegc and calculating it. A common general recommendation for most
environments is that if the proportion of time in GC is greater than 25%
over the last 5 minute period, then this is likely GC thrashing (25%
might be too aggressive for some applications). Another clever technique
on OSes like Linux is to look at the CPU usage by thread for the process
and on Linux it's easy to get thread names (e.g. top -H) and see whether
there are GC threads that are consistently pegged doing GC (e.g. for 5
minutes).