WAS Performance Monitoring
WAS provides two broad capabilities for performance monitoring: the Performance Monitoring Infrastructure (PMI), and Application Response Measurement (ARM). PMI is a statistical sampler inside WAS that periodically gathers averaged or instantaneous data on various components such as HTTP response times, thread pools, database connection pools, messaging, etc. Application Response Measurement, also called Request Metrics, traces and times individual requests as they execute through various components. This difference in approaches was covered previously in the Java Profilers chapter. To recap, statistical samplers (e.g. PMI) are very lightweight and help resolve the majority of issues; however, they will not capture data on particular requests. Whereas, tracing profilers (e.g. ARM) are much heavier weight and more complex to analyze. PMI exposes its data through JMX and ARM exposes its data either through log files or a Java agent API.
Performance Monitoring Infrastructure (PMI)
What is PMI?
The Performance Monitoring Infrastructure (PMI) uses a client-server architecture. The server collects performance data from various WebSphere Application Server components. A client retrieves performance data from one or more servers and processes the data. This data consists of counters such as servlet response time and database connection pool usage.
PMI supports five sets of counters: None, Basic, Extended, All, and Custom. The Basic set is enabled by default and has an overhead of approximately 2%, whether or not it is actively being logged or queried:
"Basic overhead ~= 2%
Extended overhead ~= 3%
Custom ~= 2% - 6%"
In general, it is recommended to run with PMI enabled, even in production. Running without PMI is equivalent to flying a plane without instruments. However, for the purposes of a benchmark, after you've "completed" your tuning, for the final run you may consider reducing or disabling PMI. Disabling PMI completely may cause a small throughput improvement. In one benchmark, about 2% (http://www.ibm.com/developerworks/websphere/techjournal/0909_blythe/0909_blythe.html).
Various Dimensions of Monitoring
It is useful to conceptualize different PMI statistics into groups. The first dimension is the "end user view" or a black box view of your application. This gives you a view as to how the application is performing and what are the response times taken to serve the requests. For example, for HTTP requests, the PMI counters are Web Applications/ServiceTime.
The second dimension is the "resources utilization view" of the system involved in the user activity. This will tell you the basic health of your system, including CPU, memory consumption, JVM health, as well as the health of various resources available such as HTTP sessions, connection pools, thread pools, etc. This dimension corresponds to the "what resource is constrained" portion of the problem diagnosis. For example, for HTTP requests, the PMI counters are Thread Pools/ActiveCount and JDBC Connection Pools/FreePoolSize, as well as JVM Runtime/ProcessCPUUsage and JVM Runtime/UsedMemory.
The third dimension is the "application view." Application code typically runs as a servlet or entreprise java bean to access various back-ends such as databases, web services, etc. For example, for HTTP requests, the PMI counters are Enterprise Beans/MethodResponseTime.
The data points are then retrieved using a web client, Java client or JMX client. WebSphere Application Server provides the built-in Tivoli Performance Viewer (TPV), which is embedded into WAS admin console.
Tivoli Performance Viewer (TPV)
The Tivoli Performance Viewer (TPV) retrieves performance data by periodically polling the PMI service of the application server that is being monitored. TPV is not part of any external Tivoli tool. TPV is part of the WebSphere Application Server administrative console.
To minimize the performance impact, Tivoli Performance Viewer polls the server with the PMI data at an interval set by the user. All data manipulations are done in the Tivoli Performance Viewer. The Tivoli Performance Viewer’s GUI provides controls that enable you to choose the particular resources and counters to include in the view and whether to visualize in chart or table form.
In a Network Deployment environment, the node agent maintains each monitored server's per-user buffer. When the TPV monitor is enabled in the administrative console, the deployment manager polls the node agents for data to display. Therefore, it's important to monitor the performance of the deployment manager and node agents themselves when using PMI and/or TPV, particularly verbose garbage collection. There will be some additional overhead when enabling TPV, but mostly in the node agents and particularly in the deployment manager.
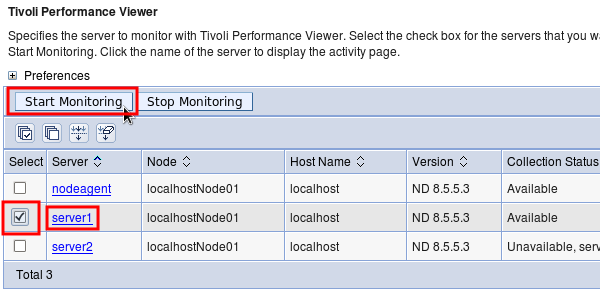
In the administrative console, select Monitoring and Tuning > Performance Viewer > Current activity, the check the box next to “server1” and click "Start Monitoring." After that operation comples, click the link on an application server:
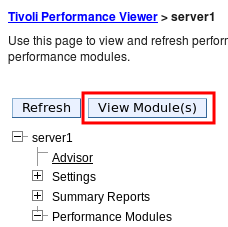
Expand "Performance Modules" and, for example, check "JDBC Connection Pools," "Servlet Session Manager," and “Web Applications," expand "Thread Pools," and check "WebContainer," and click "View Modules."

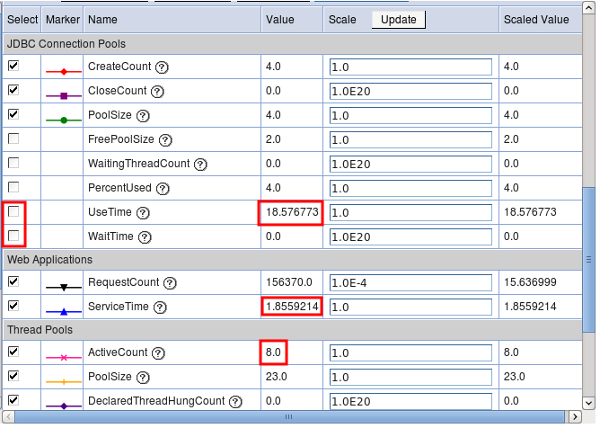
In the table under the graph, check the boxes next to the line plots that should be drawn in the graph. For example, you may want to check the JDBC "UseTime" and "WaitTime" to review database response times and times to acquire a database conection, respectively. By default, the graph updates every 30 seconds.The "Value" and "Scale Value" columns display the last value of the counter (the Scale Value is used for the graph). In the following example, the average JDBC use time of a connection is 18.5 milliseconds, the average reseponse time of all servlets is 1.85 milliseconds, and the average concurrently active threads in all WAS thread pool is 8.
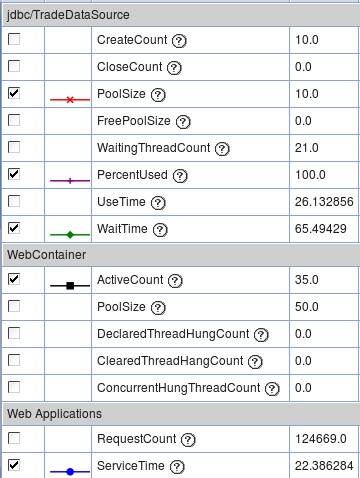
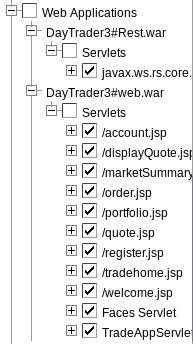
The modules may be further broken down in detail. For example, you may check each servlet under Web Applications, click View Modules, and review the average response time per servlet:
For more details, please visit the following URLs.
- https://www.ibm.com/support/knowledgecenter/SSAW57_8.5.5/com.ibm.websphere.nd.doc/ae/tprf_tpvmonitor.html
- https://www.ibm.com/support/knowledgecenter/SSAW57_8.5.5/com.ibm.websphere.nd.doc/ae/tprf_tpvcurrentactivity.html
What metrics should you gather?
Summary of all metrics: https://www.ibm.com/support/knowledgecenter/SSAW57_9.0.5/com.ibm.websphere.nd.multiplatform.doc/ae/rprf_dataorg.html
PMI Basic includes the following counters. The most commonly useful are highlighted in bold:
- Enterprise Beans.CreateCount
- Enterprise Beans.RemoveCount
- Enterprise Beans.ReadyCount
- Enterprise Beans.MethodCallCount: The number of calls to the business methods of the bean.
- Enterprise Beans.MethodResponseTime: The average response time in milliseconds on the business methods of the bean.
- Enterprise Beans.PooledCount
- Enterprise Beans.MessageCount: MDB: The number of messages delivered to the onMessage method of the bean.
- Enterprise Beans.PassiveCount
- Enterprise Beans.MethodReadyCount
- Enterprise Beans.ReadLockTime
- Enterprise Beans.WriteLockTime
- Enterprise Beans.LockCancelCount
- Enterprise Beans.AsyncWaitTime
- Enterprise Beans.AsyncQSize
- Enterprise Beans.AsyncCancelCount
- Enterprise Beans.AsyncFNFFailCount
- Enterprise Beans.AsyncFutureObjectCount
- Enterprise Beans.Discards
- JDBC Connection Pools.CreateCount
- JDBC Connection Pools.CloseCount
- JDBC Connection Pools.PoolSize
- JDBC Connection Pools.FreePoolSize: The number of free connections in the pool.
- JDBC Connection Pools.WaitingThreadCount
- JDBC Connection Pools.PercentUsed
- JDBC Connection Pools.UseTime: The average time a connection is used... Difference between the time at which the connection is allocated and returned. This value includes the JDBC operation time.
- JDBC Connection Pools.WaitTime: The average waiting time in milliseconds until a connection is granted.
- JVM Runtime.HeapSize
- JVM Runtime.UsedMemory: The used memory in the JVM run time.
- JVM Runtime.UpTime
- JVM Runtime.ProcessCpuUsage: The CPU Usage (in percent) of the Java virtual machine.
- JCA Connection Pools.CreateCount
- JCA Connection Pools.CloseCount
- JCA Connection Pools.PoolSize
- JCA Connection Pools.FreePoolSize: The number of free connections in the pool.
- JCA Connection Pools.WaitingThreadCount
- JCA Connection Pools.UseTime: Average time in milliseconds that connections are in use.
- JCA Connection Pools.WaitTime: The average waiting time in milliseconds until a connection is granted.
- Servlet Session Manager.LiveCount: The number of local sessions that are currently cached in memory from the time at which this metric is enabled.
- System Data.CPUUsageSinceLastMeasurement: The average system CPU utilization taken over the time interval since the last reading... On SMP machines, the value returned is the utilization averaged over all CPUs.
- Thread Pools.ActiveCount: The number of concurrently active threads. Note: The ActiveCount value can include a count for a long-running thread that is used for asynchronous I/O. Under these circumstances, it is possible that even when there is no apparent activity on the thread pool, the ActiveCount value will never reach zero.
- Thread Pools.PoolSize
- Transaction Manager.ActiveCount
- Transaction Manager.CommittedCount
- Transaction Manager.RolledbackCount: The total number of global transactions rolled back.
- Web Applications.RequestCount: The total number of requests that a servlet processed.
- Web Applications.ServiceTime: The response time, in milliseconds, of a servlet request.
Warning: If you are using a generational garbage collection policy such as the IBM gencon or balanced policies (gencon is the new default starting in WAS version 8), or most of the Oracle policies, then be aware that the JVM Runtime.UsedMemory statistic may be deceiving because it is sampling based on time rather than global collections, so samples may report high memory utilization that may consist of a lot of trash that will be cleaned up at the next global collection. Use verbose garbage collection instead.
We do not cover the PMI Extended set because we recommend that if you do plan on doing complex PMI analysis, that you should use the Custom set instead.
In general, we recommend the PMI Custom set with all of the applicable highlighted counters above as well as the following counters (where applicable):
- Dynamic Caching.HitsInMemoryCount: The number of requests for cacheable objects that are served from memory. For servlet instance, locate it under template group. For object instance, locate it under object group.
- Dynamic Caching.MissCount: The number of requests for cacheable objects that were not found in the cache. For servlet instance, locate it under template group. For object instance, locate it under object group.
- JDBC Connection Pools.JDBCTime: The amount of time in milliseconds spent running in the JDBC driver which includes time spent in the JDBC driver, network, and database
- JDBC Connection Pools.PrepStmtCacheDiscardCount: The total number of statements discarded by the least recently used (LRU) algorithm of the statement cache
- Mediation.MediatedMessageCount: The number of messages that have been mediated at a mediated destination.
- Mediation.MediationTime: The amount of time in milliseconds taken to mediate a message at a mediated destination.
- MEStats.BufferedReadBytes: Number of bytes of data that have been received from the network and are held pending further processing. Large values might indicate that the application server is unable to process data fast enough to keep up with the other application server processes hosting messaging engines.
- MEStats.BufferedWriteBytes: Number of bytes of data being held pending transmission. Large values might indicate network congestion or application server processes hosting messaging engines that are unable to process data fast enough to keep up with the application server.
- QueueStats.AvailableMessageCount: The number of messages available for a queue for consumption. If this number is close to the destination high messages value then review the high messages value.
- QueueStats.LocalMessageWaitTime: The time spent by messages on this queue at consumption. If this time is not what was expected then view the message in the administrative console to decide what action needs to be taken.
- Servlet Session Manager.ExternalReadTime: The time (milliseconds) taken in reading the session data from the persistent store. For multirow sessions, the metrics are for the attribute; for single row sessions, the metrics are for the entire session. Applicable only for persistent sessions. When using a JMS persistent store, you can choose to serialize the replicated data. If you choose not to serialize the data, the counter is not available.
- Servlet Session Manager.ExternalWriteTime: The time (milliseconds) taken to write the session data from the persistent store. Applicable only for (serialized) persistent sessions. Similar to external Read Time.
- Servlet Session Manager.LifeTime: The average session life time in milliseconds (time invalidated - time created)
- Servlet Session Manager.NoRoomForNewSessionCount: Applies only to sessions in memory with AllowOverflow=false. The number of times that a request for a new session cannot be handled because it exceeds the maximum session count.
- Servlet Session Manager.SessionObjectSize: High impact - debugging only: The size in bytes of (the serializable attributes of ) in-memory sessions. Only session objects that contain at least one serializable attribute object is counted. A session can contain some attributes that are serializable and some that are not. The size in bytes is at a session level.
- Servlet Session Manager.TimeoutInvalidationCount: The number of sessions that are invalidated by timeout.
- Thread Pools.ConcurrentHungThreadCount: The number of concurrently hung threads
- Web Applications.AsyncContext Response Time: The response time (in milliseconds) for an AsyncContext associated with a servlet to complete.
- Web Applications.ErrorCount: Total number of errors in a servlet or JavaServer Page (JSP).
- Web services.ProcessedRequestCount: The number of requests the service successfully processed.
- Web services.ResponseTime: The average response time (in milliseconds) for a successful request
Configuring Custom PMI
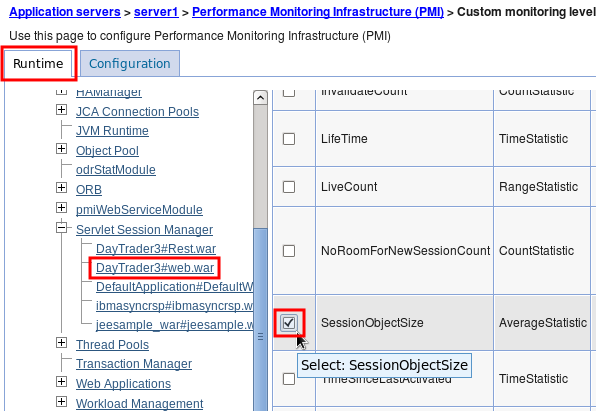
In the WAS administrative console, navigate to Servers > Server Types > WebSphere Application Server > server1 > Performance Monitoring Infrastructure and click on "Custom." Click on the "Runtime" tab, and for example, expand "Servlet Session Manager," click on "DayTrader3#web.war," check "SessionObjectSize" and click "Enable."
Logging TPV Data
TPV is a live view but for most system monitoring, problem analysis, or performance tuning, you will want to look at the data after the fact. TPV supports sending the data to log files and loading those files into any administrative console for playback. TPV logging is a bit cumbersome because the log must be restarted after every application server restart; however, this can be automated with wsadmin scripts.
Logging TPV data in a production environment may have a significant overhead. Consider using a monitoring product such as ITCAM before trying to use TPV logging in production.
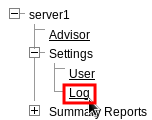
Select Monitoring and Tuning > Performance Viewer > Current activity, click the link on "server1," and click the "Log" link under settings in TPV:
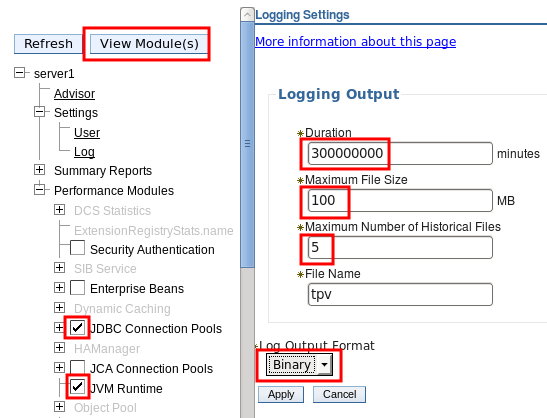
Set "Duration" to 300000000, "Maximum File Size" to 100, "Maximum Number of Historical Files" to 5, "Log Output Format" to "Binary," click "Apply," and then click "View Modules."
Click the "Start Logging" button:

Files will be writen to /opt/IBM/WebSphere/AppServer/profiles/AppSrv01/logs/tpv/, for example.
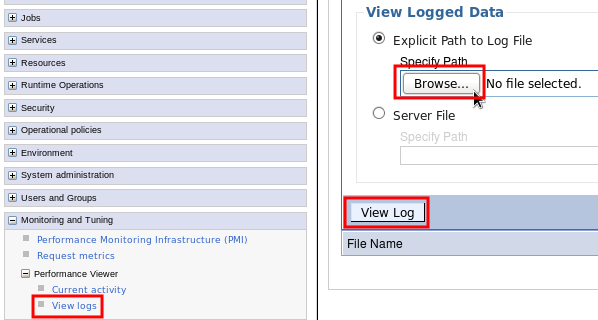
Later, when you want to view the logs, in the administrative console, select Monitoring and Tuning > Performance Viewer > View Logs, click "Browse," select /opt/IBM/WebSphere/AppServer/profiles/AppSrv01/logs/tpv/*.tpv, and click "View Log."
Check the performance modules as before, click View Modules, and use the backwards, stop, play, and forward buttons to review the collected data. By default, the log will be played back automatically.

Note: If there is a very short duration of data, you may not see all of the buttons above as all of the data can be displayed in one view.
Analyzing TPV XML Data on the Command Line
Example which finds all TPV XML files, extracts out the node and JVM name, and extracts the timestamp and WMQJCAResourceAdapter thread pool ActiveCount value:
find . -name "tpv*xml" | while read tpvfile; do grep -A 5 -e "<Snapshot" -e "<Stats.*WMQJCAResourceAdapter\"" ${tpvfile} | sed 's/.*time="\(..........\)\(...\)".*/\1/g' | grep -e "^[0-9]" -e "BRS id=\"3\"" | while read timestamp; do read threadpool; printf "$(TZ=CAT-2 date -d @${timestamp} +"%Y-%m-%d %H:%M:%S"),$(echo "${tpvfile}" | sed 's/.*\(node.\).*tpv_\(AppServer[^_]\+\)_.*/\1-\2/g'),$(echo "${threadpool}" | sed 's/.*cur="\([^"]\+\)".*/\1/g')\n"; done; done | sort | uniqThe "id" value to search for may be found here: https://www.ibm.com/support/knowledgecenter/en/SSAW57_9.0.5/com.ibm.websphere.javadoc.doc/web/apidocs/constant-values.html
For example, the above was found by searching for com.ibm.websphere.pmi.stat.WSThreadPoolStats and then noting that ActiveCount has the value 3.
PMI Details
In general, use ThreadPool.ActiveCount over ThreadPool.PoolSize, as the former is the average concurrently active threads in a thread pool, whereas the latter is simply the size of the thread pool. ActiveCount is an instantaneous measurement.
Runtime Performance Advisors (RPA)
Runtime Performance Advisors (RPAs) are pieces of code built into WAS that may be enabled to watch for certain performance issues and periodically report tuning recommendations. They are disabled by default:
Tuning WebSphere Application Server involves analyzing performance data and determining the optimal server configuration. This determination requires considerable knowledge about the various components in the application server and their performance characteristics. The performance advisors encapsulate this knowledge, analyze the performance data, and provide configuration recommendations to improve the application server performance. Therefore, the performance advisors provide a starting point to the application server tuning process and help you without requiring that you become an expert. (https://www.ibm.com/support/knowledgecenter/SSAW57_8.5.5/com.ibm.websphere.nd.doc/ae/tprf_tuningentrypoint.html)
Note: The PMI service must be enabled for RPAs. If an RPA is enabled and the needed PMI counters are not already enabled, then the configuration will be updated to enable those counters.
An RPA runs in one of two places (https://www.ibm.com/support/knowledgecenter/SSAW57_8.5.5/com.ibm.websphere.nd.doc/ae/cprf_choosingperfadvisor.html):
- In each application server JVM and provides warning level advice in SystemOut/Runtime Messages/JMX (Performance and Diagnostic Advisor). Advice provided on: WebContainer and ORB thread pools, connection pool size, persisted session sizes and times, prepared statement cache size, session cache size, and memory leak detection.
- In the node agent and provides advice in the administrative console Tivoli Performance Viewer (Tivoli Performance Viewer advisor). Advice provided on: WebContainer and ORB thread pools, connection pool size, persisted session sizes and times, prepared statement cache size, session cache size, dynamic cache size, and JVM heap size.
In general, JVM advisors are used to review advice after the fact, whereas TPV advisors are used when actively monitoring TPV data.
Warning: If you are using a generational garbage collection policy such as the IBM gencon or balanced policies (gencon is the new default starting in WAS version 8), or most of the Oracle policies, then be aware that the memory leak detection advice may report false positives. This is due to the fact that the advisor samples heap usage to minimize performance impact; however, the design of generational policies means that heap usage will show a leaking profile in between full garbage collections as the tenured regions fill up with garbage. Starting in WAS 8.5, instead of using the memory leak detection advice, you should use the excessive memory usage and excessive garbage collection health policies with usexdHeapModule=true. This has been resolved in APAR PI28801: http://www-01.ibm.com/support/docview.wss?uid=swg1PI28801
Application Response Measurement (ARM) / Request Metrics
Request metrics is a tool that enables you to track individual transactions, recording the processing time in each of the major WebSphere® Application Server components... As a transaction flows through the system, request metrics includes additional information so that the log records from each component can be correlated, building up a complete picture of that transaction.
Because request metrics tracks individual transactions, using it imposes some performance implications on the system. However, this function can be mitigated by the use of the request filtering capabilities.
For example, tools can inject synthetic transactions. Request metrics can then track the response time within the WebSphere Application Server environment for those transactions. A synthetic transaction is one that is injected into the system by administrators to take a proactive approach to testing the performance of the system.
"Performance Monitoring Infrastructure (PMI) provides information about average system resource usage statistics, with no correlation between the data across different WebSphere® Application Server components. For example, PMI provides information about average thread pool usage. Request metrics provides data about each individual transaction, correlating this information across the various WebSphere Application Server components to provide an end-to-end picture of the transaction" (https://www.ibm.com/support/knowledgecenter/SSAW57_8.5.5/com.ibm.websphere.nd.doc/ae/cprf_positioningrm.html).
Enabling Request Metrics: https://www.ibm.com/support/knowledgecenter/SSAW57_8.5.5/com.ibm.websphere.nd.doc/ae/tprf_rqenable.html and https://www.ibm.com/support/knowledgecenter/SSAW57_8.5.5/com.ibm.websphere.nd.doc/ae/uprf_rrequestmetrics.html and https://www.ibm.com/support/knowledgecenter/SSAW57_8.5.5/com.ibm.websphere.nd.doc/ae/uprf_settrace.html
Description of ARM data in SystemOut.log: https://www.ibm.com/support/knowledgecenter/SSAW57_8.5.5/com.ibm.websphere.nd.doc/ae/rprf_tracerecord.html
After ARM is enabled, to get data in the web server plugin, you must regenerate the configuration file: https://www.ibm.com/support/knowledgecenter/SSAW57_8.5.5/com.ibm.websphere.nd.doc/ae/tprf_webserver.html
Enabling Request Metrics
The overhead of "Standard Logs" may be in the tens of percent or more, mostly due to the additional volume of logging. Consider using HPEL if available to reduce this.
- WebSphere Administrative Console > Monitoring and Tuning > Request Metrics
- Ensure "Prepare Servers for Request metrics collection" is checked (by default, it is).
- Under "Components to be instrumented," either select "All" or select "Custom," and multi-select the components; for example, "Servlet," "Servlet Filter", and "WebServices"
- Under "Trace level," select "Performance_Debug," unless you also need to see Servlet Filters, in which case select "Debug"
- Under "Request Metrics Destination," check "Standard Logs"
- Click "OK," save and synchronize. If "Prepare Servers for Request metrics collection" was already checked (the default), then the application server(s) do not need to be restarted.
- The output will go to SystemOut.log and it may be significant. Ensure that enough SystemOut historical files and sizes are configured: http://www-01.ibm.com/support/knowledgecenter/SSAW57_8.5.5/com.ibm.websphere.nd.multiplatform.doc/ae/utrb_jvmlogs.html?cp=SSAW57_8.5.5%2F3-18-6-479&lang=en
- For example this will write up to 1GB:
File Size > Maximum Size = 250MB
Maximum Number of Historical Log Files = 4
- For example this will write up to 1GB:
Here is example output (the elapsed portion is in milliseconds):
[11/7/13 15:11:45:178 PST] 0000008a PmiRmArmWrapp I
PMRM0003I:  parent:ver=1,ip=127.0.0.1,time=1383865303230,pid=3807,reqid=6,event=1 -
current:ver=1,ip=127.0.0.1,time=1383865303230,pid=3807,reqid=7,event=1
type=URI detail=/AppWithFilter/TestServlet elapsed=5001

[11/7/13 15:11:45:180 PST] 0000008a PmiRmArmWrapp I
PMRM0003I:  parent:ver=1,ip=127.0.0.1,time=1383865303230,pid=3807,reqid=6,event=1 -
current:ver=1,ip=127.0.0.1,time=1383865303230,pid=3807,reqid=6,event=1
type=Servlet Filter detail=TestFilter elapsed=15003
Note that request metrics is enabled at a cell level. Therefore, once the setting changes are saved and synchronized, all servers will immediately start logging request and this can impact performance on all of them. You can disable this on some servers by appending the diagnostic string com.ibm.ws.pmi.*=none before applying the setting changes.
Request Metrics Analyzer Next
The following GUI tool is a very nice way to explore request metrics logs: https://github.com/skliche/request-metrics-analyzer-next
Request Metrics Filters
Request Metrics has a dramatic performance overhead when tracking every request, but it has various filters that only print data for requests that match the filters. One technique to use this in production is to add a filter for a particular IP address. When a problem occurs, use this client computer to make requests and that way you will see how the various components are responding for just those requests.
- Click on "Filters"
- Click on "SOURCE_IP"
- Check "Enable"
- Click OK
- Click on "Filter Values"
- Click "New"
- Value=$IP_ADDRESS
- Check "Enable filter"
- Click OK
- Click "New"
- Click on "SOURCE_IP"
If you are not seeing something, first confirm all the above are checked (sometimes settings are lost because of not clicking OK on the proper screens). Next, confirm you're using the right IP address. You can turn on NCSA access logging in WAS to see what the IP address is of the incoming user (see below).
Sampling Profiler
Consider enabling a sampling profiler, even in production. This does have a cost but provides very rich troubleshooting data on what Java code used most of the CPU, what monitors were contended, and periodic thread information. Benchmarks for Health Center showed an overhead of <2%. Gauge the overhead in a performance test environment.
- IBM Java:
- Add the following to generic JVM arguments and restart:
-Xhealthcenter:level=headless - After each time the JVM gracefully stops, a
healthcenter*.hcdfile is produced in the current working directory (e.g.$WEBSPHERE/profiles/$PROFILE/).
- Add the following to generic JVM arguments and restart:
Previous Section (Scaling and Large Topologies) | Next Section (Logging and Tracing) | Back to Table of Contents