Eclipse Memory Analyzer Tool
Overview
The Eclipse Memory Analyzer Tool (MAT) is a free and open source Java heapdump analysis tool for issues such as OutOfMemoryErrors and heap sizing. Also review the MAT documentation.
Standalone Installation
If you are reading dumps produced by a HotSpot JVM, then you can simply use the download from eclipse.org.
If you are reading dumps produced by IBM Java or IBM Semeru Runtimes, then you must have the free IBM DTFJ Eclipse Plugin installed. IBM provides a build of MAT with the plugin pre-installed (as well as the additional IBM Extensions for Memory Analyzer):

Usage
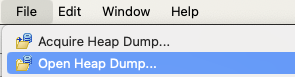
- Click
File}Open Heap Dump...and select the dump. By default, only files with known dump file extensions are shown. - Note that the parser type is determined by the file extension, so it
is important to have the right extension: PHD Heapdump
(
.phd), Operating system core dump (.dmp), or HPROF heapdump (.hprof).
First Dialog
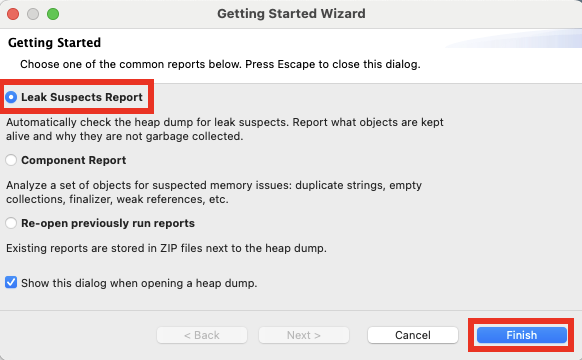
After a dump is loaded, a dialog will appear suggesting to run
various reports such as the leak suspects report. In general, the
Leak Suspects report is recommended:
Leak Suspects Report
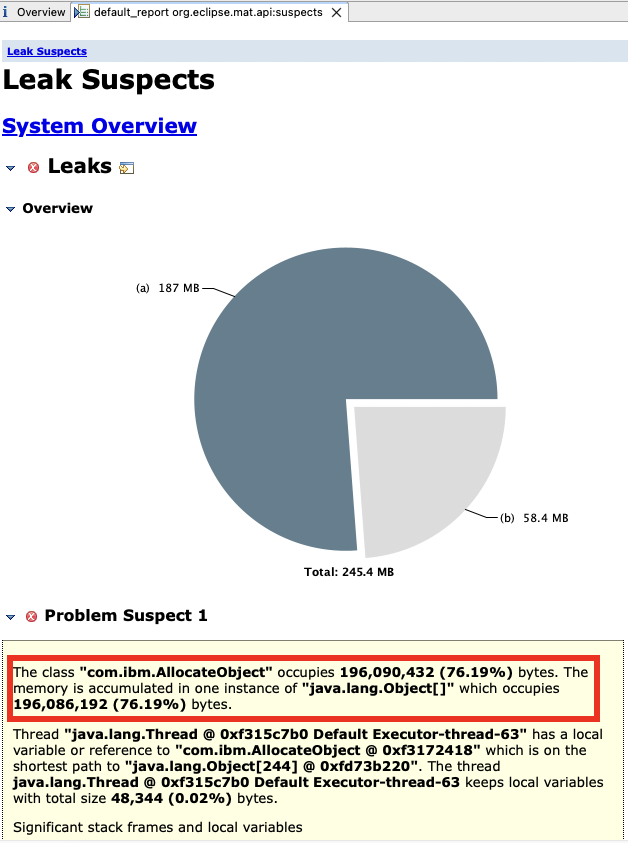
The leak suspects report runs various heuristics and reports suspected objects retaining a large portion of the Java heap. The first paragraph of each suspect summarizes the suspicion and any subsequent paragraphs and links provide details. Review all of the suspects retaining a large proportion of the Java heap.
Common Tasks
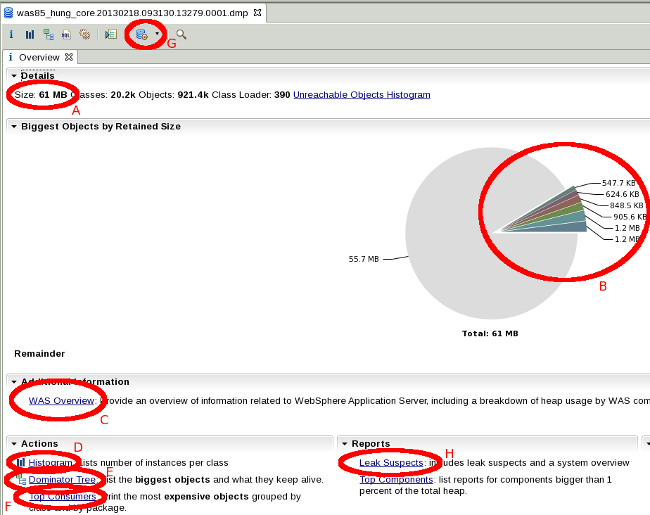
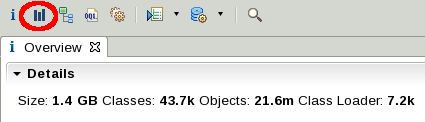
The Overview tab shows:
A) How much heap is used at the time of the dump (MAT performs a full garbage collection when loading the dump, so this does not include any garbage)
B) The largest dominator objects
C) If the IBM Extensions for Memory Analyzer are installed, a link to the WAS Overview report that will provide a WAS-centric view of the dump
D) A histogram shows the heap usage by class
E) The dominator tree shows the heap usage by dominator objects in an expandable tree view
F) Top consumers shows heap usage by package.
G) Open Query Browser provides many advanced ways to look at the data, and also most of the IBM Extensions for Memory Analyzer plugins
H) The leak suspects report will search for likely causes of a leak in the dump.
Heapdump Theory
Retained Heap: It is guaranteed that all objects below an entry are retained or kept alive by the parent. If you assume that object is removed, then the rest have been GCed.
The retained set includes the objects referenced by the fields on the given objects and all objects which are lifetime-dependent on them, i.e. which would be garbage collected if the references at the given fields at the given objects would be nulled.
The dominator tree is a transformation of the graph which creates a spanning tree (all objects in the graph are also in the dominator tree), removes cycles, and models the keep-alive dependencies. Object domination is equivalent to object retention, i.e. the set of objects dominated by some object are the same as the retained set of that object.
A garbage collection root is an object which has a reference to it from outside the heap (for example, stacks and registers of the JVM threads, JNI, and other internal data structures).
Retained Sets
The retained set of an object is the set of objects that are lifetime-dependent on it:
Retained set of X is the set of objects which would be removed by GC when X is garbage collected.
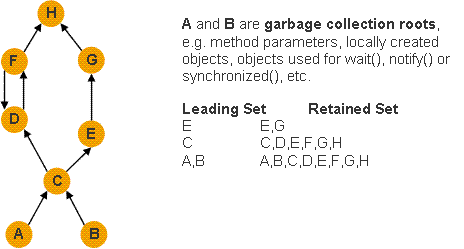
When most people talk about the "size" of a set of objects X, they are really talking about the retained set of the set of objects X, i.e. if nothing referenced X, then those objects could be garbage collected and the number of bytes representing the retained set of X would be freed.
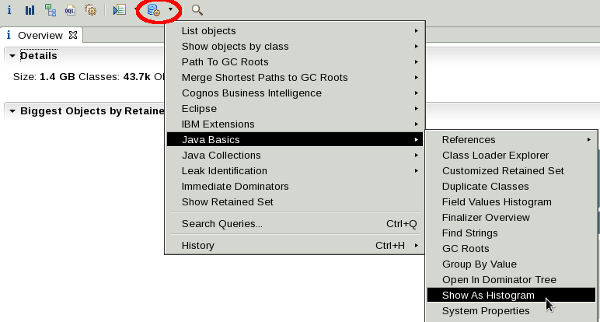
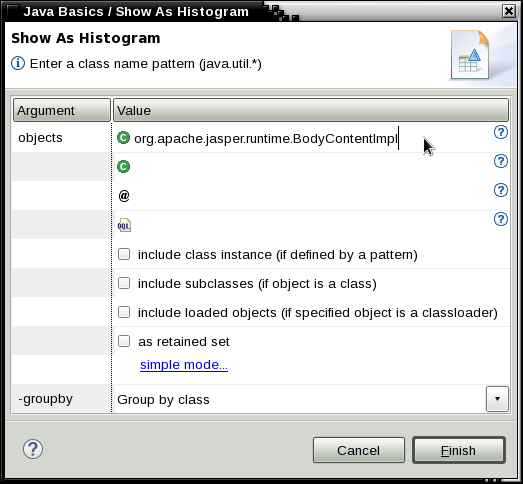
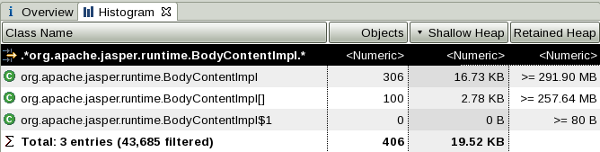
Therefore, if you want to know how much memory a set of objects retain, click Open Query Browser } Java Basics } Show as Histogram, specify the objects, and then click "Calculate retained size" and select either of the two options. For example, one common cause of excessive heap usage is by org.apache.jasper.runtime.BodyContentImpl objects due to the default behavior of com.ibm.ws.jsp.limitBuffer=false. If we want to see how much these buffers are retaining, we can show a histogram for BodyContentImpl and calculate a precise retained size, in this example 291MB:
Class Name | Objects | Shallow Heap | Retained Heap
----------------------------------------------------------------------------------
org.apache.jasper.runtime.BodyContentImpl| 306 | 16.73 KB | 291.90 MB
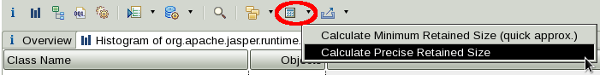
----------------------------------------------------------------------------------Another way to do this is to simply open the class Histogram and then filter in the Class Name column and calculate the retained size:
One useful technique when first analyzing a heapdump is to open the
class histogram, calculate minimum retained sizes (you probably don't
want to do precise as there may be many classes), and then sort by the
"Retained Heap" column. It's important to note that each retained heap
value is exclusive of the other values, so don't add this column up. For
example, we may see that char[] retain hundreds of MB and
BodyContentImpl objects retain hundreds of MB, but in this example, the
BodyContentImpl objects retain the char[] objects.
It's nice to know how "big" a set of objects is but it's even better
to get a class histogram of what is in that retained set. To do that,
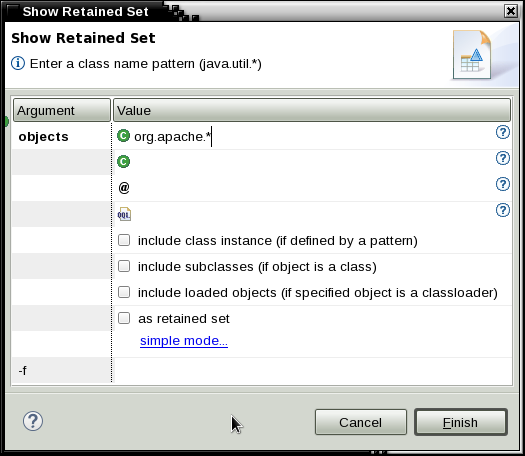
either right click on a set of objects and select "Show Retained Set,"
or use Open Query Browser } Show Retained Set and specify the objects.
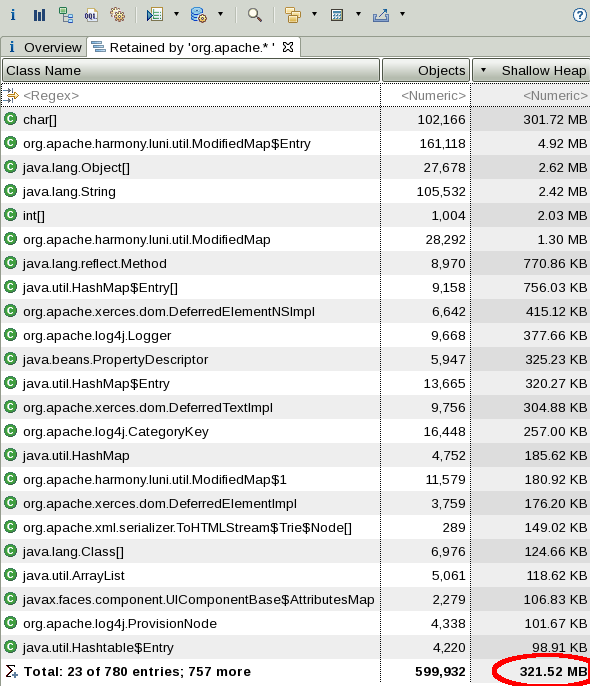
One tip is that you can use wildcards, so if you want to know how much
memory is retained by some set of classes (e.g. everything made by one
vendor), simply do com.example.* and review the sum of
shallow heaps (in this example, we can say org.apache classes retain
321MB).
It's important to understand the limitations of retained sets. Complex object graphs often complicate retained sets. For example, WAS classes such as com.ibm.ws.webcontainer.httpsession.MemorySessionContext hold all HTTP sessions, so you may think that you can get the size of all HTTP sessions by simply looking at the retained set of this class. However, let's say WebContainer threads are currently working on some set of HTTP sessions at the time of the heapdump. In that case, those sessions are not part of the retained set of MemorySessionContext because there are references to those objects from outside MemorySessionContext. For specific situations, MAT has a Customized Retained Set query where you can explicitly say which objects to exclude from the set of incoming references (in this example, you would specify MemorySessionContext and specify the set of application objects that reference these sessions as the exclude list). An alternative way to answer the question of how big all the session are is to calculate the retained set of all of the actual session objects instead of the map that contains them.
Class Histogram
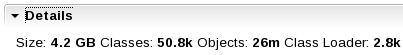
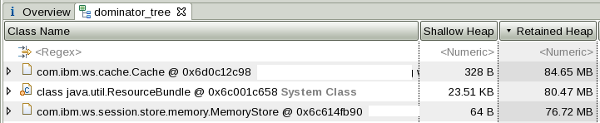
Sometimes you'll see a dump where there are no obvious causes of high memory usage in the dominator tree nor the top consumers report. For example, here is a dump retaining 4.2GB of Java heap without any large dominators:
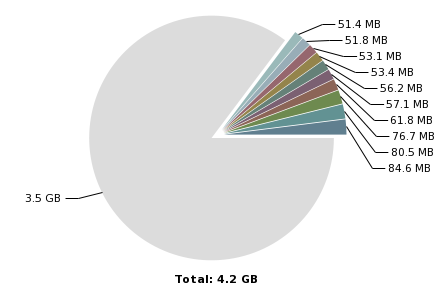
The top consumers report is equally uninteresting:
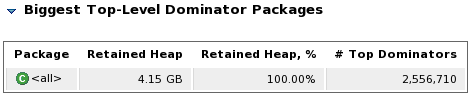
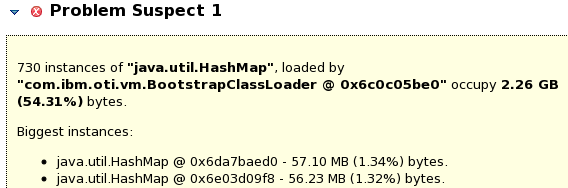
The leak suspects report is slightly more interesting. The suspect is a set of 730 instances of HashMap retaining 2.26GB; however, each individual HashMap is no more than 57MB:
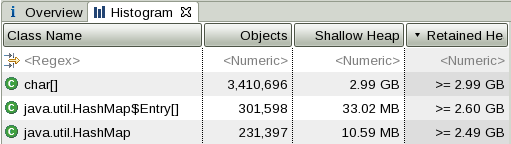
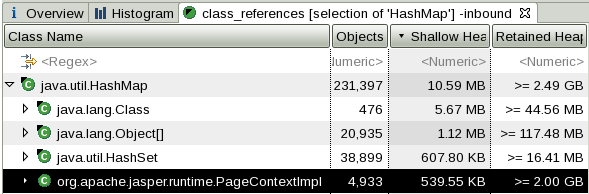
Where do we go from here? We know it's something in HashMaps but there isn't a particular HashMap to look at. Let's go to the class histogram which shows heap usage grouped by class:
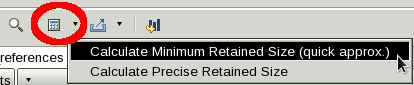
Click the little calculator and select "Calculate Minimum Retained Size (quick approx)" to see approximately how much each class and its instances retain.
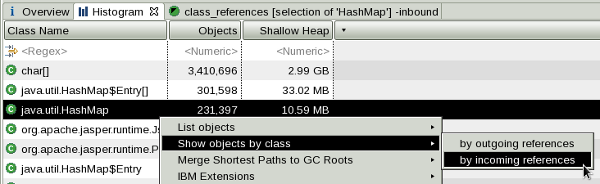
Next, right click on HashMap and select "Show Objects by class } incoming references." This will show all of the objects that have references to these HashMaps and group the objects by class:
As we expand the top level element, again we'll want to calculate minimum retained size and look for the class and its instances that retains the most. In this case, it is a set of 4,933 instances of PageContextImpl retaining about 2GB of heap.
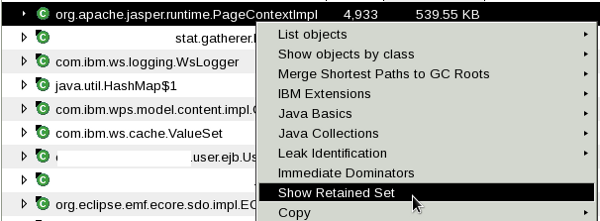
This is far enough, but just one last step will be interesting which is to right click on PageContextImpl and choose Show Retained Set:
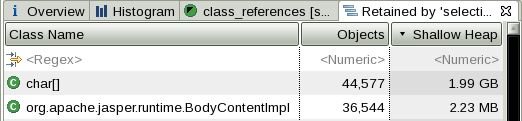
This shows a histogram by class of the set of objects retained by the selection. We can see that most of the memory held by the PageContextImpl and HashMap objects is character arrays. This lines up with the histogram we saw for the whole heap above, and we could have just as quickly gotten to the root cause by simply starting at the histogram and showing incoming references by class on the top element.
Objects Held by Thread Stack Frames
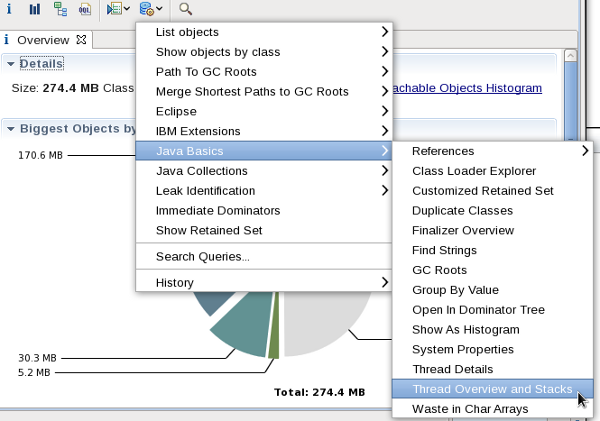
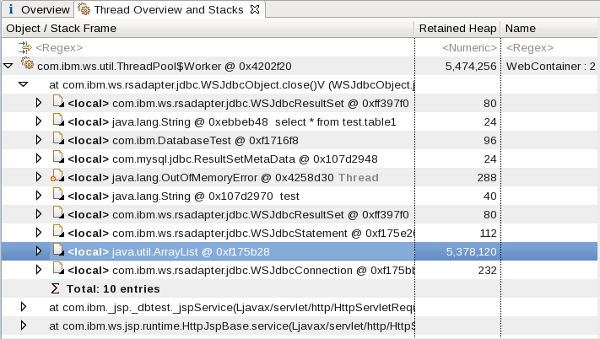
Load an J9 Java system dump or a recent Java HPROF dump and open Thread Overview and Stacks:
Expand the relevant stack frames and review the stack frame locals:
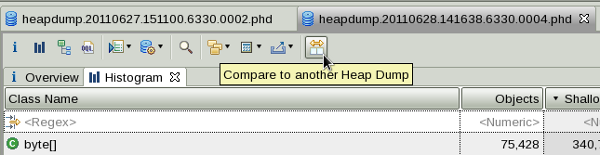
Comparing Heap Dumps
Acquire two or more heap dumps from the same run of the same JVM process, load both heap dumps in MAT, open the Histogram in the latest heap dump and then use the Compare to another Heap Dump button:
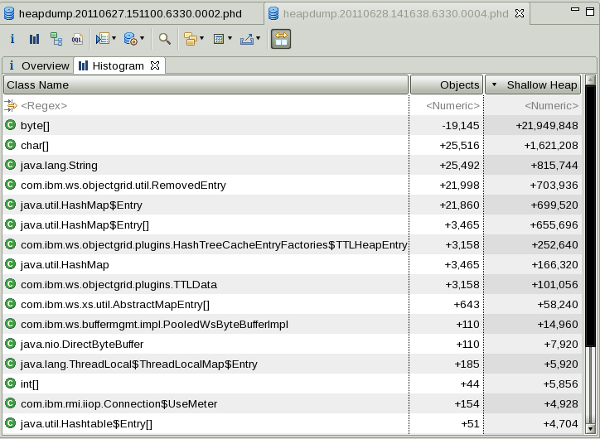
This will show a comparison of the class histograms between the two dumps, sorted by shallow size. In the example below, the latest dump has 20MB more of byte arrays, although there are 19,145 fewer of them (this means that the average size of a byte array has increased). As with class histograms in general, you often want to skip past primitives, Strings, and collections, in this case taking us to 21,998 more instances of RemovedEntry, taking up 703,995 more bytes of shallow heap. At this point, there is no science to discovering the leak (unless it's obvious), but one approach would be to see if the "uncommon" classes are holding the "common" classes; i.e. do the RemovedReaper and TTLHeapEntry objects retain HashMap entries? We can see just by the object counts that it is likely, and therefore, those uncommong objects are a leak suspect.
Note that object addresses and identifiers may change between dumps:
Object IDs which are provided in the heap dump formats supported by MAT are just the addresses at which the objects are located. As objects are often moved and reordered by the JVM during a GC these addressed change. Therefore they cannot be used to compare the objects. This basically means that if one compares two different heap dumps (although from the same process) it is not possible to point to the concrete objects different between the two heap dumps. However, one can still perform comparison on the aggregated results (e.g. the class histogram) and analyze how the amount of object and the memory they take has changed.
MAT also has extended differencing capabilities beyond the class histogram with the compare basket.
Why are some Java objects alive?
For a discussion of the Merge Shortest Paths to GC roots query, see https://www.ibm.com/support/pages/node/1074993
Object Query Language (OQL)
The Object Query Language (OQL) is similar to SQL and provides a powerful way to query the heap dump:
Select java.io.File objects that contain a string in their path:
select * from java.io.File f where toString(f.path).contains("IBM")Select all threads that contain something in their name:
SELECT OBJECTS x FROM INSTANCEOF java.lang.Thread x WHERE x.toString().contains("WebContainer")Select instances of some class which have a retained size > 24 bytes:
select * from instanceof com.ibm.MyClass s where s.@retainedHeapSize > 24Select non-viewed, non-phantomed DirectByteBuffers:
SELECT k, k.capacity FROM java.nio.DirectByteBuffer k WHERE ((viewedBuffer=null)and(inbounds(k).length>1))Select dominators of all instances of some class:
SELECT DISTINCT OBJECTS dominatorof(x) FROM java.lang.String xSelect dominator names of Strings:
SELECT classof(dominatorof(s)).@name, s FROM java.lang.String s WHERE dominatorof(s) != NULLSelect all Strings with dominators of a particular type:
SELECT * FROM java.lang.String s WHERE dominatorof(s) != NULL and classof(dominatorof(s)).@name = "com.ibm.Test"Select all class instances of a particular type:
SELECT OBJECTS c FROM INSTANCEOF java.lang.Class c WHERE c.@displayName.contains("class org.apache.commons.logging.impl.Jdk14Logger ")Select a field from static class instances:
SELECT c.controller FROM INSTANCEOF java.lang.Class c WHERE c.@displayName.contains("class com.ibm.ws.management.util.PlatformHelperImpl ")Selecting information from static class instances:
No better way to select attributes of a static class instance. Using classof() doesn't help because there could be zero instances of a class. The following example checks if the JVM is a z/OS control region. The trailing space character within the double quotes is important for accuracy.
SELECT c.controller FROM INSTANCEOF java.lang.Class c WHERE c.@displayName.contains("class com.ibm.ws.management.util.PlatformHelperImpl ")
SoftReferences
Even if you observe increasing heap utilization after global collection over time:
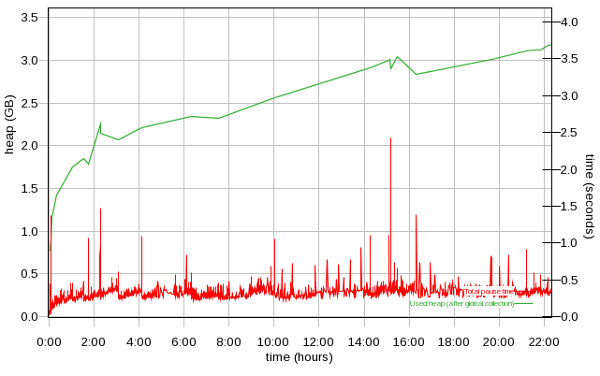
It is possible that this is caused by SoftReferences being allocated faster than they're being garbage collected. If this is the case, the JVM will clean up garbage SoftReferences if necessary:
All soft references to softly-reachable objects are guaranteed to have been cleared before the virtual machine throws an OutOfMemoryError. Otherwise no constraints are placed upon the time at which a soft reference will be cleared or the order in which a set of such references to different objects will be cleared. Virtual machine implementations are, however, encouraged to bias against clearing recently-created or recently-used soft references.
The rate at which soft references are cleared is controlled with -XsoftrefthresholdX (J9 Java) and -XX:SoftRefLRUPolicyMSPerMB=X (HotSpot Java), although this generally doesn't need to be tuned and SoftReferences can normally be cleared at the JVM's convenience.
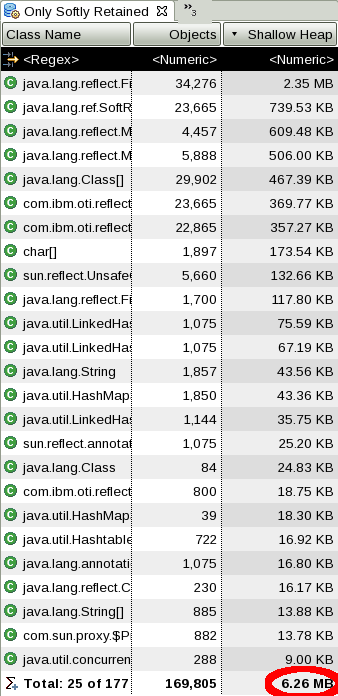
In MAT, you can see how much memory is only softly retained with Open Query Browser } Java Basics } References } Soft references statistics and review the Total line of the Shallow Heap column in the Only Softly Retained tab:
Headless Mode
- Leak suspects report:
./MemoryAnalyzer -consoleLog -nosplash -application org.eclipse.mat.api.parse $DUMP org.eclipse.mat.api:suspects -vmargs -Xmx4g --add-exports=java.base/jdk.internal.module=ALL-UNNAMED --add-modules=openj9.dtfjview --add-exports=openj9.dtfjview/com.ibm.jvm.dtfjview=ALL-UNNAMED --add-opens=openj9.dtfjview/com.ibm.jvm.dtfjview=ALL-UNNAMED --add-exports=java.base/jdk.internal.org.objectweb.asm=ALL-UNNAMED -DacceptLicense=true -Dorg.eclipse.swt.browser.DefaultType=ie - Arbitrary
query in text format:
./MemoryAnalyzer -consoleLog -nosplash -application org.eclipse.mat.api.parse $DUMP -command=histogram -format=txt -unzip org.eclipse.mat.api:query -vmargs -Xmx4g --add-exports=java.base/jdk.internal.module=ALL-UNNAMED --add-modules=openj9.dtfjview --add-exports=openj9.dtfjview/com.ibm.jvm.dtfjview=ALL-UNNAMED --add-opens=openj9.dtfjview/com.ibm.jvm.dtfjview=ALL-UNNAMED --add-exports=java.base/jdk.internal.org.objectweb.asm=ALL-UNNAMED -DacceptLicense=true -Dorg.eclipse.swt.browser.DefaultType=ie- Output:
cat (basename $DUMP .dmp)_Query/pages/Query_Command2.txt
- Output:
Index Files
Most of the index files are divided into compressed pages of bytes held by soft references, so when memory is short they can be discarded and then reloaded, so you would have to ensure the soft references weren't cleared if you skipped writing the files. The index writers create the pages and write them to disk, but then pass the pages and the file across the reader, so provided the pages are present the file might not be needed.
The parser builds some index files, then the garbage cleaner removes unreachable objects and rewrites the indexes with the new identifiers and also builds some new index files including the inbound index. The inbound index does have an intermediate stage which is written to disk - the .log files, which are not held in memory. The rewriting also writes some of the index files in a different format e.g. the outbound index is written in order so that it just extends to the start of the outbound references for the next index.
The dominator tree stage releases all the index files as it needs a lot of space (at least 7 int arrays the size of the number of objects in the dump). You would need to make sure you had enough memory to hold everything.
If MAT is unexpectedly not reading index files, check the timestamps (e.g. if transferred from another system). MAT decides to reload the dump if the last modified time of the index file ($DUMPFILE.index) is less than the last modified time of the dump file. This happened once when receiving files from England and when extracting the zip file, there was no time zone conversion, so the last modified time was hours into the "future." Every time loading the dump, the index file would still not be newer than the dump file. To get around this, manually update the last modified time to something before the last modified time of the index file:
touch -t 201201050000 core.20120106.144823.2163332.0001.dmp
Unreachable Objects
By default, MAT performs a full garbage collection when it first loads a heapdump. On the Overview tab, if there was any garbage, there will be a link to the Unreachable Objects Histogram, which will provide a histogram of the garbage collected.
When using a generational garbage collector (gencon, balanced, ParallelOld, CMS, G1GC, etc.), trash often builds up in the old generation until a full collection runs (specifically, what are essentially short-lived objects survive enough collections to be tenured). Sometimes, it's interesting to look in the trash because this gives a sense of object allocations over time. By analyzing the unreachable objects histogram, you will see the number and shallow sizes of objects in the trash by class. To do a deeper-dive into the trash:
- Load the original heapdump in the Memory Analyzer Tool (MAT)
- Copy the heapdump on your filesystem and append something to the
name (before the extension) like
_unreachable - In MAT, click Window } Preferences } Memory Analyzer } Check "Keep unreachable objects"
- Load the
_unreachableheapdump in MAT - Click the Histogram button
- Click the Compare to another heapdump button and choose the first heapdump as the baseline
This is a way to essentially trick MAT into thinking that it's comparing two different dumps, whereas it's actually comparing a dump with trash and without, giving a clean way to understand a histogram (by class) of what's in the trash. From there, you'll have to get creative to explore further. For example, take the largest class, explore incoming references by class, calculate the minimum retained set, and compare between the two dumps to find which subsets are trash.
Remember to uncheck the "keep unreachable objects" checkbox before you close MAT, because you might forget and get strange analyses the next time you load a dump (this comes from experience).
The value of this approach over simply clicking "Unreachable objects histogram" is that now you can do some cross-dump comparisons of each class (although subsetting is still conceptual/manual).
Source Code
The MAT source code is here: https://git.eclipse.org/c/mat/org.eclipse.mat.git
IBM Extensions for Memory Analyzer (IEMA)
The IBM Extensions for Memory Analyzer (IEMA) are a set of product specific extensions for MAT and are available for free as optional plugins.
Installation
The IEMA plugins may be added to an existing MAT installation:
- Click Help } Install New Software...
- Click the "Add..." button. Enter "IBM Tools IEMA" and Location: https://public.dhe.ibm.com/ibmdl/export/pub/software/websphere/runtimes/tools/iema/
- Check the additional "IBM Monitoring and Diagnostic Tools", install the plugins and restart Eclipse.
Offline installation of MAT, DTFJ, and IEMA
Download MAT from https://www.eclipse.org/mat/downloads.php
Unzip MAT
Open a terminal to the MAT directory and run the following commands (or Windows equivalents):
$ mkdir -p /home/was/Downloads/eclipseupdatesites/dtfj/
$ ./MemoryAnalyzer -application org.eclipse.equinox.p2.metadata.repository.mirrorApplication -source https://public.dhe.ibm.com/ibmdl/export/pub/software/websphere/runtimes/tools/dtfj/ -destination "file:/home/was/Downloads/eclipseupdatesites/dtfj/" -ignoreErrors
$ ./MemoryAnalyzer -application org.eclipse.equinox.p2.artifact.repository.mirrorApplication -source https://public.dhe.ibm.com/ibmdl/export/pub/software/websphere/runtimes/tools/dtfj/ -destination "file:/home/was/Downloads/eclipseupdatesites/dtfj/" -ignoreErrors
$ mkdir /home/was/Downloads/eclipseupdatesites/iema/
$ ./MemoryAnalyzer -application org.eclipse.equinox.p2.metadata.repository.mirrorApplication -source https://public.dhe.ibm.com/ibmdl/export/pub/software/websphere/runtimes/tools/iema/ -destination "file:/home/was/Downloads/eclipseupdatesites/iema/" -ignoreErrors
$ ./MemoryAnalyzer -application org.eclipse.equinox.p2.artifact.repository.mirrorApplication -source https://public.dhe.ibm.com/ibmdl/export/pub/software/websphere/runtimes/tools/iema/ -destination "file:/home/was/Downloads/eclipseupdatesites/iema/" -ignoreErrors
Package MAT and the update sites and copy to your target machine, then launch MAT and add and install each local update site to add DTFJ and IEMA separately. For details, see Eclipse Offline Update Site Installation.
Debugging MAT
Tracing MAT
See https://wiki.eclipse.org/MemoryAnalyzer/FAQ#Enable_Debug_Output
Dark Matter Warnings
In general, messages of the following form suggest core dump corruption and one should ensure that the core dump was taken with exclusive access and the file isn't truncated; however, there are cases where they may be benign:
!MESSAGE Problem getting superclass for class corruptClassName@0xffffffffffffffff at 0xffffffffffffffff
!STACK 0
com.ibm.j9ddr.view.dtfj.DTFJCorruptDataException: J9DDRCorruptData [as=minidump : 0 Message: Memory Fault reading 0x00000000 :  Address: 0x0]
    at com.ibm.j9ddr.view.dtfj.J9DDRDTFJUtils.newCorruptDataException(J9DDRDTFJUtils.java:105)
    at com.ibm.j9ddr.view.dtfj.J9DDRDTFJUtils.handleAsCorruptDataException(J9DDRDTFJUtils.java:225)
    at com.ibm.j9ddr.vm29.view.dtfj.java.DTFJJavaClass.getName(DTFJJavaClass.java:318)
    at org.eclipse.mat.dtfj.DTFJIndexBuilder.getSuperclass(DTFJIndexBuilder.java:8258)
    at org.eclipse.mat.dtfj.DTFJIndexBuilder.fill(DTFJIndexBuilder.java:1450)
    at org.eclipse.mat.parser.internal.SnapshotFactoryImpl.parse(SnapshotFactoryImpl.java:273)
    at org.eclipse.mat.parser.internal.SnapshotFactoryImpl.openSnapshot(SnapshotFactoryImpl.java:167)
    at org.eclipse.mat.snapshot.SnapshotFactory.openSnapshot(SnapshotFactory.java:147)
    at org.eclipse.mat.ui.snapshot.ParseHeapDumpJob.run(ParseHeapDumpJob.java:95)
    at org.eclipse.core.internal.jobs.Worker.run(Worker.java:63)
Caused by: com.ibm.j9ddr.NullPointerDereference: Memory Fault reading 0x00000000 :
    at com.ibm.j9ddr.vm29.pointer.AbstractPointer.getShortAtOffset(AbstractPointer.java:463)
    at com.ibm.j9ddr.vm29.pointer.generated.J9UTF8Pointer.length(J9UTF8Pointer.java:166)
    at com.ibm.j9ddr.vm29.pointer.helper.J9UTF8Helper.stringValue(J9UTF8Helper.java:32)
    at com.ibm.j9ddr.vm29.pointer.helper.J9ClassHelper.getName(J9ClassHelper.java:88)
    at com.ibm.j9ddr.vm29.view.dtfj.java.DTFJJavaClass.getName(DTFJJavaClass.java:315)
    ... 7 more

!MESSAGE Corrupt data reading declared fields at 0x0 : J9DDRCorruptData [as=minidump : 0 Message: Memory Fault reading 0x00000000 :  Address: 0x0] from class com.ibm.j9ddr.view.dtfj.DTFJCorruptDataException: J9DDRCorruptData [as=minidump : 0 Message: Memory Fault reading 0x00000000 :  Address: 0x0] at 0xffffffffffffffff
!STACK 0
com.ibm.dtfj.image.CorruptDataException: J9DDRCorruptData [as=minidump : 0 Message: Memory Fault reading 0x00000000 :  Address: 0x0]
        at org.eclipse.mat.dtfj.DTFJIndexBuilder.isCorruptData(DTFJIndexBuilder.java:4970)
        at org.eclipse.mat.dtfj.DTFJIndexBuilder.exploreObject(DTFJIndexBuilder.java:6995)
        at org.eclipse.mat.dtfj.DTFJIndexBuilder.processHeapObject(DTFJIndexBuilder.java:3666)
        at org.eclipse.mat.dtfj.DTFJIndexBuilder.fill(DTFJIndexBuilder.java:2107) [...]

!MESSAGE Invalid array element reference 0x60457f240 of type ? found at index 0 in array of type [Ljava/util/concurrent/ConcurrentHashMap$Node; length 16 at address 0x60358a448 while finding outbound references
Such cases may be when an object is "dark matter": its class has been garbage collected, but the instance still exists in an old region. This may occur because of performance optimizations when there's not enough memory pressure to fully clean everything. This most commonly occurs with generated method accessors created through reflection.
This isn't easy to diagnose because the above exception occurs as part of class and superclass processing of that object so you don't even have the object address. If you enable MAT tracing, find the exceptions above, scroll up and you may see a message such as:
found object 106930 corruptClassName@0xffffffffffffffff at 0x603953fa0 clsId 0In the above example, the object address is
0x603953fa0.
Once you do have the object address, open jdmpview with
the core, run !j9object 0x$address, take the second address
in the error message (clazz = 0x$address2), run
!j9class 0x$address2 and if you see
class J9Object* classObject = !j9object 0xFFFFFFFFFFFFFFFF<FAULT>
with the specific value 0xFFFFFFFFFFFFFFFF, then this
object's class has been garbage collected. Note that this will usually
mean that MAT will discard it as it's not strongly retained. This can be
confirmed in jdmpview with
!isobjectalive 0x$address.
References
- Eclipse MAT Documentation
- Eclipse MAT Downloads
- Lab demonstrating MAT
- Why are some Java objects alive?
- Video: Eclipse Memory Analyzer Tool
- MAT source code
Update Site
There is an update site at https://public.dhe.ibm.com/ibmdl/export/pub/software/websphere/runtimes/tools/dtfj/ for IBM Java-based dumps but it has not been updated since 2020.