OpenJ9 and IBM J9 JVMs
OpenJ9 and IBM J9 JVMs Recipe
- Review the JVM-independent recipe in the Java chapter.
- In most cases, the default
-Xgcpolicy:gencongarbage collection policy works best, with the key tuning being the maximum heap size (-Xmxor-XX:MaxRAMPercentage) and maximum nursery size (-Xmn). - Upgrade to the latest version and fixpack as there is a history of making performance improvements and fixing issues or regressions over time.
- Take a javacore and review the Java arguments (UserArgs) and Environment Variables sections and remove any unnecessary debug options.
- Take a javacore and review if the JIT code
cache is full or nearly full; if so, and there's available physical
memory, test increasing it with
-Xcodecachetotal384m -Xcodecache32m - Take a javacore and review if the shared
class cache is full or nearly full; if so, and there's available
physical memory, consider increasing
-Xscmx - If using
-Xgcpolicy:genconand you want to reduce average nursery pause times at some throughput and CPU cost, consider concurrent scavenge. - Consider setting
-XX:+CompactStringswhere available, applicable, and not already the default. - Review the performance tuning topics in the OpenJ9 or IBM Java documentation.
- When running benchmarks or comparing performance to other JVMs, consider testing various benchmark ideas.
- If using IBM Semeru Runtimes:
- If JIT CPU or memory usage are a concern, consider using the remote JITServer on available platforms.
- For AIX and Linux, ensure OpenSSL is on the system path for maximum security performance.
- On z/OS, consider enabling IBM Java Health Center
(
-Xhealthcenter:level=headless) for post-mortem CPU and lock profiling data, although this has an overhead of about 2%. - On z/OS, consider using the "pauseless" garbage collection option
-Xgc:concurrentScavengeif usinggenconand on recent software and hardware.
- If using IBM Java (does not apply to IBM Semeru Runtimes):
- Consider setting
-XX:MaxDirectMemorySizeto avoid some unnecessary full garbage collections. - Consider using the IBMJCEPlus security provider that may offer large performance improvements in encryption. This is now the default except on z/OS since 8.0.7.0.
- If the node is using a static IP address that won't be changed while
the JVM is running, use the JVM
option
-Dcom.ibm.cacheLocalHost=true. - Consider enabling IBM Java Health Center
(
-Xhealthcenter:level=headless) for post-mortem CPU and lock profiling data, although this has an overhead of about 2%.
- Consider setting
J9
J9 is an informal name for the JVM that runs both IBM Java and IBM Semeru Runtimes with some differences in J9 between the two and differences in the SDKs discussed elsewhere. J9 is developed mostly in the Eclipse OpenJ9 project.
To find the version of the J9 JVM in IBM Java, find your IBM Java service and fixpack release in the changes list and find the OpenJ9 version link. There are also nightly downloads available.
General
By default, Java will cache non-localhost lookups; however, localhost lookups are not cached in case localhost changes. In some operating systems or configurations, localhost lookups add significant overhead. If the static IP address of the node on which Java is running is unlikely to change, use -Dcom.ibm.cacheLocalHost=true to reduce localhost lookup time (https://www.ibm.com/support/knowledgecenter/SSAW57_8.5.5/com.ibm.websphere.nd.doc/ae/tprf_tunejvm_v61.html).
Garbage Collection
-Xgcpolicy:gencon is the default garbage collection policy starting in Java 6.26 (WAS 8) - it is a copy collector in the nursery area and a mark-sweep-compact collector in the tenured area. Previously, the default policy is -Xgcpolicy:optthruput.
In garbage collection, generally the term parallel means running on multiple threads, and concurrent means running at the same time as the application (i.e. not stop-the-world). Thread local heaps (TLH) are used by each thread for very small objects to reduce cross thread contention (global heap lock).
Comparing Policies
| -Xgcpolicy:gencon | -Xgcpolicy:optthruput | -Xgcpolicy:optavgpause | -Xgcpolicy:balanced | -Xgcpolicy:metronome | -Xgcpolicy:nogc | |
|---|---|---|---|---|---|---|
| Generational - most GC pauses are short (nursery/scavenge collections) | Yes | No | No | Yes | No | No |
| Compaction | Sometimes | Sometimes | Sometimes | Partial, full in overload conditions | Never | No |
| Large Heaps (>10GB) | Yes, depending on heap utilization | No | No | Yes | Yes | ? |
| Soft Real Time - all GC pauses are very short (unless cpu/heap exhaustion occurs) | No | No | No | No | Yes | No |
| Hard Real Time - requires hard real time OS, all GC pauses are very short (unless CPU/heap exhaustion occurs) | No | No | No | No | Yes | No |
| Benefits | Tries to balance application throughput with low pause times | Tries to optimize application throughput; CPU efficient | Tries to flatten out average pause times | Tries to deal with large heaps by breaking memory into many regions. May help with NUMA | Tries to have consistently low pause times | No garbage collection |
| Potential Consequences | Long global GC pauses with large heaps; Occasional long compactions; Benefits negated by frequent large object allocations if they are long-lived | Longer average pause times | Reduced throughput; Increased CPU; Poorly handles large heap usage variations | Increased CPU; Reduced throughput | Increased CPU | Increased Heap Usage |
| Recommended for | General Use (e.g. Web applications, messaging systems) | Batch applications | Consistent pause time requirement | Large heaps (>10GB) | Very low, consistent GC latency | Benchmarks |
Resources:
-Xgcpolicy:gencon
The idea [of a generational collector] is to divide the heap up into different areas, and collect these areas at different rates. New objects are allocated out of one such area, called the nursery (or newspace). Since most objects in this area will become garbage quickly, collecting it offers the best chance to recover memory. Once an object has survived for a while, it is moved into a different area, called tenure (or oldspace). These objects are less likely to become garbage, so the collector examines them much less frequently...
IBM's gencon policy (-Xgcpolicy:gencon) offers a generational GC ("gen-") on top of [-Xgcpolicy:optavgpause]. The tenure space is collected as described above, while the nursery space uses a copying collector. This algorithm works by further subdividing the nursery area into allocate and survivor spaces... New objects are placed in allocate space until its free space has been exhausted. The application is then halted, and any live objects in allocate are copied into survivor. The two spaces then swap roles; that is, survivor becomes allocate, and the application is resumed. If an object has survived for a number of these copies, it is moved into the tenure area instead.
http://www.ibm.com/developerworks/websphere/techjournal/1106_bailey/1106_bailey.html
The default maximum nursery size (-Xmn) in Java 5 is 64MB. The default in Java 6 is 25% of -Xmx. The larger the nursery, the greater the time between collects, the less objects are likely to survive; however, the longer a copy can potentially take. In general the advice is to have as large a nursery as you can afford to avoid full collects - but the full collects shouldn't be any worse than the optavgpause case. The use of concurrent collection is still in place, and the presence of the nursery should be that there's less likelihood of compacting being required in the tenured space.
For -Xgcpolicy:gencon, consider tuning the nursery size (-Xmn) to a larger proportion of -Xmx (the default is 25%)... For applications with more short-lived objects, a performance improvement can be seen by increasing the nursery size.
In an ideal world, no object is copied more than once - after the first copy it either dies or is tenured because it is long lived.
Tenure age: "Tenure age is a measure of the object age at which it should be promoted to the tenure area. This age is dynamically adjusted by the JVM and reaches a maximum value of 14. An object's age is incremented on each scavenge. A tenure age of x means that an object is promoted to the tenure area after it has survived x flips between survivor and allocate space. The threshold is adaptive and adjusts the tenure age based on the percentage of space used in the new area." (http://www.ibm.com/support/knowledgecenter/SSYKE2_8.0.0/com.ibm.java.lnx.80.doc/diag/understanding/mm_gc_generational_tenure.html)
A high tenure age means the JVM is aggressive about leaving objects in the nursery, trying to let them die there, which is generally healthy, since the JVM observes that it is able to collect most garbage in a scavenge.
As the nursery size increases, the maximum copy count and the adaptive tenure age will trend to 1. Once the application is a self optimizing tenure age of 1 at runtime, it may make sense to set tenureage=1 explicitly to make startup faster. That sets the tenure age where it will end up anyway, and ensures we don't do a lot of copying of "infrastructure" objects allocated at startup. Fix the tenure age, e.g.: -Xgc:scvNoAdaptiveTenure,scvTenureAge=1
A healthy used tenured heap (after collection) will show a sawtooth pattern where garbage collects in tenured continuously until a full collection. If the nursery size is too large (or the overall heap size is too small), then an unhealthy pattern in this plot will lack the sawtooth and you will see a low tenure age. This will caused the JVM to constantly run full collections and may increase the rate of compactions. A rough guide is that the size of the sawtooth drop should be about 25% of -Xmx. The tenured area may grow and shrink by specifying -Xmos and -Xmox.
You want the nursery to be large enough that data is at most copied once. Once that occurs the duration of a nursery collect is largely fixed at the copy time of the data, so after that increasing the nursery size increases the time between nursery collects - and therefore drops the GC overhead, and mostly likely the frequency of global collections as well.
If you've got large amounts of available RAM and process address space, the extreme tuning solution is a very large nursery with a tenure age of 1. This works on the theory that transactional data can only be copied once, and anything surviving two collects should be put into the old generation as its non-transactional (ie, at startup). You can fix the tenure age via a command line option.
There's no easy (low overhead) way of finding out what the average flip count is, but the following will give you a histogram on each scavenge collect: http://www.ibm.com/support/knowledgecenter/SSYKE2_8.0.0/com.ibm.java.lnx.80.doc/diag/tools/gcpd_tracing_scavenger.html
The maximum nursery size should be greater or equal to the maximum, concurrent transaction data for all threads. The average number of times that non-tenured objects are copied should be ~= 1
To force full GCs after each N scavenges, use -Xgc:maxScavengeBeforeGlobal=N
If you would like to tail the verbosegc log, it is generally recommended to look at free memory after global collections only because scavenges do not touch trash in the tenured region. On Linux, for example:
$ tail -f native_stderr.log | grep -A 1 "gc-end.*global" native_stderr.log
<gc-end id="1748" type="global" contextid="1741" durationms="670.959" timestamp="2014-07-02T16:28:22.476">
  <mem-info id="1749" free="156456360" total="311361536" percent="50">
Consider testing with -XX:+InterleaveMemory to take advantage of certain CPU-memory architectures.
Concurrent Scavenge
Consider using -Xgc:concurrentScavenge
(commonly called "pauseless" garbage collection) if you want to reduce
average nursery garbage collection times (though not necessarily maximum
times) at the cost of reduced throughput and increased CPU. The average
throughput drop may be up to 10-20%. The CPU increase may be about 20%
though some newer hardware such as the Z14 has hardware assist that can
bring this down to about 5-10%. The time of full GCs is generally not
impacted though they may become more frequent. It is possible that Java
heap utilization may also increase, and nursery tuning (e.g.
-Xmn) can become particularly important. If total CPU usage
is near saturation, additional performance impacts may be observed. When
testing, consider testing increased -Xmn (and potentially
also -Xmx, if possible).
Tilt Ratio
The tilt ratio is (size of new or allocate space)/(size of survivor space). The tilt ratio starts at 50% and is dynamically updated in an attempt to maximize the time between scavenges: http://www.ibm.com/support/knowledgecenter/SSYKE2_8.0.0/com.ibm.java.lnx.80.doc/diag/understanding/mm_gc_generational_tilt.html
Concurrent Marking
In general for both the gencon and optavgpause GC policies, concurrent marking can be tuned with the
-XconcurrentlevelNoption which specifies the ratio between the amounts of heap allocated and the amounts of heap marked. The default value is 8. The number of low priority mark threads can be set with the-XconcurrentbackgroundNoption. By default 1 thread is used for concurrent marking. If generational garbage collection is desired but the overhead of concurrent marking, with respect to both the overhead of the marking thread and the extra book-keeping required when allocating and manipulating objects, is not desired then concurrent marking may be disabled with the-Xconcurrentlevel0option although this may increase pause times. This option is appropriate for workloads that benefit from gencon's optimizations for object allocation and lifetimes but also require maximum throughput and minimal GC overhead while application threads are running.
Further documentation:
- https://www.ibm.com/support/knowledgecenter/SSYKE2_8.0.0/com.ibm.java.vm.80.doc/docs/mm_gc_mark_concurrent.html
-XconcurrentlevelX: https://www.ibm.com/support/knowledgecenter/SSYKE2_8.0.0/openj9/xconcurrentlevel/index.html-XconcurrentslackSIZE: https://www.ibm.com/support/knowledgecenter/SSYKE2_8.0.0/openj9/xconcurrentslack/index.html-XconcurrentbackgroundX: https://www.ibm.com/support/knowledgecenter/SSYKE2_8.0.0/openj9/xconcurrentbackground/index.html
-Xgcpolicy:balanced
The balanced GC policy (available starting with Java 7) is suitable for arbitrarily large heaps, and includes various techniques to prevent worst-case pause time from growing linearly with total heap size. Balanced is a generational policy, so as with gencon most collections will be of the nursery space, and thus will be quite brief. An incremental compaction function performs a subset of compaction work during each GC pause, to avoid the very large pause time associated with compacting the entire heap in a single operation. Tenured space collections are performed on sub-areas of the tenured heap, and objects are grouped by lifespan within the heap, to make tenured collections more efficient and brief.
The primary goal of the balanced collector is to amortize the cost of global garbage collection across many GC pauses, reducing the effect of whole heap collection times. At the same time, each pause should attempt to perform a self contained collection, returning free memory back to the application for immediate reuse.
To achieve this, the balanced collector uses a dynamic approach to select heap areas to collect in order to maximize the return-on-investment of time and effort. This is similar to the gencon policy approach, but is more flexible as it considers all parts of the heap for collection during each pause, rather than a statically defined new space.
The balanced policy can better utilize NUMA node groupings.
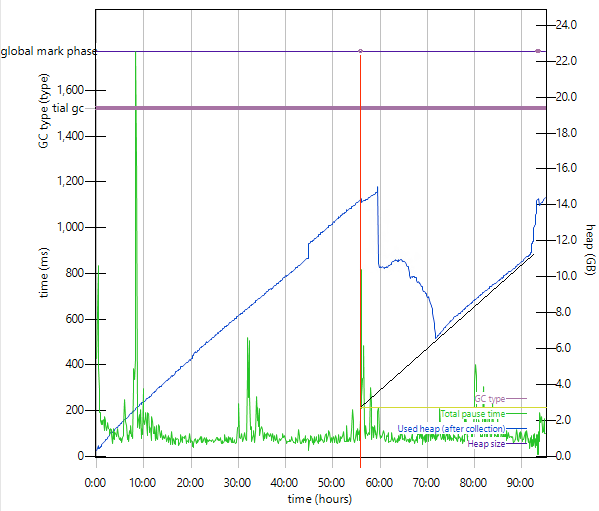
Estimating maximum heap usage with balanced
Maximum heap usage with -Xgcpolicy:balanced can be
approximated by linearly backwards extrapolating the heap usage from the
trough of a large drop in heap usage back to the time of the preceding
global mark phase (GMP); in the following example, linearly
extrapolating from ~7GB used heap (black line) to the time of the GMP
(red line) would be about 2.8GB (yellow line). This complexity is due to
available free space in partially filled regions.
-Xgcpolicy:metronome
The metronome GC policy (available in the base VM starting with Java 7) invokes the WebSphere RealTime (WRT) collector. WRT performs GC in small increments using a time-bounded algorithm to ensure that any individual GC pause is very brief. This behavior is suitable for applications needing consistent low latency response times, e.g. financial transaction systems. The trade-off for getting very low GC latency is some increase in CPU and heap consumption. Unlike gencon, optthruput, and optavgpause collectors, GC pause time with WRT does not increase linearly with heap size, so WRT is suitable for use with very large heaps.
http://www.ibm.com/developerworks/library/j-rtj4/
-Xgcpolicy:optthruput
"The simplest possible garbage collection technique is to continue allocating until free memory has been exhausted, then stop the application and process the entire heap. While this results in a very efficient garbage collector, it means that the user program must be able to tolerate the pauses introduced by the collector. Workloads that are only concerned about overall throughput might benefit from this strategy." (http://www.ibm.com/developerworks/websphere/techjournal/1106_bailey/1106_bailey.html)
-Xgcpolicy:optavgpause
"For applications that are willing to trade some overall throughput for shorter pauses... -Xgcpolicy:optavgpause attempts to do as much GC work as possible before stopping the application, leading to shorter pauses... The same mark-sweep-compact collector is used, but much of the mark and sweep phases can be done as the application runs. Based on the program's allocation rate, the system attempts to predict when the next garbage collection will be required. When this threshold approaches, a concurrent GC begins. As application threads allocate objects, they will occasionally be asked to do a small amount of GC work before their allocation is fulfilled. The more allocations a thread does, the more it will be asked to help out. Meanwhile, one or more background GC threads will use idle cycles to get additional work done. Once all the concurrent work is done, or if free memory is exhausted ahead of schedule, the application is halted and the collection is completed. This pause is generally short, unless a compaction is required. Because compaction requires moving and updating live objects, it cannot be done concurrently." (http://www.ibm.com/developerworks/websphere/techjournal/1106_bailey/1106_bailey.html)
Optimized for applications with responsiveness criteria. It reduces and makes more consistent the time spent inside the stop-the-world operations by carying out some of the stop-the-world activity while the application is running. This has an additional overhead. Optavgpause is suited for consistent allocation patterns or when very large objects adversely affect gencon.
Should you set minimum heap equal to the maximum heap?
For generational policies, the guidance is that you should fix the nursery size: -Xmns == -Xmnx, and allow the tenured heap to vary: -Xmos != -Xmox. For non generational you only have a tenured heap, so -Xms != -Xmx applies.
The reason being that the ability to expand the heap adds resilience into the system to avoid OutOfMemoryErrors. If you're then worried about the potential cost of expansion/shrinkage that this introduces by causing compactions, then that can be mitigated by adjusting -Xmaxf and -Xminf to make expand/shrink a rare event.
Long Mark Times
Long mark times can occur for the following reasons:
- Increase in the number of Objects on the Java heap
- Increase in the Java heap size
- CPU contention
- System paging
An increase in the number of objects on the Java heap or an increase in the Java heap size is typical. They are the two major factors contributing to GC duration; more Java objects take longer to mark, and more Java heap space means more time is required to traverse the larger memory space. CPU contention and system paging are caused by system resource contention, which you can determine if the paging and CPU information is available.
Long Sweep Times
Long sweep times can occur for the following reasons:
- Increase in Java heap size
- CPU contention
- System paging
An increase in Java heap size is typical because the major factor contributing to the duration of the sweep phase is the size of the Java heap that must be traversed. If sweep times increase significantly, the most likely cause is system resource contention, which you can determine if the paging and CPU information is available.
Compaction
When compactions occur, they use most of the garbage collection cycle. The Garbage Collector avoids compaction where possible. However, when compactions must occur, the raw verbose:gc output contains a message explaining why the compaction occurred.
The most common cause of avoidable long GC cycles is Java heap expansion and shrinkage. When the Java heap shrinks in size, a compaction is probably required to allow the shrinkage to occur. When the Java heap expands, a compaction might occur before the expansion, particularly when the Java heap occupancy is growing rapidly.
A correctly sized Java heap aims to keep the Java heap occupancy between 40% and 70% of the maximum heap size, which are the trigger occupancy levels for heap expansion and shrinkage. If the range of occupancy is too great to stay within the recommended range, it is more important to keep the occupancy under 70% of the maximum than it is to stay over 40%.
You can remove or reduce the need for shrinkage by increasing the -Xmaxf option from its default value of 0.6, which controls the 40% threshold for shrinkage. By increasing the -Xmaxf value, the lower threshold is reduced below the normal range of occupancy, and shrinkage can be avoided during the normal operation of the application, while still leaving the possibility of shrinkage if the Java heap occupancy drops dramatically.
The -Xmaxf parameter specifies the amount of the Java heap that must be free before shrinkage occurs, so a setting of -Xmaxf0.7 will cause shrinkage when the occupancy is below 30% (70% is free), and -Xmaxf0.9 cause shrinkage when the occupancy is below 10% (90% is free).
Explicit requests for garbage collection to run using calls to the System.gc() or Runtime.gc() methods cause a compaction to occur during the garbage collection cycle if compaction did not occur in the previous garbage collection cycle. Explicit garbage collection calls cause garbage collection to run more frequently than necessary, and are likely to cause a compaction to occur. Remove explicit garbage collection calls where possible.
To disable heap shrinkage: -Xmaxf1.0
Verbose garbage collection (-verbose:gc)
Comprehensive tests in 2022 measuring the relative difference of verbosegc in startup, footprint, first request and throughput tests on bare metal, z/OS, and containers using both spinning and NVME disks showed an overhead of verbosegc of less than 1% and mostly less than 0.5%.
By default, with just -verbose:gc, output will be sent
to stderr (in WAS traditional, native_stderr.log; in
WebSphere Liberty, console.log). Specifying -Xverbosegclog
implicitly enables -verbose:gc and allows you to write
verbosegc to named files instead, along with the option of rotating said
files after certain numbers of GC events (this works on all platforms
including z/OS). If you are concerned about performance, you can use
-Xverbosegclog to write the data to a RAMdisk. If the JVM
is unable to create the file (e.g. permissions, disk space, etc.),
verbosegc will fall back to stderr.
When using -Xverbosegclog, generally you'll want to
specify non-unique dump tokens along with a set of historical files so
that the logs roll over across process instances (in practice, this
means not using %pid or
%Y%m%d.%H%M%S). For example:
-Xverbosegclog:verbosegc.%seq.log,20,50000If you specify X,Y after the log name, output is
redirected to X number of files, each containing
Y GC cycles. You can only roll-over by the number of GC
cycles and not by raw file size; however, garbage collection events are
generally in the same magnitude in size, so you should be able to
approximate. As a rough starting point, one GC cycle outputs about 2KB.
Therefore, if let's say you wanted to rollover at 100MB, you would
do:
A= Desired size in MBB= Average GC cycle size output in bytesY = (A * 1024 * 1024) / B
So, with A=100 and B=2048, Y
would be 51200, and then you would use:
-Xverbosegclog:verbosegc.%seq.log,20,51200That would create up to 20 historical files with roughly 100MB each. If you wanted to better approximate Y, then you need to better understand B. For that, you could do a historical analysis of verbosegc and calculate the mean sizes, in bytes, of each GC event, and fiddle around with B until you get close to A per file.
Showing allocation rates:
awk -F\" '/allocated-bytes/ {nontlh+=$2;tlh+=$4;} END {printf("non-tlh: %4.0f GB, tlh: %4.0f GB \n",nontlh/1024/1024/1024,tlh/1024/1024/1024);}' verbosegc*.logverbosegc examples
The following will create up to 20 historical files of roughly 100MB each in generally recommended directories:
- WebSphere Liberty:
-Xverbosegclog:logs/verbosegc.%seq.log,20,50000 - WAS traditional (enabled by default starting in WAS 9):
-Xverbosegclog:${SERVER_LOG_ROOT}/verbosegc.%seq.log,20,50000
Stop-the-world Events
A "stop-the-world" garbage collection event is defined as the time between exclusive-start and exclusive-end verbosegc elements. This includes scavenges.
Time spent unloading classes
If you find long total GC pause times and the break down includes long times in "time spent unloading classes" in GCMV or in verbosegc:
<classunloading classloaders="325178" classes="905" timevmquiescems="0.000" timetakenms="16990.786" />Then there are a few options:
Check for APAR IV49664: SLOW CLASS UNLOADING SCAN TIME
Check for APAR IV47984: LONG GC PAUSE TIMES WHEN USING WIDE CLASS HIERARCHIES
Consider using -Xgc:classUnloadingKickoffThreshold=N
Consider using
-Xgc:maxScavengeBeforeGlobal=NInvestigate which classes and classloaders are being unloaded and review if creating these can be reduced or avoided (for example, see the discussion on reflection inflation):
-verbose:class -Xgc:verboseExtensionsIf feasible, test
-Xgcpolicy:balancedwhich performs incremental class unloading as opposed to gencon that can only unload during full GCs by which point many garbage classloaders may have accumulated.If feasible, test increasing the nursery size and/or decreasing
-Xmxto cause full GCs to run more often.If unloading times increase as the number of classloaderes increases, test with
-Xjit:disableCHOpts(combining with any other-Xjitoptions), or, more aggressively (if there are no Java agents),-Xjit:disableCHOpts,noRecompile
Exclusive Access Time
Before a garbage collection, the GC requests "exclusive access" to the JVM. Normally, this should take almost no time. This time is not included in the "Total Pause Time" statistic in GCMV (instead there is an Exclusive Access Time statistic). If this is taking a long time, then most likely some other JVM thread is holding exclusive access for that time. You can determine how long these are by looking for:
<exclusive-start id="1628" timestamp="2014-03-31T16:13:51.448" intervalms="16331.866">
  <response-info timems="1499.726" idlems="999.647" threads="2" lastid="000000000FC2C600" lastname="Thread-123" />
</exclusive-start>
The only real way to investigate these is to take a core dump by using the -Xdump slow event and setting the threshold below the average timems value; for example: -Xdump:system:events=slow,filter=1000ms,range=1..2
Load the dump into IDDE, run "!info lock" and search for this section:
id: 0x2aaab4000ed0 name: VM exclusive access
    owner thread id: 27707 name: Thread-105
    waiting thread id: 26717 name: defaultJavaTimer-thread-1
The current thread should match the owner thread, so then just run "!info thread" and you'll see the stack (top frame should be in a native method).
Excessive Garbage Collection
By default, if the JVM detects "excessive time" spent in garbage collection (default 95%), an OutOfMemoryError is thrown: https://www.ibm.com/support/knowledgecenter/SSYKE2_8.0.0/openj9/xgc/index.html#excessivegcratio
The 95% threshold can be changed with -Xgc:excessiveGCratio=90 where 90 is an example different percentage.
Explicit Garbage Collection (System.gc, Runtime.gc)
In addition to the cases covered in the general Java chapter, the IBM JVM may explicitly call System.gc in certain situations. For example, if the JVM is unable to get native memory for class(loader) metadata, it will call System.gc in case this indirectly cleans up native resources. In fact, in this case, the JVM calls an internal method so a full GC will occur even if -Xdisableexplicitgc is set. If the JVM runs out of native memory but continues to run and continues to try to allocate native class(loader) metadata, this can cause a full GC storm.
Garbage Collection Threads
The maximum number of logical CPU cores is read and fixed at JVM startup by querying the operating system. If the number of logical CPUs decreases at runtime, and -Xgcthreads is not specified, then the JVM may decide to use less CPUs during a garbage collection based on how many are available. If the number of logical CPU cores increases more than the amount at JVM startup, the JVM will not use these additional cores for garbage collection.
Garbage Collection Notes
A scavenge which is converted into a global collection collection is
called a percolate (percolate-collect). This happens when
there isn't enough space in the tenured region to accommodate objects
that need to be tenured from the nursery. If you see a lot of full GCs
due to percolate and even when there is a lot of free space in tenured,
then tenured is probably highly fragmented. Consider discovering
large object allocations and eliminating them. Increasing the
maximum heap size may help but that should be tested. The
balanced GC policy may also help but that is a more
significant change.
An "aggressive" GC is declared if a previous GC was unable to reclaim sufficient resources. It means that the GC will try as much as it can, including compaction, class unloading, softref clearing, etc. An aggressive collect may also be triggered if two explicit GCs happen back-to-back.
Just in Time (JIT) Compiler
The JIT compiler samples Java method execution at runtime and compiles the byte code of more frequently invoked methods into optimized native code. This native code is typically 10-20 times faster.
Some JIT command line options are specified with -Xjit.
Note that this option may only be specified once, so if you want to use
multiple such options, combine them with commas into one option.
JIT Interpeter Profiler
The JIT has an interpreter profiler that helps it decide what methods to JIT compiler (or re-compile). The JIT profiler has a memory limit, and if this limit is hit, parts of the profiler may be disabled. Consider testing with a larger limit; for example:
-Xjit:iprofilerMemoryConsumptionLimit=67108864JIT CPU Usage
The -XsamplingExpirationTime${SECONDS}
option allows you to disable this background process a certain number of
seconds after the JVM starts when you think that the most important
JITting has been completed. A related option helps control sampling
frequency when the JVM is idle:
-Xjit:samplingFrequencyInIdleMode=${ms}
As of this writing, in recent versions of J9 Java, the default number
of JIT compilation threads on non-Linux operating systems is the number
of CPUs minus 1 but no less than 1 and no more than 7. On Linux, 7
threads are created although only the number of CPUs minus 1 are
activated initially; if JIT compilation starvation is detected,
additional threads up to 7 may be activated. These can be quite
intensive, and if there are many Java processes on a machine, if the JIT
compilation threads happen to run at the same time, the processors may
become saturated. In the same way that -Xgcthreads must be
considered when running multiple JVMs on a machine, -XcompilationThreads
can be reduced although this should be tested.
There is an option to increase the size of the JIT profiling buffer
(default 1024): -Xjit:iprofilerBufferSize=${bytes}
The option -Xjit:noServer may be used to reduce the
level of inlining and therefore reduce JIT CPU utilization, although the
program may run more slowly. The option
-Xjit:virtualizationHighDensity may be used to be even more
aggressive in reducing JIT CPU utilization (it is a superset of
-Xjit:noServer), although the program may run even more
slowly.
Another way to reduce the CPU usage of JIT compilation is to increase
the size of the shared class cache (-Xscmx) and
consequently the likelihood that Ahead-of-time (AOT) compiled methods
can be reused. In general, AOT can be as big as disk space and physical
memory support.
By default, the JIT will compile methods after a certain number of
invocations. This can be changed with -Xjit:count
(use 0 to compile immediately, although this is generally not
recommended).
JIT Code and Data Caches
The JIT has two caches: code and data. The code cache holds the
actual compiled native code for any methods that are JITted and the data
cache is metadata for said code (which is relatively much smaller than
the code). If the application uses a lot of classes or classloaders or
runs heavy workload for a long time, the JIT code cache may fill up and
subsequent JITting is reduced or stopped. The JIT code cache is not an
LRU cache and methods may only be removed for a narrow set of reasons
(e.g. class unloading, agent retransformation, etc.). You may also make
more room in the caches by excluding some methods from being JITted with
-Xjit:exclude.
The size of the code and data caches may be reviewed in javacores in
the NATIVEMEMINFO or Total memory in use and
Total memory free statistics (not that the latter may grow
up to Allocation limit):
2MEMUSER       +--JIT: 363,553,696 bytes / 18702 allocations
2MEMUSER       |  |
3MEMUSER       |  +--JIT Code Cache: 134,217,792 bytes / 1 allocation
2MEMUSER       |  |
3MEMUSER       |  +--JIT Data Cache: 71,305,344 bytes / 34 allocations

[...]

1STSEGTYPE     JIT Code Cache
[...]
1STSEGTOTAL    Total memory:                   134217728 (0x0000000008000000)
1STSEGINUSE    Total memory in use:            121952439 (0x000000000744D8B7)
1STSEGFREE     Total memory free:               12265289 (0x0000000000BB2749)
1STSEGLIMIT    Allocation limit:               134217728 (0x0000000008000000)

[...]

1STSEGTYPE     JIT Data Cache
[...]
1STSEGTOTAL    Total memory:                    71303168 (0x0000000004400000)
1STSEGINUSE    Total memory in use:             71303168 (0x0000000004400000)
1STSEGFREE     Total memory free:                      0 (0x0000000000000000)
1STSEGLIMIT    Allocation limit:               402653184 (0x0000000018000000)
In general, the first compile occurs at the warm level
except during startup which starts at cold to compile
methods more quickly and then those are usually recompiled later. This
may be disabled with -Xjit:dontDowngradeToCold.
Tuning the JIT Code Cache
The maximum size of the code cache is controlled with -Xcodecachetotal:
Long-running, complex, server-type applications can fill the JIT code cache, which can cause performance problems because not all of the important methods can be JIT-compiled. Use the -Xcodecachetotal option to increase or decrease the maximum code cache size to a setting that suits your application.
In recent versions, the default maximum size of the cache is 256MB. For example, to increase to 384MB:
-Xcodecachetotal384mAlternatively, since OpenJ9 0.40.0 (e.g. IBM Java 8.0.8.10), this may be specified as a percentage of visible RAM using codecachetotalMaxRAMPercentage:
-XX:codecachetotalMaxRAMPercentage=25The maximum size may also be controlled with
-Xjit:codetotal=393216 where the value is in KB although
note that this option is not public and must be combined with other
-Xjit options.
The segment size is controlled with -Xcodecache.
A larger segment size may decrease fragmentation; however, it increases
runtime footprint because each JIT compilation thread can work on its
own segment. The maximum size is 32MB and the default is scaled based on
-Xcodecachetotal. For example:
-Xcodecache32mAn excessive code cache size may have negative consequences. The longer the JVM runs, the more likely the JIT is to generate code at higher optimization levels if there's space in the cache. The higher optimization compilations produce much bigger compiled method bodies (typically because of additional inlining). This can impact the instruction cache which may reduce performance. So, ideally, you want the JIT to compile just the “right” set of methods at “appropriate” optimization levels and then stop. There isn’t any way of knowing when that has happened, so if the code cache is set very big it will likely just keep going into negative territory. In addition, it takes a long time to compile at the higher optimization levels, and that time spent on the compiling can be a negative itself.
In other words, it is common for the JIT code cache to fill up in large production workloads, and this may be optimal. There are cases when a larger code cache size is better but ensure you monitor tests of such larger values over a long period of time (e.g. until the larger code cache fills up).
Tuning the JIT Data Cache
The JIT data cache maximum size is tuned with
-Xjit:dataTotal=XKB.
JIT Verbose Logging
Restart with the option:
-Xjit:verbose={compileStart|compileEnd|compilePerformance},vlog=jitlogThis will produce a file named
jitlog.$YYYYMMDD.$HHMMSS.$PID in the current working
directory of the JVM (e.g. $WAS/profiles/$PROFILE/). As
with verbose garbage collection logging, the word "verbose" is a
misnomer as this logging is very lightweight and it has a very low
overhead which means JIT verbose logging is suitable for production. For
every compilation event, which occurs relatively rarely, there will be a
few lines printed. There are no command line options to control maximum
vlog file size or rotation but the file should be relatively small. For
example, this was run in production on a very large customer on each of
their JVMs with little overhead and it produced about 50MB for an entire
day of running (per JVM).
There is no option to roll the verbose JIT log file. One will be produced and continuously written to per process ID until the JVM is stopped.
Example output:
+ (AOT load) sun/io/ByteToCharUTF8.reset()V @ 00002AAAB4D9B5A8-00002AAAB4D9B6C4 compThread 0
#CR  000000000050C100   Compile request rqk=8 j9method=000000000053BF38 java/util/Hashtable.rehash()V
#CR  000000000050C100   Compile request rqk=8 j9method=0000000000520268 java/lang/String.hashCode()I
(warm) Compiling java/util/Hashtable.rehash()V  t=10 rqk=8
Shared Classes (-Xshareclasses)
Class data sharing is a mechanism to reduce start-up and restart time of a JVM, and to reduce memory footprint if multiple JVMs on the same node are running concurrently which use some classes that are the same. In addition to class metadata, the shared class cache may also include Ahead-Of-Time (AOT) compilations of native class code.
By default in IBM Java, class data sharing is disabled. By default in Semeru Java, class data sharing is enabled only for bootstrap classes. However, by default, class data sharing is fully enabled in WebSphere Application Server traditional, Liberty, and Liberty in containers.
Class data sharing is enabled with the -Xshareclasses
option, most commonly including a logical name for the shared class
cache (although this usually doesn't need to be specified for the above
products that enable it by default, unless you want to change the name
or specify other tuning options):
-Xshareclasses:name=myappConsider creating a unique shared class cache for every category of JVMs on a node; for example, application servers, node agents, deployment manager, etc.
A common issue is that the shared class cache fills up. This may be
checked by requesting a thread dump and reviewing the SHARED CLASSES
section. Check the percent full line:
2SCLTEXTCPF Cache is 100% fullIf the cache is full and there is available physical memory, the
maximum size of the shared class cache may be specified with -Xscmx;
for example:
-Xscmx400MHowever, note that all JVMs must be first stopped, the previous
shared class cache must be destroyed by running Java with the
destroy option:
java -Xshareclasses:name=myapp,destroyAnd then a JVM must be started with the new -Xscmx
size.
All shared class caches may be listed with:
java -Xshareclasses:listAllCachesA common tuning that may be tested is:
-Xscmx400M -Xjit:dontDowngradeToCold,useHigherMethodCounts,forceAOT -Xaot:dontDowngradeToCold,useHigherMethodCounts,forceAOTIf -Xshareclasses:verbose is specified during a test,
when the JVM stops gracefully, it will print how much AOT or JIT data
was unable to use the shared class cache to stderr; for
example:
Unstored AOT bytes due to the setting of -Xscmaxaot is 184230.
Unstored JIT bytes due to the setting of -Xscmaxjitdata is 193842.
Then consider increasing -Xscmaxaot
and -Xscminjitdata
based on the above numbers (and potentially increase
-Xscmx) and re-test.
-Xquickstart
"The IBM JIT compiler is tuned for long-running applications typically used on a server. You can use the -Xquickstart command-line option to improve the performance of short-running applications, especially for applications in which processing is not concentrated into a few methods.
-Xquickstart causes the JIT compiler to use a lower optimization level by default and to compile fewer methods. Performing fewer compilations more quickly can improve application startup time. When the AOT compiler is active (both shared classes and AOT compilation enabled), -Xquickstart causes all methods selected for compilation to be AOT compiled, which improves the startup time of subsequent runs. -Xquickstart might degrade performance if it is used with long-running applications that contain methods using a large amount of processing resource. The implementation of -Xquickstart is subject to change in future releases." (http://www.ibm.com/support/knowledgecenter/SSYKE2_8.0.0/com.ibm.java.lnx.80.doc/diag/tools/jitpd_short_run.html)
-Xquickstart is generally only interesting for
short-lived benchmarks.
Container Support
When running in containers, use -XX:+UseContainerSupport and use -XX:MaxRAMPercentage and -XX:InitialRAMPercentage instead of -Xmx and -Xms.
Reduce Memory Footprint
To reduce memory footprint when idling, use -XX:+IdleTuningGcOnIdle and -XX:+IdleTuningCompactOnIdle
-Xaggressive
Consider testing with -Xaggressive: "Enables performance optimizations and new platform exploitation that are expected to be the default in future releases." (http://www.ibm.com/support/knowledgecenter/en/SSYKE2_8.0.0/com.ibm.java.lnx.80.doc/diag/appendixes/cmdline/Xaggressive.html)
Large Object Area
-Xloaminimum may be used to increase the size of the LOA: https://www.ibm.com/support/knowledgecenter/en/SSYKE2_8.0.0/openj9/xloaminimum/index.html
-Xrs
The -Xrs flag is used to disable the default signal handler (for things such as javacores with kill -3, etc.); however, using this option may reduce performance by up to 5% due to the way the JIT works and the way Java uses signals when available for performance boosts.
IBM Semeru Runtimes
OpenSSL
On Linux and AIX, IBM Semeru Runtimes uses more performant native cryptographic libraries, if available. Ensure OpenSSL libraries are installed on the system path. On Windows and macOS, IBM Semer Runtimes bundles OpenSSL.
On Linux, check for libcrypto libraries on the system
path with ldconfig -p | grep libcrypto. Library versions
will be checked
in a certain order.
Use the -Djdk.nativeCryptoTrace trace to confirm with
tracepoints including "using Native crypto library".
JITServer
On Semeru >= 11, the JITServer on available platforms offloads JIT compilation CPU and memory usage to another process.
Benchmark Ideas
When running benchmarks or comparing performance to other JVMs,
consider testing some of the following options (in addition to the overall
tuning recipe). Note that some of these may not be generally
recommended for production use as they may reduce function or
serviceability; if you find an option to be particularly valuable, open
a support case to inquire more about it and the potential risks or costs
of using it. Effects of options may
not be mutually exclusive. -Xjit options should be
combined into a single option.
-Xtune:throughput(available since OpenJ9 0.32.0; IBM Java 7.0.7.15)- For earlier JVMs, try the JVM options
-Xjit:dontDowngradeToCold,disableSelectiveNoServer,useHigherMethodCounts -Xaot:dontDowngradeToCold,disableSelectiveNoServer,useHigherMethodCountsand the environment variableTR_DisableNoIProfilerDuringStartupPhase=1
- For earlier JVMs, try the JVM options
-Xjit:dontDowngradeToCold,useHigherMethodCounts,forceAOT -Xaot:dontDowngradeToCold,useHigherMethodCounts,forceAOT-Xaggressive-XtlhPrefetch-XcompilationThreads1-Xtrace:none-Xverify:none(note: this is only for testing; on recent versions, use-XX:+ClassRelationshipVerifierinstead)-Xshareclasses:none-Xtune:virtualized(if in a virtualized environment)-Xjit:acceptHugeMethods,scratchSpaceLimit=1048576- Environment variable
TR_OptimizeForConstantLengthArrayCopy=1 - Linux:
echo always | sudo tee /sys/kernel/mm/transparent_hugepage/enabled - Run with
-verbose:classand eliminate any recurring classloading after startup - For gencon, test with tuning or disabling concurrent marking or test with different GC policies without gencon's concurrent mark such as balanced and optthruput (although each has implications).
- Test with large pages (-Xlp). This is enabled by default in recent versions, but may require operating system configuration for full enablement.
- Stop the JVMs, restart and destroy the shared class cache
(
-Xshareclasses:destroyAll), and restart again without thedestroyAlloption -XXsetHWPrefetch:os-default- On older versions of Java but newer hardware, use
-Dcom.ibm.crypto.provider.doAESInHardware=true - On AIX and Linux on Power, and OpenJ9 >= 0.20.0
or IBM Java >= 8.0.6.20, consider
-XX:+GlobalLockReservation -Xthroptions-XX:-CompactStrings
External Delays
Performance problems can sometimes be caused by the poor responsiveness of external resources that your application is attempting to access. These external resources include database, File I/O, other applications, and legacy systems. To see if the problem is caused by external delays:
Identify that a number of threads are waiting on external resources and what those resources are, by examining the javacore.txt file that has been collected.
Profile the responsiveness of the resource to see if response times are longer than expected. You can use a method trace to profile when the call to the resource returns, or you can profile the resource being accessed.Java thread information is displayed in the "THREADS subcomponent" section of the Javadump. The stack trace is provided for each thread, which can be used to determine whether there are any threads waiting on external resources. A thread may wait on an external resource either in a wait, read, or receive method. In this example, the threads are in the Object.wait() method because of a call to AS400ThreadedServer.receive(), which is an external resource:
3XMTHREADINFO "WebContainer : 0" (TID:0x0000000001191E00, sys_thread_t:0x00000000010955C0, state:CW, native ID:0x0000000000004454) prio=5
4XESTACKTRACE at java/lang/Object.wait(Native Method)
4XESTACKTRACE at java/lang/Object.wait(Object.java:199(Compiled Code))
4XESTACKTRACE at com/ibm/as400/access/AS400ThreadedServer.receive(AS400ThreadedServer.java:281(Compiled Code))4XESTACKTRACE at com/ibm/as400/access/AS400ThreadedServer.sendAndReceive(AS400ThreadedServer.java:419(Compiled Code))
4XESTACKTRACE at com/ibm/as400/access/BaseDataQueueImplRemote.read(BaseDataQueueImplRemote.java:220(Compiled Code))
4XESTACKTRACE at com/ibm/as400/access/KeyedDataQueue.read(KeyedDataQueue.java:413(Compiled Code))
4XESTACKTRACE at com/ibm/testapp/vjops/infra/cdapj/trans/CDAPDataQRouter.readByteBuffer(Bytecode PC:36(Compiled Code))
4XESTACKTRACE at com/ibm/testapp/vjops/infra/cdapj/trans/CDAPDataQRouter.getMessage(Bytecode PC:28(Compiled Code))
4XESTACKTRACE at com/ibm/testapp/vjops/infra/cdapj/trans/DataQueueMsgTransactor.doCDAPTransaction(Bytecode PC:175(Compiled Code))
...
3XMTHREADINFO "WebContainer : 2" (TID:0x0000000001495100, sys_thread_t:0x000000000135D6B0, state:CW, native ID:0x000000000000445C) prio=5
4XESTACKTRACE at java/lang/Object.wait(Native Method)
4XESTACKTRACE at java/lang/Object.wait(Object.java:199(Compiled Code))
4XESTACKTRACE at com/ibm/as400/access/AS400ThreadedServer.receive(AS400ThreadedServer.java:281(Compiled Code))
4XESTACKTRACE at com/ibm/as400/access/AS400ThreadedServer.sendAndReceive(AS400ThreadedServer.java:419(Compiled Code))
4XESTACKTRACE at com/ibm/as400/access/BaseDataQueueImplRemote.read(BaseDataQueueImplRemote.java:220(Compiled Code))
4XESTACKTRACE at com/ibm/as400/access/KeyedDataQueue.read(KeyedDataQueue.java:413(Compiled Code))
4XESTACKTRACE at com/ibm/testapp/vjops/infra/cdapj/trans/CDAPDataQRouter.readByteBuffer(Bytecode PC:36(Compiled Code))
4XESTACKTRACE at com/ibm/testapp/vjops/infra/cdapj/trans/CDAPDataQRouter.getMessage(Bytecode PC:28(Compiled Code))
4XESTACKTRACE at com/ibm/testapp/vjops/infra/cdapj/trans/DataQueueMsgTransactor.doCDAPTransaction(Bytecode PC:175(Compiled Code))
...
3XMTHREADINFO "WebContainer : 3" (TID:0x000000000167A800, sys_thread_t:0x0000000000E57AE0, state:B, native ID:0x0000000000005072) prio=5
4XESTACKTRACE at java/lang/Object.wait(Native Method)
4XESTACKTRACE at java/lang/Object.wait(Object.java:231(Compiled Code))
4XESTACKTRACE at com/ibm/ws/util/BoundedBuffer.waitGet_(BoundedBuffer.java:188(Compiled Code))
4XESTACKTRACE at com/ibm/ws/util/BoundedBuffer.take(BoundedBuffer.java:522(Compiled Code))
4XESTACKTRACE at com/ibm/ws/util/ThreadPool.getTask(ThreadPool.java:816(Compiled Code))
4XESTACKTRACE at com/ibm/ws/util/ThreadPool$Worker.run(ThreadPool.java:1476(Compiled Code))One of the threads is in BoundedBuffer.waitGet_(), which is an internal resource [and thus not an external delay; in this case the thread is waiting for work]. If the Javadump shows threads that are suspected to be blocking on external resources, the next step is to profile the response time of those resources to see if they are taking a long time.
You can profile the amount of time taken by a method that accesses an external resource by using method trace. Method trace can capture trace data for the JVM, the Java Class Libraries (JCL), and Java application code. You do not need to modify your application to use method trace, which is useful if the source code for the methods of interest is not available. The following resources describe how to activate and control method trace:
... For example, you might profile the "AS400ThreadedServer.receive()" method, using the following command-line options:
-Xtrace:maximal=mt,output=mtrace#.out,10m,10,methods={com/ibm/as400/access/AS400ThreadedServer.receive*}
These options create up to ten files called mtrace#.out, where the # symbol is replaced with a sequence number. Each is up to 10 MB in size. When all ten possible files have been created, the trace engine begins to overwrite the first file in the sequence. You can then format the mtrace#.out files as described in the IBM Diagnostic Guide for Java. These files provide microsecond precision timing information for the entry and exit of each call to the AS400ThreadedServer.receive() method. You can use this information to calculate the average response time and determine if responsiveness is a problem.
Lock Contention
A monitor has a "thin" lock that can be tested efficiently, but which does not support blocking, and -- only when necessary -- an "inflated" lock. The inflated lock is typically implemented using OS resources that can support blocking, but also is less efficient because of the additional path length required when making the calls to the operating system. Because thin locks don't support blocking, spinning is often used such that threads will spin for a short period of time in case the lock becomes available soon after they first try to acquire it.
Analysis of typical locking patterns gives us the insight that spinning helps most cases, but for some specific cases it does not. Before running an application, it is impossible to know for which monitors spinning will not be useful. It is possible, however, to observe monitor usage and identify at run time those monitors for which you do not believe spinning will be helpful. You can then reduce or eliminate spinning for those specific monitors.
The JVM shipped with WebSphere Application Serer V8 includes spinning refinements that capture locking history and use this history to adaptively decide which monitors should use spin and which should not. This can free up additional cycles for other threads with work to do and, when CPU resources are fully utilized, improve overall application performance.
http://www.ibm.com/developerworks/websphere/techjournal/1111_dawson/1111_dawson.html
Starting in Java 6.0.1, various improvements were made that are expected to improve CPU effeciency. If CPU utilization decreases but application peformance decreases, test with -Xthr:secondarySpinForObjectMonitors. If application performance is affected after the application has run for some time or after a period of heavy load, test with -Xthr:noAdaptSpin. If heap usage is reduced but overall application performance decreases, test -Xlockword:mode=all (http://www.ibm.com/support/knowledgecenter/SSYKE2_8.0.0/com.ibm.java.lnx.80.doc/diag/problem_determination/optimizations_pd.html).
In a javacore, you may see most threads in Conditional Wait (CW) states which you would normally expect to show as Runnable instead. This is "by design" starting in IBM JVM 5. If the top of a thread stack is neither in Object.wait, nor Thread.sleep, nor Thread.join, nor a native method, then the JVM will put the thread into CW state in preparation for the javacore and will return it to Runnable after the javacore is finished. This is done by having all of the aforementioned threads wait for exclusive access to the JVM by waiting on the "Thread public flags mutex lock." This is done to get an internally consistent snapshot of Java stack and monitor states. (http://www-01.ibm.com/support/docview.wss?uid=swg21413580)
Consider upgrading to the latest version of Java because there are often performance improvements in lock contention in the JDK (for example, http://www-01.ibm.com/support/docview.wss?uid=swg1IV67003).
Lock Reservation
Synchronization and locking are an important part of any multi-threaded application. Shared resources must be adequately protected by monitors to insure correctness, even if some resources are only infrequently shared. If a resource is primarily accessed by a single thread at any given time that thread will frequently be the only thread to acquire the monitor guarding the resource. In such cases the cost of acquiring the monitor can be reduced with the -XlockReservation option. With this option it is assumed that the last thread to acquire the monitor will likely also be the next thread to acquire it. The lock is therefore said to be reserved for that thread, thereby minimizing its cost to acquire and release the monitor. This option is well-suited to workloads using many threads and many shared resources that are infrequently shared in practice.
Deadlocks
The Javadump file that should have been collected contains a 'LOCKS' subcomponent. During the generation of the javacore.txt file, a deadlock detector is run, and, if a deadlock is discovered, it is detailed in this section, showing the threads and locks involved in the deadlock:
=======================
        Deadlock detected !!!
        ---------------------

          Thread "DeadLockThread 1" (0x41DAB100)
            is waiting for:
              sys_mon_t:0x00039B98 infl_mon_t:   0x00039BD8:
              java/lang/Integer@004B2290/004B229C:
            which is owned by:
          Thread "DeadLockThread 0" (0x41DAAD00)
            which is waiting for:
              sys_mon_t:0x00039B40 infl_mon_t:   0x00039B80:
              java/lang/Integer@004B22A0/004B22AC:
            which is owned by:
          Thread "DeadLockThread 1" (0x41DAB100)
This example was taken from a deadlock test program where two threads DeadLockThread 0 and DeadLockThread 1 unsuccessfully attempted to synchronize (Java keyword) on two java/lang/Integers.
You can see in the example that DeadLockThread 1 has locked the object instance java/lang/Integer@004B2290. The monitor has been created as a result of a Java code fragment looking like synchronize(count0). This monitor has DeadLockThread 1 waiting to get a lock on the same object instance (count0 from the code fragment). Below the highlighted section is another monitor locked by DeadLockThread 0 that has DeadLockThread 1 waiting.
Large Object Allocation Stack Traces
For a 5MB threshold:
-Xdump:stack:events=allocation,filter=#5m
For a size range (5 to 6 MB): -Xdump:stack:events=allocation,filter=#5m..6m
Compressed References
64-bit processes primarily offer a much larger address space, thereby allowing for larger Java heaps, JIT code caches, and reducing the effects of memory fragmentation in the native heap. Certain platforms also offer additional benefits in 64-bit mode, such as more CPU registers. However, 64-bit processes also must deal with increased overhead. The overhead comes from the increased memory usage and decreased cache utilization. This overhead is present with every single object allocation, as each object must now be referred to with a 64-bit address rather than a 32-bit address. To alleviate this, the -Xcompressedrefs option may be used, and it is enabled by default in certain release on certain operating systems. When enabled, the JVM will use smaller references to objects instead of 64-bit references when possible. Object references are compressed and decompressed as necessary at minimal cost.
In order to determine the compression/decompression overhead for a given heap size on a particular platform, review verbosegc:
<attribute name="compressedRefsDisplacement" value="0x0" />
<attribute name="compressedRefsShift" value="0x0" />
Values of 0 essentially indicate that no work has to be done in order convert between references. Under these circumstances, 64-bit JVMs running with -Xcompressedrefs can reduce the overhead of 64-bit addressing even more and achieve better performance.
-Xcompressedrefs is enabled by default in Java 6.0.1 SR5 and Java 7 SR4 when the size of the heap allows it. -Xnocompressedrefs can be used to explicitly disable it. On z/OS, before Java 7.1, compressed references was disabled by default, but it could be enabled explicitly.
Some benchmarks show a 10-20% relative throughput decrease when disabling compressed references: "Analysis shows that a 64-bit application without CR yields only 80-85% of 32-bit throughput but with CR yields 90-95%. Depending on application requirements, CR can improve performance up to 20% over standard 64-bit." (ftp://public.dhe.ibm.com/software/webserver/appserv/was/WAS_V7_64-bit_performance.pdf). You may be able to recover some of this drop by increasing L2/L3 processor cache sizes. Disabling compressed references will also dramatically increase Java heap usage by up to 70%. Additional background: http://www-01.ibm.com/support/docview.wss?uid=swg21660890
Starting with Java 8 SR2 FP10, the maximum heap size that supports compressed references was increased from 25GB to 57GB: http://www-01.ibm.com/support/knowledgecenter/SSYKE2_8.0.0/com.ibm.java.lnx.80.doc/diag/preface/changes_80/whatsnew_sr2fp10.html
-Xgc:preferredHeapBase
With compressed references enabled, due to the design of Java, native metadata must all be allocated in the virtual memory range 0-4GB. This includes all native objects backing classes, classloaders, threads, and monitors. If there is insufficient space for additional metadata to be allocated, then a native OutOfMemoryError (NOOM) will be thrown. In general, this can happen for two reasons: 1) there is a class, classloader, thread, or monitor leak, and 2) the Java heap is sharing the 0-4GB space. The first cause can be investigated with the javacore.txt file that's produced with the NOOM by searching for large numbers of these objects.
The second cause is due to the default performance optimizations that Java makes. The location of the Java heap will affect the type of compression operations that must be performed on each Java pointer reference (http://www-01.ibm.com/support/docview.wss?uid=swg21660890). If the Java heap can fit completely underneath 4GB, then no "compression" needs to occur - the top 32 bits are simply truncated. Otherwise, for different locations of the Java heap, different arithmetic operations need to be performed. On all operating systems, there are cases where the Java heap will be preferred underneath 4GB and squeeze the metadata space, thus causing NOOMs. One option is to reduce metadata demands, and the second option is to specify where the Java heap should start. Usually, it is sufficient to start the Java heap at the 4GB mark: -Xgc:preferredHeapBase=0x100000000
-Xgc:classUnloadingKickoffThreshold
If a classloader becomes eligible for garbage collection, it may only be cleaned up during a full garbage collection, and the cleanup process is relatively long because of the complexity of unloading classloaders and classes. If there is a large volume of such classloaders and classes to clean up, full GC pause times may be very long. In addition, classloaders and classes are backed by native memory so this may drive native memory issues such as native OutOfMemoryErrors (the "iceberg" problem). This may be an issue if the frequency of full GCs is low.
The -Xgc:classUnloadingKickoffThreshold=N increases the
frequency of full GCs based on classloading behavior. It instructs the
JVM to start a concurrent global collection after N
classloaders have been created to try to get ahead of this situation and
clean up such classloaders and classes before they build up too much in
the tenured regions.
There was a period of a few years where this option stopped working and this was fixed in APAR IJ31667.
Method Tracing (-Xtrace methods)
Before IBM Java 7.1, using any method trace may have a significant performance overhead, in some cases up to 40%, and up to 70% during JVM startup. This only affects the -Xtrace "method" option (including simple triggers), not tpnid or other options. This overhead has been mostly removed in Java 7.1
Use -Xtrace triggers to gather diagnostics when specified Java methods are executed. For example, to take a javacore on the first 1500 executions:
-Xtrace:trigger=method{ilog/rules/factory/IlrReflect.*Listener,javadump,,,1500}For example, here is a trace that tracks Java socket I/O activity:
-Xtrace:none -Xtrace:maximal=tpnid{IO.0-50},output=javatrace.logExample output:
17:11:02.473807000          0x12b83f00         IO.18   Entry      >IO_Connect(descriptor=353, connect_to(AF_INET6: port=7272 flow=0 addr=...
17:11:02.473944000          0x12b83f00         IO.20   Exit       <IO_Connect - return =0
17:11:02.474078000          0x12b83f00         IO.32   Entry      >IO_Send(descriptor=353, msg=4197800128, len=20, flags=0)
17:11:02.474117000          0x12b83f00         IO.34   Exit       <IO_Send - bytes sent=20
17:11:02.474124000          0x12b83f00         IO.32   Entry      >IO_Send(descriptor=353, msg=4197800128, len=193, flags=0)
17:11:02.474145000          0x12b83f00         IO.34   Exit       <IO_Send - bytes sent=193
17:11:02.474149000          0x12b83f00         IO.32   Entry      >IO_Send(descriptor=353, msg=4197800128, len=1498, flags=0)
17:11:02.474171000          0x12b83f00         IO.34   Exit       <IO_Send - bytes sent=1498
17:12:20.422571000          0x13090c00         IO.21   Entry      >IO_Recv(descriptor=311, buffer=4195936448, len=88, flags=0)
17:12:20.422577000          0x13090c00         IO.23   Exit       <IO_Recv - bytes read=88
17:11:02.474183000          0x12b83f00         IO.43   Entry      >IO_Dup2(fd1=290, fd2=353)
17:11:02.474206000          0x12b83f00         IO.44   Exit       <IO_Dup2 - error=353
17:11:02.474209000          0x12b83f00         IO.47   Entry      >IO_Close(descriptor=353)
17:11:02.474210000          0x12b83f00         IO.49   Exit       <IO_Close - return code=0
To format an xtrace output file:
java com.ibm.jvm.format.TraceFormat xtrace.outTrace history for a specific thread can be retrieved through jdmpview or IDDE: !snapformat -t <J9VMThread address>
Xverify
-Xverify:none
disables the verifier; however, this is not supported, not recommended,
and has been deprecated in Java 13:
-Xverify:none Disables the verifier. Note: This is not a supported configuration and, as noted, was deprecated from Java 13.
-Xverify:none is sometimes used because it may provide a
performance benefit. Instead, in recent versions of J9, try -XX:+ClassRelationshipVerifier
instead.
Javacore Thread Dump
Review the native stack traces as well for hot stacks because that might point to some more fundamental issue in the operating system (e.g. malloc contention), etc.
Per-thread CPU usage in javacore (Java 7 SR6, Java 626 SR7, and Java 7.1): A new line has been added to the header section for each thread, giving CPU usage information for that thread (as available from the OS):
3XMTHREADINFO      "main" J9VMThread:0x0000000022C80100, j9thread_t:0x0000000000D4E5C0, java/lang/Thread:0x0000000022B96250, state:R, prio=5
3XMJAVALTHREAD            (java/lang/Thread getId:0x1, isDaemon:false)
3XMTHREADINFO1            (native thread ID:0xE90, native priority:0x5, native policy:UNKNOWN)
3XMCPUTIME               CPU usage total: 0.249601600 secs, user: 0.218401400 secs, system: 0.031200200 secs
3XMHEAPALLOC             Heap bytes allocated since last GC cycle=25368 (0x6318)
Starting with Java 8, CPU usage of JVM-attached threads is tracked by thread category (which can be disabled with -XX:-ReduceCPUMonitorOverhead): http://www.ibm.com/support/knowledgecenter/SSYKE2_8.0.0/com.ibm.java.lnx.80.doc/diag/preface/changes_80/whatsnew.html. New lines at the end of the THREADS section in javacore provide the accumulated CPU totals in each category, for example:
1XMTHDSUMMARY  Threads CPU Usage Summary
NULL           =========================
1XMTHDCATEGORY All JVM attached threads: 134.253955000 secs
1XMTHDCATEGORY |
2XMTHDCATEGORY +--System-JVM: 8.642450000 secs
2XMTHDCATEGORY |  |
3XMTHDCATEGORY |  +--GC: 1.216805000 secs
2XMTHDCATEGORY |  |
3XMTHDCATEGORY |  +--JIT: 6.224438000 secs
1XMTHDCATEGORY |
2XMTHDCATEGORY +--Application: 125.611505000 secs
In the header lines for each thread, an additional field at the end of the 3XMCPUTIME line indicates the current CPU usage category of that thread, for example:
3XMTHREADINFO   "JIT Compilation Thread-0 Suspended" J9VMThread:0x000000000F01EB00, j9thread_t:0x000000000296A7F8
 java/lang/Thread:0x00000000E0029718, state:R, prio=10
3XMJAVALTHREAD         (java/lang/Thread getId:0x4, isDaemon:true)
3XMTHREADINFO1         (native thread ID:0xDFC, native priority:0xB, native policy:UNKNOWN, vmstate:CW, vm thread flags:0x01000001)
3XMCPUTIME CPU usage total: 5.912437900 secs, user: 5.865637600 secs, system: 0.046800300 secs, current category="JIT"Stack Size (-Xss)
If using large stack sizes, consider setting -Xssi as well: http://www-01.ibm.com/support/docview.wss?uid=swg21659956
Large Pages (-Xlp)
Details of enabling large pages are on each operating system page. To see whether large pages are enabled on a running JVM, compare pageSize and requestedPageSize in verbosegc:
<attribute name="pageSize" value="0x1000" />
<attribute name="requestedPageSize" value="0x20000" />
Debug Options
The following debug options may have very large performance impacts. Some, such as debugger options, may have large performance impacts even if a debugger is not attached.
-agentlib:jdwp-Xrunjdwp-Xdebug-Xnoagent
OpenJ9
Performance: https://www.eclipse.org/openj9/oj9_performance.html
Environment Variables
Use IBM_JAVA_OPTIONS on IBM Java or OPENJ9_JAVA_OPTIONS for OpenJ9 to specify additional JVM arguments for programs launches in that terminal/command prompt. For example:
export IBM_JAVA_OPTIONS="-Xmx1024m"
/opt/IBM/WebSphere/AppServer/bin/collector.sh
In more recent versions of IBM Java and Semeru Java, the _JAVA_OPTIONS
envar is also available.
z/OS
zIIP/zAAP Usage
Even if application processing hands-off to non-zIIP-eligible native code (e.g. third party JNI), recent versions of z/OS (with APAR OA26713) have a lazy-switch design in which short bursts of such native code may stay on the zIIP and not switch to GCPs.
To check a snapshot of activity and see whether it's zIIP-eligible,
take a console dump, load it
in jdmpview, run info thread all and check
each thread for IFA Enabled=yes or
IFA Enabled=yes.
Known Issues and Regressions
- IJ44106: ~10%
higher CPU on versions higher than 8.0.7.11 with stacks often in
com/ibm/crypto/provider. Resolved in 8.0.7.20. - IJ35969:
Higher CPU with stacks often in
java/io/ObjectInputStreamorsun/misc/VM.latestUserDefinedLoader. Regression introduced in 8.0.6.31 through IJ32927. IJ35969 provides a workaround available in 8.0.7.5 using-Dcom.ibm.disableLUDCLRefresh=trueif user code is not invoked duringObjectInputStreamprocessing.
Building
IBM Semeru Runtimes build instructions: https://github.com/eclipse-openj9/openj9/tree/master/doc/build-instructions