Linux
Linux Recipe
- Generally, all CPU cores should not be
consistently saturated. Check CPU
100 - idle%with tools such asvmstat,top,nmon, etc. - Review snapshots of process activity using tools such as
top,nmon, etc., and for the largest users of resources, review per thread activity using tools such astop -H -p $PID. - Generally, swapping of program memory from RAM to disk should rarely
happen. Check that current swapping is 0 with
vmstatso/sicolumns and use tools such asvmstatortopand check if swap amount is greater than 0 (i.e. swapping occurred in the past). - Consider using TuneD and applying the
latency-performance,network-latency,throughput-performance, ornetwork-throughputprofile. - Unless power consumption is important, change the CPU
speed governors to
performance. - Unless power consumption is important, ensure processor boosting is enabled in the BIOS.
- Monitor TCP
retransmissions with
nstat -saz *Retrans*ornetstat -s | grep -i retrans. Ideally, for LAN traffic, they should be 0. - Monitor network interface packet drops, errors, and buffer overruns. Ideally, for LAN traffic, they should be 0.
- For systems with low expected usage of file I/O, set vm.swappiness=0 to reduce the probability of file cache driving program memory swapping.
- If there is extra network capacity and a node has extra CPU
capacity, test permanently disabling TCP delayed acknowledgments
using
quickack 1. - Review saturation, response time, and errors of input/output interfaces such as network cards and disks.
- If the operating system is running in a virtualized guest, review the configuration and whether or not resource allotments are changing dynamically. Review CPU steal time in tools such as vmstat, top, etc.
- Check if CPU is being throttled:
grep nr_throttled /sys/fs/cgroup/cpu.stat - Consider testing explicitly tuned TCP/IP network buffer sizes.
- Review CPU instructions per cycle and tune appropriately.
- For hosts with incoming LAN network traffic from clients
using persistent TCP connection pools (e.g. a reverse HTTP proxy to an
application server such as IHS/httpd to WAS), set
net.ipv4.tcp_slow_start_after_idle=0to disable reducing the TCP congestion window for idle connections. - General operating system statistics and process (and thread) statistics should be periodically monitored and saved for historical analysis.
- Review
sysctl -afor any uncommon kernel settings. - If there are firewall idle timeouts between two hosts on a LAN utilizing a connection pool (e.g. between WAS and a database), consider tuning TCP keep-alive parameters.
- Linux on IBM Power CPUs:
- Test with the IBM Java parameter -Xnodfpbd
- Test with hardware prefetching disabled
- Test with idle power saver disabled
- Test with adaptive frequency boost enabled
- Test with dynamic power saver mode enabled
- Use 64-bit DMA adapter slots for network adapters
- Linux on IBM System z CPUs:
- Use QUICKDSP for production guests
Also review the general topics in the Operating Systems chapter.
General
Query the help manual for a command:
$ man vmstat # By default, contents are sent to less
$ man -a malloc # There may be multiple manuals matching the name. Use -a to show all of them.
$ man -P cat vmstat # Use -P to send the output to something other than less. Note, if you pipe the output, it will figure that out and send things to stdout.
$ man -K vmstat # Search all manpages for a keyword
$ info libc # Some GNU programs offer more detailed documentation using the info command
Installing Programs
- Modern Fedora/RHEL/CentOS/ubi/ubi-init:
dnf install -y $PROGRAMS - Older Fedora/RHEL/CentOS:
yum install -y $PROGRAMS - Debian/Ubuntu:
apt-get update && sudo DEBIAN_FRONTEND=noninteractive TZ=${TZ:-UTC} apt-get -y install $PROGRAMS - Alpine:
apk update && apk add $PROGRAMS- Some packages are available in non-default
repositories; for example:
apk add podman --repository=https://dl-cdn.alpinelinux.org/alpine/edge/community
- Some packages are available in non-default
repositories; for example:
- SUSE:
zypper install $PROGRAMS
Kernel Log
Check the kernel log for any warnings, errors, or repeated
informational messages. The location or mechanism depends on the
distribution and software. The most common recent Linux log management
is done through journalctl. Other potentials are
/var/log/messages, /var/log/syslog,
/var/log/boot.log, and dmesg.
journalctl
- Tail the journal:
journalctl -f - Messages since last boot:
journalctl -b - List logs per boot:
journalctl --list-boots - Messages for a particular boot period:
journalctl -b -0 - Messages that are warnings and errors:
journalctl -p warning - Messages that are warnings and errors (since last boot):
journalctl -b -p warning - Messages that are warnings and errors (last 100):
journalctl -p warning -n 100 - Messages that are errors:
journalctl -p err - Only kernel messages:
journalctl -k - Messages for a particular systemd unit:
journalctl -u low-memory-monitor - Messages since yesterday:
journalctl -S yesterday - Messages in a date range:
journalctl -S "2021-01-01 10:00" -U "2021-01-01 11:00" - Messages with microsecond timestamps:
journalctl -o short-precise
Modifying Kernel Parameters
The kernel mounts a virtual filesystem in /proc/sys which exposes various kernel settings through pseudo files that can be read and (sometimes) written to get and set each value, respectively. For example, the following command gets the current value of the kernel's system wide limit of concurrently running threads/tasks:
$ sudo cat /proc/sys/kernel/threads-max
248744
Each of these pseudo files is documented in man 5 proc.
If a value can be updated, simply echo the new value into the pseudo file:
$ echo 248745 > /proc/sys/kernel/threads-max
bash: /proc/sys/kernel/threads-max: Permission denied
$ sudo echo 248744 > /proc/sys/kernel/threads-max
bash: /proc/sys/kernel/threads-max: Permission denied
Notice that the user must have sufficient permissions, and simply prepending sudo is also not enough. The reason a simple "sudo echo" doesn't work is that this runs the echo command as root, but the output redirection occurs under the user's context. Therefore, you must use something like the tee command:
$ echo 248745 | sudo tee /proc/sys/kernel/threads-max
248745
This works but the change will be reverted on reboot. To make permanent changes, edit the /etc/sysctl.conf file as root. This lists key value pairs to be set on boot, separated by an equal sign. The key is the name of the pseudo file, with /proc/sys removed, and all slashes replaced with periods. For example, the same threads-max setting above would be added to /etc/sysctl.conf as:
kernel.threads-max=248745Sysctl is also a command that can be run to print variables in a similar way to cat:
$ sudo sysctl kernel.threads-max
kernel.threads-max = 248745
Or to temporarily update variables similar to echo above and similar to the sysctl.conf line:
$ sudo sysctl -w kernel.threads-max=248746
kernel.threads-max = 248746
To list all current values from the system:
$ sudo sysctl -a | head
kernel.sched_child_runs_first = 0
kernel.sched_min_granularity_ns = 4000000
kernel.sched_latency_ns = 20000000
Finally, use the -p command to update kernel settings based on the current contents of /etc/sysctl.conf:
$ sudo sysctl -p
net.ipv4.ip_forward = 0
net.ipv4.conf.all.rp_filter = 1
The recommended way to edit kernel settings is to edit or add the
relevant line in /etc/sysctl.conf and run
sysctl -p. This will not only set the currently running
settings, but it will also ensure that the new settings are picked up on
reboot.
Modifying Kernel Command Line Options
Kernel command line options may be set depending on the type of bootloader used:
- GRUB2 using grubby:
- List kernels and options:
sudo grubby --info=ALL - Add space-separated options example:
sudo grubby --update-kernel=ALL --args="cpufreq.default_governor=performance" - Remove options example:
sudo grubby --update-kernel=ALL --remove-args=cpufreq.default_governor
- List kernels and options:
TuneD
TuneD
applies tuning configuration using tuning templates called profiles
either using a
background service (default) or an
apply-and-exit mode using daemon=0.
TuneD was originally built for Fedora, Red Hat Enterprise Linux, and
similar but it is also available on other distributions with similar
functionality. TuneD is incompatible with the cpupower and
power-profiles-daemon programs so those should be disabled
when using TuneD.
TuneD Profiles
Listing TuneD Profiles
List the currently configured profile:
$ tuned-adm active

Current active profile: throughput-performance$ tuned-adm list
Available profiles:
- accelerator-performance - Throughput performance based tuning with disabled higher latency STOP states
- balanced - General non-specialized TuneD profile
- desktop - Optimize for the desktop use-case
- latency-performance - Optimize for deterministic performance at the cost of increased power consumption
- network-latency - Optimize for deterministic performance at the cost of increased power consumption, focused on low latency network performance
- network-throughput - Optimize for streaming network throughput, generally only necessary on older CPUs or 40G+ networks
- powersave - Optimize for low power consumption
- throughput-performance - Broadly applicable tuning that provides excellent performance across a variety of common server workloads
- virtual-guest - Optimize for running inside a virtual guest
- virtual-host - Optimize for running KVM guests
Current active profile: balancedSelect a TuneD Profile
- Ensure TuneD is running
- Select the profile. Ideally, stress test different profiles. In
general, consider
latency-performance,network-latency,throughput-performance, ornetwork-throughput:sudo tuned-adm profile $PROFILE - Some settings may require a reboot of the node and may require BIOS changes.
Debug Symbols
RedHat Enterprise Linux (RHEL)
- Configure debuginfo repositories
sudo yum install -y kernel-debuginfo kernel-debuginfo-common glibc-debuginfo
Fedora/CentOS
sudo dnf install -y dnf-plugins-coresudo dnf debuginfo-install -y kernel glibc
Ubuntu
- Perform
Getting -dbgsym.ddeb packages sudo apt-get -y install linux-image-$(uname -r)-dbgsym libc6-dbg
SLES
- Enable
debuginforepositories depending on the SLES version (list repositories withzypper lr). For example:zypper mr -e SLE-Module-Basesystem15-SP2-Debuginfo-Pool zypper mr -e SLE-Module-Basesystem15-SP2-Debuginfo-Updates zypper install kernel-default-debuginfo glibc-debuginfo
Processes
Query basic process information:
$ ps -elfyww | grep java
S UID        PID  PPID  C PRI  NI    RSS      SZ WCHAN  STIME TTY       TIME   CMD
S root     11386     1 17  80   0 357204 1244770 futex_ 08:07 pts/2 00:00:30   java ... server1
Normally the process ID (PID) is the number in the fourth column, but the -y option (which adds the RSS column) changes PID to the third column. You can control which columns are printed and in which order using -o.
Note that even with the -w option or with a large
COLUMNS envar, the kernel before ~2015 limited the command
line it stored to 4096 characters; however, this has since been fixed.
cgroups
cgroups (or Control Groups) are a way to group processes in a hierarchy to monitor and/or control resource usage through controllers of, for examples, CPU and memory. There are two versions of cgroups: v1 and v2. While v2 does not implement all controllers as v2, it is possible to run a mix of v1 and v2 controllers.
Central Processing Unit (CPU)
Query CPU information using lscpu:
# lscpu
Architecture:                    x86_64
CPU op-mode(s):                  32-bit, 64-bit
Byte Order:                      Little Endian
Address sizes:                   39 bits physical, 48 bits virtual
CPU(s):                          4
On-line CPU(s) list:             0-3
Thread(s) per core:              1
Core(s) per socket:              1
Socket(s):                       4
Vendor ID:                       GenuineIntel
CPU family:                      6
Model:                           158
Model name:                      Intel(R) Core(TM) i7-7820HQ CPU @ 2.90GHz
Stepping:                        9
CPU MHz:                         2900.000
BogoMIPS:                        5808.00
L1d cache:                       128 KiB
L1i cache:                       128 KiB
L2 cache:                        1 MiB
L3 cache:                        32 MiB
Query physical processor layout:
$ cat /proc/cpuinfo
processor    : 0
model name    : Intel(R) Core(TM) i7-3720QM CPU @ 2.60GHz
cpu cores    : 4...
Query the current frequency of each CPU core (in Hz):
$ cat /sys/devices/system/cpu/cpu*/cpufreq/scaling_cur_freq
1200000
1200000
CPU Speed
The CPU scaling governor may dynamically change the CPU frequency to reduce power consumption.
The cpupower program may be installed for easier querying and configuration of CPU speed.
Display the maximum frequency of each CPU core (in Hz):
sudo cat /sys/devices/system/cpu/cpu*/cpufreq/scaling_max_freq
Display the current governors for each CPU:
sudo cpupower frequency-infosudo cat /sys/devices/system/cpu/cpu*/cpufreq/scaling_governor
Display available governors:
sudo cpupower frequency-info --governorssudo ls /lib/modules/$(uname -r)/kernel/drivers/cpufreq/
For maximum performance, set the scaling_governor
to performance:
sudo cpupower frequency-set -g performance- Teeing into the
scaling_governor:for i in /sys/devices/system/cpu/cpu*/cpufreq/scaling_governor; do echo "performance" | sudo tee $i; done
Permanently Changing CPU Scaling Governor
- Since Linux 5.9, set the kernel boot
option
cpufreq.default_governor=performance - Or, if using systemd:
- Install cpupower:
- Fedora/RHEL/CentOS:
sudo dnf install kernel-tools - Debian/Ubuntu:
sudo apt-get install -y linux-tools-$(uname -r)
- Fedora/RHEL/CentOS:
- Find
EnvironmentFilein cpupower.service:sudo grep EnvironmentFile /usr/lib/systemd/system/cpupower.service - Edit the
EnvironmentFile(e.g./etc/sysconfig/cpupower,/etc/default/cpupower, etc.) - Change the governor in
CPUPOWER_START_OPTStoperformance - Start the cpupower service:
sudo systemctl start cpupower - Check that the service started without errors:
sudo systemctl status cpupower - Enable the cpupower service on restart:
sudo systemctl enable cpupower
- Install cpupower:
- Otherwise, use a configuration in modprobe.d
CPU Boosting
Ensure processor boosting is enabled in the BIOS and kernel. Intel calls this Turbo Boost and AMD calls this Turbo Core.
Check /sys/devices/system/cpu/cpufreq/boost or
/sys/devices/system/cpu/intel_pstate/no_turbo depending on
your processor. Alternatively, check the status of turbo boost using
cpupower if available:
cpupower frequency-infoKernel Threads
Kernel
threads may be isolated to particular CPU threads with isolcpus
or tuna:
tuna --cpus=1-2 --isolateVerify:
tuna -PHyperthreading
There are cases in which hyperthreading (or Simultaneous Multithreading [SMT]) is less efficient than a single CPU thread per CPU core. Hyperthreading may be disabled in various ways:
Through BIOS
Using kernel parameter nosmt
Disable SMT control:
$ echo off > /sys/devices/system/cpu/smt/control
$ cat /sys/devices/system/cpu/smt/active
0
Disable sibling CPU threads per core (see lscpu and /proc/cpuinfo for topology); for example:
echo 0 | sudo tee /sys/devices/system/cpu/cpu1/onlineConfirm this with
lscpu --extended; for example:$ lscpu --extended [...] On-line CPU(s) list: 0 Off-line CPU(s) list: 1-3
CPU in cgroups
- cgroups v1:
cat /sys/fs/cgroup/cpu/$SLICE/$SCOPE/cpu.stat - cgroups v2:
cat /sys/fs/cgroup/$SLICE/$SCOPE/cpu.stat
CPU Pressure
Recent versions of Linux include Pressure
Stall Information (PSI) statistics to better understand CPU pressure
and constraints. For example, in /proc/pressure/cpu (or in
cpu.pressure in cgroups):
cat /proc/pressure/cpu
some avg10=0.00 avg60=2.12 avg300=5.65 total=33092333
The "some" line indicates the share of time in which at least some tasks are stalled on a given resource.
The ratios (in %) are tracked as recent trends over ten, sixty, and three hundred second windows, which gives insight into short term events as well as medium and long term trends. The total absolute stall time (in us) is tracked and exported as well, to allow detection of latency spikes which wouldn't necessarily make a dent in the time averages, or to average trends over custom time frames.
nice
Consider testing increased CPU and I/O priority of important programs to see if there is an improvement:
Examples:
$ sudo renice -n -20 -p 17 # Set the fastest scheduling priority for PID 17
17 (process ID) old priority 0, new priority -20
$ ionice -p 17 # print the I/O priority of PID 17
realtime: prio 0
$ sudo ionice -c 1 -n 0 -p 17 # Set the I/O priority of PID 17 to realtime and the highest priority (in this example it's redundant)
vmstat
vmstat is a command to query general operating system statistics. For example:
$ vmstat -tn -SM 5 2
procs -----------memory---------- ---swap-- -----io---- --system-- -----cpu------ ---timestamp---
r  b   swpd   free   buff  cache   si   so    bi    bo   in   cs us sy id wa st
0  0      0  10600    143   2271    0    0   114    24  150  623  3  1 93  3  0    2014-02-10 08:18:37 PST
0  0      0  10600    143   2271    0    0     2    24  679 1763  1  0 98  0  0    2014-02-10 08:18:42 PST
To run vmstat in the background with a 5 second interval:
sh -c "date >> nohup.out && (nohup vmstat -tn 5 > diag_vmstat_$(hostname)_$(date +%Y%m%d_%H%M%S).txt &) && sleep 1 && cat nohup.out"Some versions of Linux do not support the -t flag so the
above command will give an error. If so, change to -n and
use the date in the filename to calculate wall clock times.
To stop collection, kill the vmstat process. For example:
pkill -f vmstatvmstat notes:
- The first line is an average since reboot, so in most cases you should disregard it.
- The "r" column has had a confusing manual page in older releases. The newer description is more clear: "The "procs_running" line gives the total number of threads that are running or ready to run (i.e., the total number of runnable threads)."
- b: Average number of uninterruptible, blocked threads - usually I/O
- free, buff, cache: Equivalent to free command. "Total" free = free + buff + cache
- si/so: Swap in/out. Ideally, si
and so should be 0:
Use vmstat to monitor memory usage and watch the si (swap in) and so (swap out) fields. It is optimal that they remain zero as much as possible.
- bi/bo: Device blocks in/out
- id: Idle - Best place to look for CPU usage - substract 100 minus this column.
- Us=user CPU%, sy=system CPU%, wa=% waiting on I/O, st=% stolen by hypervisor
Ensure there are no errant processes using non-trivial amounts of CPU.
Per Processor Utilization
Query per processor utilization:
$ mpstat -A 5 2
Linux 2.6.32-358.11.1.el6.x86_64 (oc2613817758.ibm.com)     02/07/2014     _x86_64_    (8 CPU)

01:49:47 PM  CPU    %usr   %nice     %sys %iowait    %irq   %soft    %steal  %guest   %idle
01:49:47 PM  all    1.08    0.00    0.60    0.23    0.00    0.00    0.00    0.00   98.09
01:49:47 PM    0    2.43    0.00    1.83    0.00    0.00    0.00    0.00    0.00   95.74
01:49:47 PM    1    1.62    0.00    1.21    0.00    0.00    0.00    0.00    0.00   97.17...
Some processors may have higher interrupt rates due to network card bindings.
top
top provides processor usage for the overall system and individual processes. Without arguments, it will periodically update the screen with updated information:
        top - 15:46:52 up 178 days,  4:53,  2 users,  load average: 0.31, 0.08, 0.02
        Tasks:  77 total,   2 running,  74 sleeping,   1 stopped,   0 zombie
        Cpu(s): 24.6% us,  0.5% sy,  0.0% ni, 74.9% id,  0.0% wa,  0.0% hi,  0.0% si
        Mem:   5591016k total,  5416896k used,   174120k free,  1196656k buffers
        Swap:  2104472k total,    17196k used,  2087276k free,  2594884k cached
The CPU(s) row in this header section shows the CPU usage in terms of the following:
- us: Percentage of CPU time spent in user space.
- sy: Percentage of CPU time spent in kernel space.
- ni: Percentage of CPU time spent on low priority processes.
- id: Percentage of CPU time spent idle.
- wa: Percentage of CPU time spent in wait (on disk).
- hi: Percentage of CPU time spent handling hardware interrupts.
- si: Percentage of CPU time spent handling software interrupts.
          PID USER      PR  NI  VIRT  RES  SHR S %CPU %MEM    TIME+  COMMAND
         8502 user1     25   0  599m 466m 5212 R 99.9  8.5   0:23.92 java...
The table represents the Process ID (PID). CPU usage percentage (%CPU), and process name (COMMAND) of processes using the most CPU. If the available CPU is 100% utilized, the availability to the Java process is being limited. In the case above, the Java process is using all the available CPU but is not contending with any other process. Therefore, the limiting performance factor is the CPU available to the machine.
If the total CPU usage is 100% and other processes are using large amounts of CPU, CPU contention is occurring between the processes, which is limiting the performance of the Java process.
Old Java Diagnostic Guide
Use the -b flag to run top in a batch mode instead of redrawing the screen every iteration. Use -d to control the delay between iterations and -n to control the number of iterations.
The following command may be used to gather all processes sorted by CPU usage every 30 seconds:
nohup sh -c "top -b -d 30 >> diag_top_$(hostname)_$(date +%Y%m%d_%H%M%S).txt" &The following command may be used to gather the top processes by CPU usage every 30 seconds:
nohup sh -c "top -b -d 30 | grep -A 10 'top - ' >> diag_top_$(hostname)_$(date +%Y%m%d_%H%M%S).txt" &The following command may be used to gather the top processes by memory usage every 30 seconds:
nohup sh -c "top -b -d 30 -o %MEM | grep -A 10 'top - ' >> diag_top_$(hostname)_$(date +%Y%m%d_%H%M%S).txt" &Per-thread CPU Usage
The output of top -H on Linux shows the breakdown of the CPU usage on the machine by individual threads. The top output has the following sections of interest:
top - 16:15:45 up 21 days,  2:27,  3 users,  load   average: 17.94, 12.30, 5.52
      Tasks: 150 total,  26 running, 124 sleeping,   0   stopped,   0 zombie
      Cpu(s): 87.3% us,  1.2% sy,  0.0% ni, 27.6% id,  0.0%   wa,  0.0% hi,  0.0% si
      Mem:   4039848k total,  3999776k used,   40072k free,    92824k buffers
      Swap:  2097144k total,      224k used, 2096920k free,  1131652k cached

        PID USER    PR  NI  VIRT  RES  SHR S %CPU   %MEM    TIME+  COMMAND
      31253 user1   16   0 2112m 2.1g 1764 R 37.0   53.2   0:39.89 java
      31249 user1   16   0 2112m 2.1g 1764 R 15.5   53.2   0:38.29 java
      31244 user1   16   0 2112m 2.1g 1764 R 13.6   53.2   0:40.05 java...
      ..
PID: The thread ID. This can be converted into hexadecimal and used to correlate to the "native ID" in a javacore.txt file...
S: The state of the thread. This can be one of the following:
- R: Running
- S: Sleeping
- D: Uninterruptible sleep
- T: Traced
- Z: Zombie
%CPU: The percentage of a single CPU usage by the thread...
TIME+: The amount of CPU time used by the thread.
Note that the "Cpu(s)" line in the header of the output shows the percentage usage across all of the available CPUs, whereas the %CPU column represents the percentage usage of a single CPU. For example, on a four-CPU machine the Cpu(s) row will total 100% and the %CPU column will total 400%.
In the per-thread breakdown of the CPU usage shown above, the Java process is taking approximately 75% of the CPU usage. This value is found by totaling the %CPU column for all the Java threads (not all threads are shown above) and dividing by the number of CPUs. The Java process is not limited by other processes. There is still approximately 25% of the CPU idle. You can also see that the CPU usage of the Java process is spread reasonably evenly over all of the threads in the Java process. This spread implies that no one thread has a particular problem. Although the application is allowed to use most of the available CPU, the fact that 25% is idle means that some points of contention or delay in the Java process can be identified. A report indicating that active processes are using a small percentage of CPU, even though the machine appears idle, means that the performance of the application is probably limited by points of contention or process delay, preventing the application from scaling to use all of the available CPU. If a deadlock is present, the reported CPU usage for the Java process is low or zero. If threads are looping, the Java CPU usage approaches 100%, but a small number of the threads account for all of that CPU time. Where you have threads of interest, note the PID values because you can convert them to a hexadecimal value and look up the threads in the javacore.txt file to discover if the thread is part of a thread pool. In this way you gain an understanding of the kind of work that the thread does from the thread stack trace in the javacore.txt file. For example, the PID 31253 becomes 7A15 in hexadecimal. This value maps to the "native ID" value in the javacore.txt file.
Old Java Diagnostic Guide
You can convert the thread ID into hexadecimal and search for it in a matching javacore.txt file on the IBM JVM. For example, if the TID is 19511, convert 19511 to hexadecimal = 0x4C37. Search in javacore for native ID:
"WebContainer : 1" (TID:0x0933CB00, sys_thread_t:0x09EC4774, state:CW, native ID:0x00004C37) prio=5
java/text/FieldPosition$Delegate.formatted(FieldPosition.java:291(Compiled Code))
Another technique to monitor per-thread CPU usage is to monitor the accumulated CPU time per thread (TIME+) to understand which threads are using the CPUs.
The following command may be used to gather the top threads by CPU usage every 30 seconds:
nohup sh -c "top -b -d 30 -H | grep -A 50 'top - ' >> diag_top_$(hostname)_$(date +%Y%m%d_%H%M%S).txt" &Note that this example of top -H may consume a
significant amount of CPU because it must iterate over all threads in
the system.
To investigate a set of PIDs more directly, a command like the following may be useful, replace the $PIDXs with your process IDs, and when looking at the top output, look at the second stanza:
$ while true; do for i in $PID1 $PID2 $PID3; do echo "Gathering data for PID $i at $(date)"; top -H -p $i -b -d 10 -n 2 > diag_top_$(hostname)_$(date +%Y%m%d_%H%M%S)_$i.txt; kill -3 $i; done; echo "Sleeping at $(date)"; sleep 60; donepidstat
pidstat provides detailed, per-process information. For example:
pidstat
Linux 4.19.76-linuxkit (fca32e320852)   09/09/20    _x86_64_    (4 CPU)

20:09:39      UID       PID    %usr %system  %guest   %wait    %CPU   CPU  Command
20:09:39        0         1    0.00    0.00    0.00    0.00    0.00     1  entrypoint.sh
20:09:39        0         7    0.00    0.00    0.00    0.00    0.00     0  supervisord
20:09:39        0        10    0.00    0.00    0.00    0.00    0.00     1  rsyslogd
Load Average
Load average is defined as:
The first three fields in [/proc/loadavg] are load average figures giving the number of jobs in the run queue (state R) or waiting for disk I/O (state D) averaged over 1, 5, and 15 minutes.
A load average is reported as three numbers representing 1-minute, 5-minute, and 15-minute exponentially damped/weighted moving averages of the number of runnable and uninterruptible threads recalculated every 5 seconds. If these numbers are greater than the number of CPU cores, then there may be cause for concern.
If capturing top -H during a time of a high load average
does not show high CPU usage, then it is more likely caused by
uninterruptible threads, which are usually waiting on I/O. If CPU
utilization does not correlate with load averages, review the number of
threads in the "D" (uninterruptible) state.
atop
atop is
an ASCII based live and historical system monitor.
Run without any options to do live monitoring:
$ atopIncludes crontab files to run atop in the background. Read a historical file:
# atop -r /var/log/atop/atop_20140908.1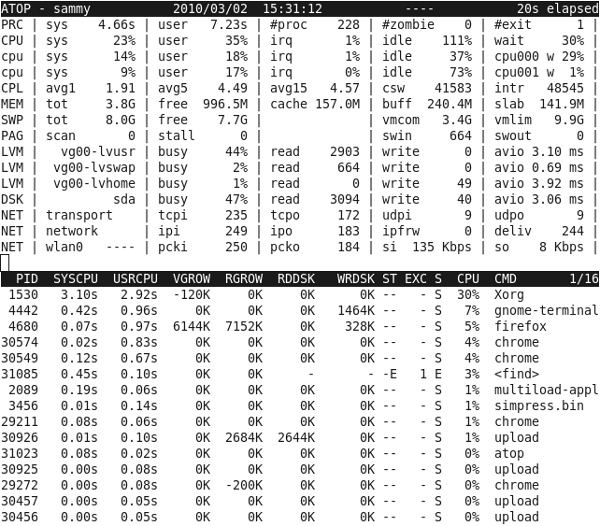
Write atop data with a 10 second interval (Ctrl+C to stop):
atop -w atop.raw 10Graph CPU usage of some process (replace the program name or PID in the first grep):
atop -PPRC -r atop.raw | grep java.*y$ | awk '{if(NR>1) {printf "%s %s,%d\n", $4,$5,(($11+$12+$13)10)/$10} else print "Time,CPU%"}' | \
gnuplot -p -e "set timefmt '%Y/%m/%d %H:%M:%S'; set xtics out;set ytics out; set xdata time; set datafile sep ','; set grid; set style data lines; \
set format y '%.0f'; set format x '%H:%M:%S'; set key autotitle columnhead; plot '/dev/stdin' using 1:2; pause -1"
sar
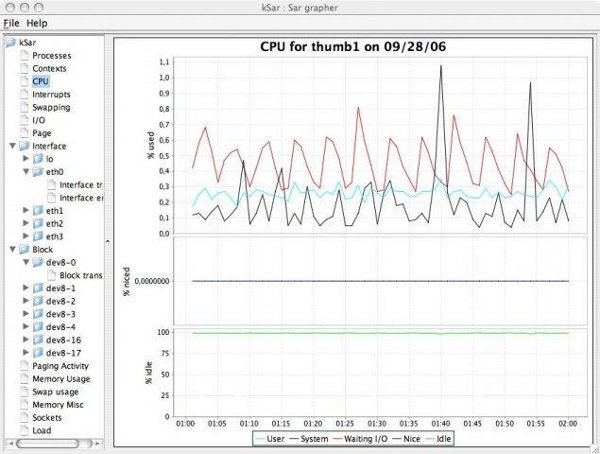
sar
is part of the sysstat package. It may be run periodically
from a crontab in /etc/cron.d/sysstat and writes files to /var/log/sa/.
You can report sar data textually on the system using the "sar"
command:
$ sar -A | head
Linux 2.6.32-431.30.1.el6.x86_64 (host)     09/09/2014     _x86_64_    (8 CPU)
12:00:01 AM     CPU      %usr     %nice      %sys   %iowait    %steal      %irq     %soft    %guest     %idle
12:10:01 AM     all      0.86      0.00      0.59     0.15      0.00      0.00     0.00      0.00     98.41...
Some useful things to look at in sar:
- runq-sz
- plist-sz
- kbmemused - kbbuffers - kbcached
You can also visualize sar log files using ksar:
nmon
nmon
was originally developed for AIX but has since been ported to Linux.
One reason to use nmon on Linux is that the Java NMONVisualizer
tool is a very powerful and flexible graphing application that
accepts nmon data. Note that Linux nmon records time in the local
timezone, so the local time zone should be selected when loading in
NMONVisualizer.. For details, see the nmon
section in the AIX chapter.
Start nmon for essentially unlimited collection with a 60 second interval:
sudo nohup nmon -fT -s 60 -c 1000000 -t && sleep 2 && sudo cat nohup.out # Confirm no errors in the outputExecuting this command will start the nmon collector in the
background, so explicitly putting it into the background (&) is not
necessary. This will create a file with the name
$HOST_$STARTDAY_$STARTTIME.nmon
Note that any errors starting nmon (such as file pemissions writing
to the specified directory) will go to nohup.out, so it is important to
check nohup.out to make sure it started correctly. You can also run
ps -elfx | grep nmon to make sure it started.
When you want to stop nmon, run:
sudo pkill -USR2 nmoncollectl
collectl is
a comprehensive, open source, Linux monitoring tool created by RedHat.
It is often used
on RHEL systems:
Collectl is a comprehensive performance data collection utility similar to sar. It is fine grained with low overhead and holistically collects all of the important kernel statistics as well as process data. Additionally, it is a very simple tool to collect very useful performance data.
While collectl is neither shipped nor supported by Red Hat at this time, it is a useful and popular utility frequently used by users and third party vendors.
Kernel event tracing
Linux kernel
event tracing is a simple way to use Linux kernel event trace
points. An event has the form of $SUBSYSTEM:$EVENT. Example
commands:
- List all available events:
Alternatively:cat /sys/kernel/tracing/available_eventsfind /sys/kernel/tracing/events -type d - Show currently enabled events:
cat /sys/kernel/tracing/set_event - Set the timestamp format (
trace_clock) toperffor better correlation toperftracing:
Show current timestamp format:echo perf > /sys/kernel/tracing/trace_clock# cat /sys/kernel/tracing/trace_clock local global counter uptime [perf] mono mono_raw boot tai x86-tsc - Example: enable all scheduler events:
Alternatively:echo 'sched:*' >> /sys/kernel/tracing/set_eventecho 1 > /sys/kernel/tracing/events/sched/enable - Dump the traces:
cat /sys/kernel/tracing/trace > diag_kernelevents_$(hostname)_$(date +%Y%m%d_%H%M%S).txt - Example: disable all scheduler events:
Alternatively:echo '!sched:*' >> /sys/kernel/tracing/set_eventecho 0 > /sys/kernel/tracing/events/sched/enable - Disable all events:
echo > /sys/kernel/tracing/set_event
sched event tracing
Example output:
#                                _-----=> irqs-off/BH-disabled
#                               / _----=> need-resched
#                              | / _---=> hardirq/softirq
#                              || / _--=> preempt-depth
#                              ||| / _-=> migrate-disable
#                              |||| /     delay
#           TASK-PID     CPU#  |||||  TIMESTAMP  FUNCTION
#              | |         |   |||||     |         |
            java-4400    [002] d..2.  4267.320290: sched_switch: prev_comm=java prev_pid=4400 prev_prio=120 prev_state=R ==> next_comm=kworker/2:14 next_pid=4213 next_prio=120
    kworker/2:14-4213    [002] d..2.  4267.320368: sched_stat_runtime: comm=kworker/2:14 pid=4213 runtime=80661 [ns]
    kworker/2:14-4213    [002] d..2.  4267.320370: sched_switch: prev_comm=kworker/2:14 prev_pid=4213 prev_prio=120 prev_state=I ==> next_comm=kworker/u19:3 next_pid=1612 next_prio=120
   kworker/u19:3-1612    [002] d..2.  4267.320373: sched_stat_runtime: comm=kworker/u19:3 pid=1612 runtime=5538 [ns]
   kworker/u19:3-1612    [002] d..2.  4267.320375: sched_switch: prev_comm=kworker/u19:3 prev_pid=1612 prev_prio=120 prev_state=I ==> next_comm=java next_pid=4400 next_prio=120
In this example snippet, the first event shows that a Java executable
with PID 4400 was running on CPU 002 and the sched_switch
event occurred to switch out this process (prev_pid=4400)
from CPU 002 and switch in PID 4213 (next_pid=4213). At the
time of the switch out, the process was runnable
(prev_state=R) so this was an involuntary context switch.
Then a few kernel threads worked on CPU 002 and finally execution went
back to the Java process. The timestamp column is the number of seconds
since boot and the final event is when the Java PID switched back onto
CPU 002 (next_pid=4400), so it was involuntarily off CPU
for ~85 microeconds.
uprobes
uprobes are a Linux kernel mechanism to trace user program function calls.
uprobe example
In the following example, there is a function entry uprobe
(p) called probe_a/play for the
/home/user1/a.out binary for the play function
at offset 0x1156:
# cat /sys/kernel/debug/tracing/uprobe_events
p:probe_a/play /home/user1/a.out:0x0000000000001156
Although you may define
uprobes manually, perf probe is often easier to
use.
Each uprobe has a corresponding directory entry through which it can be controlled:
# cat /sys/kernel/debug/tracing/events/probe_a/enable
0
Once an event is enabled:
# echo 1 > /sys/kernel/debug/tracing/events/probe_a/enableA trace will be printed every time the function is executed:
# cat /sys/kernel/debug/tracing/trace
# tracer: nop
#
# entries-in-buffer/entries-written: 10/10   #P:6
#
#                                _-----=> irqs-off
#                               / _----=> need-resched
#                              | / _---=> hardirq/softirq
#                              || / _--=> preempt-depth
#                              ||| / _-=> migrate-disable
#                              |||| /     delay
#           TASK-PID     CPU#  |||||  TIMESTAMP  FUNCTION
#              | |         |   |||||     |         |
           a.out-3019    [005] .....  2378.367334: play: (0x401156)
perf Profiler Tool
perf is a user program and kernel sampling CPU profiler tool available since Linux 2.6.
perf record
perf record
is used to gather sampled CPU activity into a perf.data
file.
In general, perf should be run as root
given that the kernel.perf_event_paranoid
setting defaults to 2. To allow non-root usage, this may be
overridden with, for example,
sysctl -w kernel.perf_event_paranoid=-1 or adding
kernel.perf_event_paranoid=-1 to
/etc/sysctl.conf and running sysctl -p.
Here is the most common example that gathers system-wide
(-a) user and kernel call stack samples (-g)
at a ~10.1ms frequency (-F 99 = 99 Hertz;
milliseconds=1000/F) for 60 seconds (sleep 60)
and assumes frame pointer omission
(--call-graph dwarf,65528; discussed below):
perf record --call-graph dwarf,65528 -F 99 -a -g -- sleep 60The next most common example gathers process-specific
(-p) call stack samples:
perf record --call-graph dwarf,65528 -F 99 -g -p $PID -- sleep 60perf call stacks
By default, perf walks callstacks using the frame pointer register
(--call-graph fp); however, this may cause truncated stacks
if a sampled binary is built with frame
pointer ommission (FPO):
In some systems, where binaries are built with gcc --fomit-frame-pointer, using the "fp" method will produce bogus call graphs, using "dwarf", if available (perf tools linked to the libunwind or libdw library) should be used instead. Using the "lbr" method doesn't require any compiler options. It will produce call graphs from the hardware LBR registers. The main limitation is that it is only available on new Intel platforms, such as Haswell. It can only get user call chain. It doesn't work with branch stack sampling at the same time.
When "dwarf" recording is used, perf also records (user) stack dump when sampled. Default size of the stack dump is 8192 (bytes). User can change the size by passing the size after comma like "--call-graph dwarf,4096".
If frame pointer omission is used (such as it is on IBM
Java/Semeru/OpenJ9), you should use
--call-graph dwarf,65528 with perf record
(values larger than 65528 don't work). For example:
perf record --call-graph dwarf,65528 -F 99 -a -g -- sleep 60Note that DWARF based call stack walking may be up to 20% or much more slower than frame pointer based call stack walking.
As an alternative, when running on Intel Haswell and newer CPUs, test
using --call-graph lbr which uses a hardware Last Branch
Record (LBR) capability, doesn't require a frame pointer, and is
generally less overhead than DWARF (although it has a limited maximum
depth):
perf record --call-graph lbr -F 99 -a -g -- sleep 60perf and J9
IBM Java and Semeru have options that resolve JIT-compiled top stack frames:
- For IBM Java >= 8.0.7.20 or Semeru >= v8.0.352 / 11.0.17.0 /
17.0.5.0, restart the Java process with
-XX:+PerfTool - For older versions of IBM Java and Semeru, restart the Java process
with
-Xjit:perfToolwhile making sure to combine with commas with any pre-existing-Xjitoptions. Only the last-Xjitoption is processed, so if there is additional JIT tuning, combine theperfTooloption with that tuning; for example,-Xjit:perfTool,exclude={com/example/generated/*}.
These options create a /tmp/perf-$PID.map file that the
perf tool knows to read to try to resolve unknown symbols.
This option must be used on JVM startup and cannot be enabled
dynamically. If not all symbols are resolved, try adding
-Xlp:codecache:pagesize=4k. Currently, the option
-XX:+PreserveFramePointer to allow walking JIT-compiled
method stacks is not
supported on J9 (and, in any case, that would require
--call-graph fp so you would lose native JVM callstack
walking).
An example
perf post-processing script is provided in the OpenJ9
repository:
chmod a+x perf-hottest- Restart the JVM with
-Xjit:perfTool - When the issue occurs:
perf record --call-graph dwarf,65528 -F 99 -g -p $PID -- sleep 60 perf script -G -F comm,tid,ip,sym,dso | ./perf-hottest sym > diag_perf_$(hostname)_$(date +%Y%m%d_%H%M%S_%N).txt
perf and J9 with assembly annotated profiling of JITted code
perf provides a JVMTI
agent called libperf-jvmti.so that provides assembly
annotated profiling of JITted code.
Unfortunately, this requires compiling perf itself (although this can
be done on any similar architecture machine and the
libperf-jvmti.so binary copied to the target machine):
- Compile
perf:- Debian/Ubuntu:
apt-get update
DEBIAN_FRONTEND=noninteractive TZ=${TZ:-UTC} apt-get -y install python python3 build-essential make gcc g++ default-jdk libbabeltrace-dev libbabeltrace-ctf-dev flex bison libelf-dev libdw-dev libslang2-dev libssl-dev libiberty-dev libunwind-dev libbfd-dev libcap-dev libnuma-dev libperl-dev python-dev libzstd-dev git
git clone --depth 1 https://git.kernel.org/pub/scm/linux/kernel/git/torvalds/linux.git
cd linux/tools/perf
make
- Debian/Ubuntu:
- Start Java with the path to the compiled
libperf-jvmti.so(replace$DIRwith the path to the rootperffolder). Note that-Xjit:perfToolis no longer needed.-agentpath:$DIR/linux/tools/perf/libperf-jvmti.so - Run
perf record:perf record -k 1 --call-graph dwarf,65528 -F 99 -a -g -- sleep 60 - Create a new
perfdata file with injected JIT data:perf inject -i perf.data --jit -o perf.data.jitted - Process the
perfdata as in the other examples in this chapter except use-i perf.data.jittedto read the newperfdata file. For examples:- Using
perf report:perf report -i perf.data.jitted- Type
aon a function to annotate the hot assembly instructions
- Dump the stacks:
perf script -i perf.data.jitted
- Using
Here's an example performing the above using a container (if using
podman machine, first run
podman system connection default podman-machine-default-root):
podman run --privileged -it --rm ibm-semeru-runtimes:open-17-jdk sh -c 'sysctl -w kernel.perf_event_paranoid=-1 && apt-get update && DEBIAN_FRONTEND=noninteractive TZ=${TZ:-UTC} apt-get -y install python python3 build-essential make gcc g++ default-jdk libbabeltrace-dev libbabeltrace-ctf-dev flex bison libelf-dev libdw-dev libslang2-dev libssl-dev libiberty-dev libunwind-dev libbfd-dev libcap-dev libnuma-dev libperl-dev python-dev libzstd-dev git && git clone --depth 1 https://git.kernel.org/pub/scm/linux/kernel/git/torvalds/linux.git && cd linux/tools/perf && make && echo "public class main { public static void main(String... args) { for (int i = 0; i < 50000; i++) { byte[] b = new byte[(int)(Math.random()*10)*1048576]; } } }" > main.java && javac main.java && ./perf record -k 1 --call-graph dwarf,65528 -F 99 -a -g -- java -agentpath:/linux/tools/perf/libperf-jvmti.so main && ./perf inject -i perf.data --jit -o perf.data.jitted && ./perf script -i perf.data.jitted'perf report
perf report
may be used to post-process a perf.data file to summarize
the results.
In the default mode, an ncurses-based display allows for graphical exploration:
perf report -n --show-cpu-utilizationThe second column, Self, reports the percentage of
samples just in that method. The first
column, Children, reports Self plus the
Self of all functions that this method calls,
[...] so that it can show the total overhead of the higher level functions even if they don't directly execute much". [...] It might be confusing that the sum of all the 'children' overhead values exceeds 100% since each of them is already an accumulation of 'self' overhead of its child functions. But with this enabled, users can find which function has the most overhead even if samples are spread over the children.
To only report Self percentages, use
--no-children:
perf report -n --show-cpu-utilization --no-childrenTo automatically multiply the percentages down the graph, use
-g graph. Stacks may be coalesced with
-g folded.
Common shortcuts:
+to expand/collapse a call stackato annotate the hot assembly instructionsHto jump to the hottest instruction
To print in text form, add the --stdio option. For
example:
perf report -n --show-cpu-utilization --stdioWith detailed symbol information, order by the overhead of source file name and line number:
perf report -s srclineperf script
perf script
may be used to post-process a perf.data file to dump
results in raw form for post-processing scripts.
Useful commands
Query available CPU statistics:
# perf list

List of pre-defined events (to be used in -e):
  cpu-cycles OR cycles                               [Hardware event]
  instructions                                       [Hardware event]
  cache-references                                   [Hardware event]
  cache-misses                                       [Hardware event]...
Query CPU statistics for a process (use sleep X for some duration or without sleep X and Ctrl+C to stop):
# perf stat -B -e cycles,cache-misses -p 11386 sleep 5
 Performance counter stats for process id '11386':

        20,810,324 cycles
           215,879 cache-misses
       5.000869037 seconds time elapsed
Sample CPU events for a process and then create a report:
perf record --call-graph dwarf -p 11386 sleep 5
perf report
Query CPU statistics periodically:
$ perf top
Samples: 5K of event 'cycles', Event count (approx.): 1581538113
 21.98%  perf                                        [.] 0x000000000004bd30
  4.28%  libc-2.12.so                                [.] __strcmp_sse42
Application deep-dive:
perf stat -e task-clock,cycles,instructions,cache-references,cache-misses,branches,branch-misses,faults,minor-faults,cs,migrations -r 5 nice taskset 0x01 java myappperf Flame Graphs
Flame
graphs are a great way to visualize perf activity:
git clone https://github.com/brendangregg/FlameGraph
cd FlameGraph
perf record --call-graph dwarf,65528 -F 99 -a -g -- sleep 60
perf script | ./stackcollapse-perf.pl > out.perf-folded
./flamegraph.pl --width 600 out.perf-folded > perf-kernel.svg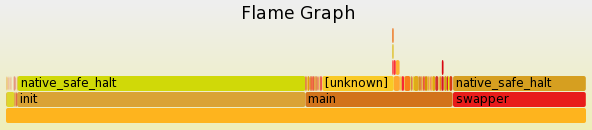
Intel Processor Trace
magic-trace
uses perf to analyze CPU activity if Intel Processor Trace
is available, rather than stack sampling.
PerfSpect
Intel PerfSpect calculates high level metrics from hardware events.
Machine clears are when the entire pipeline must be cleared. One cause of this is "false sharing" when 2 CPUs read/write to unrelated variables that happen to share the same L1 cache line.
perf on-CPU Stack Sampling
The $(perf record) command may be used to capture native stack traces on all CPUs at some frequency for some period of time. The following example captures all on-CPU stacks every 50ms for 60 seconds and writes the data to a file called perf.data:
nohup sudo sh -c "date +'%Y-%m-%d %H:%M:%S.%N %Z' >> diag_perfdata_starttimes.txt; cat /proc/uptime >> diag_perfdata_starttimes.txt; perf record --call-graph dwarf,65528 -T -F 19 -a -g -- sleep 60" &The frequency F may be converted to milliseconds (M) with the
equation M=1000/F, so if you want to capture at a different millisecond
frequency, use the equation F=1000/M. For example, to capture at 10ms
frequency, F=1000/10, so the argument would be -F 100. It's
generally a good idea to substract 1 from F (e.g. -F 99) to
avoid any coincidental sampling of application activity of the same
frequency.
There is no way to change the output file name to something other
than perf.data. If the file perf.data already exists, it is moved to
perf.data.old before overwriting the existing file.
The reason for writing the date with millisecond precision into a separate file right before starting $(perf record) is that uptime may have drifted from wallclock time; therefore, it is not a reliable reflection of wallclock time and stack tick offsets cannot be compared to the wallclock of uptime. When the $(perf) command reports the "captured on" wallclock time, it is simply looking at the creation time of the perf.data file (which occurs at the completion of the recording) which is a time_t, which is second precision, so the exact start time with millisecond precision is unavailable. This means that the only way to get millisecond precision wallclock time of a perf stack is to create a separate file that notes the wallclock time with millisecond accuracy right before starting perf.
Before recording, ensure that you have installed at least the kernel and glibc symbols (these are only used by the diagnostic tools to map symbols, so they do not change the function of the OS but they do use about 1GB of disk space). If you cannot install debug symbols for any reason, then gather the kernel symbol table for manual cross-reference.
If you are using IBM Java >= 7.1, then restart the JVM with the
argument -Xjit:perfTool. The JIT will then write a file to
/tmp/perf-${PID}.map which maps JIT-compiled method addresses to
human-readable Java method names for the $(perf script) tool to use. For
IBM Java < 7.1, use perf-map-agent
After the $(perf record) script has completed, process the data to human readable form:
sudo chmod a+rw /tmp/perf-${PID}.map
sudo chown root:root /tmp/perf-${PID}.map
sudo perf script --header -I -f -F comm,cpu,pid,tid,time,event,ip,sym,dso,symoff > diag_perfdata_$(hostname)_$(date +%Y%m%d_%H%M%S_%N).stdout.txt 2> diag_perfdata_$(hostname)_$(date +%Y%m%d_%H%M%S_%N).stderr.txt
The perf script command might give various errors and warnings and they're usually about missing symbols and mapping files, which is generally expected (since it's sampling all processes on the box).
The fourth field is the number of seconds since boot (with microsecond precision after the decimal point), in the same format as the first column of /proc/uptime. For example, this stack time is 17020.130034:
main 10840/10841 [006] 17020.130034: cycles:ppp:
            7f418d20727d Loop.main([Ljava/lang/String;)V_hot+0x189 (/tmp/perf-10840.map)
            7f41a8010360 [unknown] ([unknown])
                       0 [unknown] ([unknown])
The top of the perf.data file will include a timestamp when the $(perf record) command started writing the perf.data file (which occurs at the completion of the recording). For example:
# captured on: Tue Nov 13 11:48:03 2018Therefore, one can approximate the wallclock time of each stack by taking the difference between the first stack's time field and the target stack's time field and adding that number of seconds to the captured time minus the sleep time. Unfortunately, this only gives second level resolution because the captured time only provides second level resolution. Instead, one can use the date printed into diag_perfdata_starttimes.txt and add the difference in seconds to that date.
The columns are:
- Thread name
- PID/TID
- CPUID
- Timestamp
- perf event
- Within each stack frame:
- Instruction pointer
- Method name+Offset
- Executable or shared object (or mapping file)
For off-CPU stack sampling, see https://www.brendangregg.com/offcpuanalysis.html
Calculating CPU statistics
Example calculating various CPU statistics for a program execution:
$ sudo perf stat -- echo "Hello World"
Hello World

  Performance counter stats for 'echo Hello World':

               0.36 msec task-clock                #    0.607 CPUs utilized
                  0      context-switches          #    0.000 K/sec
                  0      cpu-migrations            #    0.000 K/sec
                 64      page-faults               #    0.177 M/sec
          1,253,194      cycles                    #    3.474 GHz
            902,044      instructions              #    0.72  insn per cycle
            189,611      branches                  #  525.656 M/sec
              7,573      branch-misses             #    3.99% of all branches

        0.000594366 seconds time elapsed
        0.000652000 seconds user
        0.000000000 seconds sys
The statistics may be pruned with the -e flag:
$ sudo perf stat -e task-clock,cycles -- echo "Hello World"
Hello World

  Performance counter stats for 'echo Hello World':

               0.60 msec task-clock                #    0.014 CPUs utilized
          1,557,975      cycles                    #    2.582 GHz

        0.043947354 seconds time elapsed
        0.000000000 seconds user
        0.001175000 seconds sys
The -r flag runs the program a certain number of times and calculates average statistics for all of the runs:
$ sudo perf stat -r 10 -- echo "Hello World"
Hello World
Hello World
Hello World
Hello World
Hello World
Hello World
Hello World
Hello World
Hello World
Hello World

  Performance counter stats for 'echo Hello World' (10 runs):

               0.33 msec task-clock                #    0.661 CPUs utilized            ( +-  2.14% )
                  0      context-switches          #    0.302 K/sec                    ( +-100.00% )
                  0      cpu-migrations            #    0.000 K/sec
                 63      page-faults               #    0.190 M/sec                    ( +-  0.75% )
          1,148,795      cycles                    #    3.471 GHz                      ( +-  2.09% )
            880,890      instructions              #    0.77  insn per cycle           ( +-  0.56% )
            185,916      branches                  #  561.772 M/sec                    ( +-  0.52% )
              7,365      branch-misses             #    3.96% of all branches          ( +-  1.45% )

          0.0005010 +- 0.0000212 seconds time elapsed  ( +-  4.24% )
The program may be bound to particular CPUs to check the impact of context switches and other kernel tuning:
$ sudo perf stat -e context-switches,cpu-migrations -- taskset -c 0 echo "Hello World"
Hello World

  Performance counter stats for 'taskset -c 0 echo Hello World':

                  1 context-switches
                  1 cpu-migrations

        0.001013727 seconds time elapsed

        0.000000000 seconds user
        0.001057000 seconds sys
Calculating CPU cycles
Example calculating the total number of CPU cycles used by a program:
# perf stat -e task-clock,cycles -- echo "Hello World"
Hello World

 Performance counter stats for 'echo Hello World':

              0.97 msec task-clock                #    0.222 CPUs utilized
   <not supported>      cycles

       0.004376900 seconds time elapsed

       0.000000000 seconds user
       0.000000000 seconds sys
Instructions per cycle
Instructions per cycle (IPC) shows approximately how many instructions were completed per CPU clock cycle. The maximum IPC is based on the CPU architecture and how "wide" it is; i.e., the maximum possible instructions a CPU can complete per clock cycle. Some recent processors are commonly 4- or 5-wide meaning a maximum IPC of 4 or 5, respectively. A useful heuristic is that an IPC less than 1 suggests the CPU is memory-stalled whereas an IPC greater than 1 suggests the CPU is instruction-stalled.
Kernel timer interrupt frequency
perf stat -e 'irq_vectors:local_timer_entry' -a -A --timeout 30000perf probe
perf probe
is used to configure tracepoints such as uprobes.
List uprobes for a binary
# perf probe -F -x /home/user1/a.out
completed.0
data_start
deregister_tm_clones
frame_dummy
main
play
register_tm_clones
Example searching for malloc:
# perf probe -F -x /lib64/libc.so.6 | grep malloc
cache_malloced
malloc
malloc
malloc_consolidate
malloc_info
malloc_info
malloc_printerr
malloc_stats
malloc_stats
malloc_trim
malloc_trim
malloc_usable_size
malloc_usable_size
ptmalloc_init.part.0
sysmalloc
Enable uprobe
# perf probe -x /home/user1/a.out play
Added new event:
  probe_a:play         (on play in /home/user1/a.out)

You can now use it in all perf tools, such as:

        perf record -e probe_a:play -aR sleep 1
Example tracing callgraphs of malloc calls for a particular process for 30 seconds:
# perf record -e probe_libc:malloc --call-graph dwarf -p 3019 -- sleep 30
[ perf record: Woken up 1 times to write data ]
[ perf record: Captured and wrote 0.063 MB perf.data (6 samples) ]
# perf report | head -20
# To display the perf.data header info, please use --header/--header-only options.
#
#
# Total Lost Samples: 0
#
# Samples: 6  of event 'probe_libc:malloc'
# Event count (approx.): 6
#
# Children      Self  Trace output
# ........  ........  ..............
#
   100.00%   100.00%  (7fdd73052610)
            |
            ---_start
               __libc_start_main_alias_2 (inlined)
               __libc_start_call_main
               main
               play
Or for all processes:
# perf record -e probe_libc:malloc --call-graph dwarf -a -- sleep 30
[ perf record: Woken up 697 times to write data ]
Warning:
Processed 82896 events and lost 8 chunks!

Check IO/CPU overload!

Warning:
2 out of order events recorded.
[ perf record: Captured and wrote 216.473 MB perf.data (25915 samples) ]
# perf report | head -20
Warning:
Processed 82896 events and lost 8 chunks!

Check IO/CPU overload!

Warning:
2 out of order events recorded.
# To display the perf.data header info, please use --header/--header-only options.
#
#
# Total Lost Samples: 0
#
# Samples: 25K of event 'probe_libc:malloc'
# Event count (approx.): 25915
#
# Children      Self  Command          Shared Object                     Symbol
# ........  ........  ...............  ................................  ..............................................................................................
#
    43.30%    43.30%  konsole          libc.so.6                         [.] malloc
            |
            |--29.76%--0x55ea4b5f6af4
            |          __libc_start_main_alias_2 (inlined)
            |          __libc_start_call_main
            |          0x55ea4b5f6564
            |          QCoreApplication::exec
            |          QEventLoop::exec
            |          QEventDispatcherGlib::processEvents
List enabled uprobes
# perf probe -l
  probe_a:play         (on play@/home/user1/test.c in /home/user1/a.out)
Disable uprobe
# perf probe -d probe_a:play
Removed event: probe_a:play
eBPF
Extended BPF (eBPF) is a Linux kernel tracing utility. It's based on the Berkeley Packet Filter (BPF) which was originally designed for efficient filtering of network packets, but eBPF has been extended into a broader range of purposes such as call stack sampling for performance profiling. Depending on usage, there are different tools that are front-ends to eBPF such as BPF Compiler Collection (BCC) and bpftrace.
eBPF profiling
On Linux >= 4.8, eBPF is generally more efficient than perf in gathering call
stack samples because some things can be done more efficiently inside
the kernel. This capability is available in the profile
tool in bcc. As with perf, eBPF generally is run as
root.
However, eBPF does not
support DWARF-based or LBR-based call stack walking like
perf record does with --call-graph dwarf.
Previous attempts at integrating DWARF stack walking in the kernel were
buggy.
Alternative proposals of user-land DWARF stack walking integration into
eBPF have been proposed but not yet
implemented.
Therefore, for programs that use frame pointer omission (such as IBM Java/Semeru/OpenJ9), call stack walking with eBPF is very limited.
eBPF profiling example
$ git clone https://github.com/brendangregg/FlameGraph  # or download it from github
$ apt-get install bpfcc-tools  # might be called bcc-tools
$ cd FlameGraph
$ profile-bpfcc -F 99 -adf 60 > out.profile-folded  # might be called /usr/share/bcc/tools/profile
$ ./flamegraph.pl out.profile-folded > profile.svg
bpftrace
bpftrace is a command line interface to tracepoints such as uprobes.
List probes
bpftrace -lProbe sleeping processes
# bpftrace -e 'kprobe:do_nanosleep { printf("PID %d sleeping...\n", pid); }'
Attaching 1 probe...
PID 1668 sleeping...
Count syscalls by process
# bpftrace -e 'tracepoint:raw_syscalls:sys_enter { @[comm] = count(); }'
Attaching 1 probe...
^C
@[a.out]: 4
[...]
Trace uprobe
# bpftrace -e 'uprobe:/home/user1/a.out:play { printf("%llx\n", reg("ip")); }'
Attaching 1 probe...
401156
# objdump -d /home/user1/a.out | grep play
0000000000401156 <play>:
Histogram of read call times
# bpftrace -e 'tracepoint:syscalls:sys_enter_read { @start[tid] = nsecs; } tracepoint:syscalls:sys_exit_read / @start[tid] / { @times = hist(nsecs - @start[tid]); delete(@start[tid]); }'
Attaching 2 probes...
^C

@start[25436]: 4171433620436
@start[1933]: 4171434103928
@times:
[256, 512)             6 |@@@                                                 |
[512, 1K)             85 |@@@@@@@@@@@@@@@@@@@@@@@@@@@@@@@@@@@@@@@@@@@@@@@@@@@@|
[1K, 2K)              69 |@@@@@@@@@@@@@@@@@@@@@@@@@@@@@@@@@@@@@@@@@@          |
[2K, 4K)              45 |@@@@@@@@@@@@@@@@@@@@@@@@@@@                         |
[4K, 8K)              76 |@@@@@@@@@@@@@@@@@@@@@@@@@@@@@@@@@@@@@@@@@@@@@@      |
[8K, 16K)             37 |@@@@@@@@@@@@@@@@@@@@@@                              |
[16K, 32K)            36 |@@@@@@@@@@@@@@@@@@@@@@                              |
[32K, 64K)            12 |@@@@@@@                                             |
[64K, 128K)            3 |@                                                   |
[128K, 256K)           3 |@                                                   |
[256K, 512K)           3 |@                                                   |
[512K, 1M)             0 |                                                    |
[1M, 2M)               1 |                                                    |
[2M, 4M)               1 |                                                    |
htop
htop is similar to the top program. For example:
  1  [||                                        1.0%]   Tasks: 84, 537 thr; 1 running
  2  [||                                        1.0%]   Load average: 0.26 0.60 0.35
  3  [||                                        1.4%]   Uptime: 04:13:07
  4  [||                                        1.7%]
  Mem[||||||||||||||||||||||||||||||     2.09G/7.78G]
  Swp[                                      0K/1024M]

  PID USER      PRI  NI  VIRT   RES   SHR S CPU% MEM%   TIME+  Command
   17 was        20   0 3167M  264M 78172 S  2.7  3.3  0:25.76 java -javaagent:/opt/ibm/wlp/bin/tools/ws-javaagen
  172 was        20   0 4700M  206M 58896 S  1.3  2.6  0:19.88 java -javaagent:/opt/ibm/wlp/bin/tools/ws-javaagen
 1517 was        20   0 4702M  428M  100M S  1.0  5.4  0:41.35 /opt/IBM/WebSphere/AppServer/java/8.0/bin/java -Do [...]
dstat
dstat provides information on CPU, disk, memory, and network. For example:
You did not select any stats, using -cdngy by default.
----total-usage---- -dsk/total- -net/total- ---paging-- ---system--
usr sys idl wai stl| read  writ| recv  send|  in   out | int   csw
  0   0  98   0   0|   0     0 |   0     0 |   0     0 | 874  1142
  0   0  99   0   0|   0     0 |   0     0 |   0     0 | 851  1076
  0   0  98   0   0|   0   192k|   0     0 |   0     0 | 756   920
  1   1  97   0   0|   0     0 |   0     0 |   0     0 | 831  1000
  2   1  97   0   0|   0  4097B|   0     0 |   0     0 | 861  1025
glances
glances provides various information in one glance:
fca32e320852 (Fedora 32 64bit / Linux 4.19.76-linuxkit)                                           Uptime: 4:19:43

CPU  [  2.2%]   CPU       2.2%  nice:     0.0%  ctx_sw:   960   MEM     30.6%   SWAP      0.0%   LOAD    4-core
MEM  [ 30.6%]   user:     0.8%  irq:      0.0%  inter:    772   total:  7.78G   total:   1024M   1 min:    0.21
SWAP [  0.0%]   system:   0.7%  iowait:   0.0%  sw_int:   699   used:   2.38G   used:        0   5 min:    0.27
                idle:    98.6%  steal:    0.0%                  free:   5.40G   free:    1024M   15 min:   0.28

NETWORK       Rx/s   Tx/s   TASKS  82 (627 thr), 1 run, 81 slp, 0 oth sorted automatically by CPU consumption
eth0            0b   192b
lo              0b     0b   CPU%   MEM%  VIRT  RES     PID USER          TIME+ THR  NI S  R/s W/s  Command
                            2.6    0.4   177M  34.1M  3145 root           0:00 1     0 R    0 0    /usr/bin/pytho
TCP CONNECTIONS             2.3    3.3   3.09G 263M     17 was            0:38 87    0 S    0 0    java -javaagen
Listen                 34   0.7    2.5   4.59G 199M    172 was            0:22 49    0 S    0 0    java -javaagen
Initiated               0   0.3    5.4   4.60G 430M   1517 was            0:45 151   0 S    0 0    /opt/IBM/WebSp
Established             2   0.0    9.0   1.99G 714M     59 root           0:00 4     0 S    0 0    /usr/sbin/slap
Terminated              0   0.0    1.0   1.46G 78.2M   286 mysql          0:01 30    0 S    0 0    /usr/libexec/m
Tracked          0/262144   0.0    0.9   680M  68.9M   600 was            0:01 9     0 S    0 0    /usr/bin/Xvnc
                            0.0    0.9   679M  68.6M   106 root           0:01 9     0 S    0 0    /usr/bin/Xvnc
DISK I/O      R/s    W/s    0.0    0.7   875M  57.5M   795 was            0:00 11    0 S    0 0    xfce4-session
sr0              0      0   0.0    0.3   167M  21.7M   676 root           0:00 3     0 S    0 0    /usr/lib64/xfc
sr1              0      0   0.0    0.2   62.7M 19.7M   126 root           0:00 1     0 S    0 0    /opt/IBM/HTTPS
                            0.0    0.2   231M  16.7M   755 root           0:00 3     0 S    0 0    /usr/lib64/xfc
FILE SYS      Used  Total   0.0    0.2   165M  13.9M   718 root           0:00 3     0 S    0 0    xfce4-power-ma
_c/hostname  43.7G  87.8G   0.0    0.1   2.05G 9.12M   324 nobody         0:00 102   0 S    0 0    /opt/IBM/HTTPS
System Tap (stap)
Systemtap simplifies creating and running kernel modules based on kprobes. See installing stap.
A simple "Hello World" script:
#!/usr/bin/stap
probe begin { println("Hello World") exit () }
Execute the script:
# stap helloworld.stpFor most interesting SystemTap scripts, the kernel development package and kernel symbols must be installed. See example scripts at the main repository and others such as a histogram of system call times.
Flame graphs are a great way to visualize CPU activity:
# stap -s 32 -D MAXBACKTRACE=100 -D MAXSTRINGLEN=4096 -D MAXMAPENTRIES=10240 \
    -D MAXACTION=10000 -D STP_OVERLOAD_THRESHOLD=5000000000 --all-modules \
    -ve 'global s; probe timer.profile { s[backtrace()] <<< 1; }
    probe end { foreach (i in s+) { print_stack(i);
    printf("\t%d\n", @count(s[i])); } } probe timer.s(60) { exit(); }' \
    > out.stap-stacks
# ./stackcollapse-stap.pl out.stap-stacks > out.stap-folded
# cat out.stap-folded | ./flamegraph.pl > stap-kernel.svg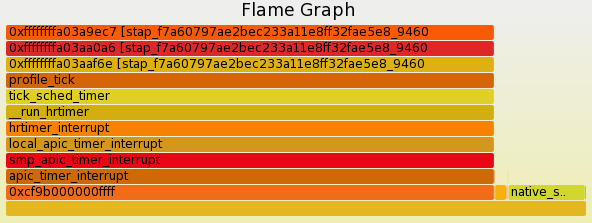
WAS Performance, Hang, or High CPU MustGather
The WAS
Performance, Hang, or High CPU MustGather (linperf.sh)
is normally requested by IBM support.
The script is run with the set of process IDs for the JVMs as
parameters and requests thread dumps through kill -3.
Intel VTune Profiler
Intel VTune Profiler is a deep profiler for Intel CPUs.
Instructions with a CPI rate of > ~100 may be concerning and signs of stalls (e.g. cache false sharing, etc.).
Intel Performance Counter Monitor (PCM)
The Intel Performance Counter Monitor (PCM) provides access to performance counters on Intel processors:
$ make
$ sudo ./pcm.x
 EXEC  : instructions per nominal CPU cycle
 IPC   : instructions per CPU cycle
 FREQ  : relation to nominal CPU frequency='unhalted clock ticks'/'invariant timer ticks' (includes Intel Turbo Boost)
 AFREQ : relation to nominal CPU frequency while in active state (not in power-saving C state)='unhalted clock ticks'/'invariant timer ticks while in C0-state'  (includes Intel Turbo Boost)
 L3MISS: L3 cache misses
 L2MISS: L2 cache misses (including other core's L2 cache *hits*)
 L3HIT : L3 cache hit ratio (0.00-1.00)
 L2HIT : L2 cache hit ratio (0.00-1.00)
 L3CLK : ratio of CPU cycles lost due to L3 cache misses (0.00-1.00), in some cases could be >1.0 due to a higher memory latency
 L2CLK : ratio of CPU cycles lost due to missing L2 cache but still hitting L3 cache (0.00-1.00)
 READ  : bytes read from memory controller (in GBytes)
 WRITE : bytes written to memory controller (in GBytes)
 IO    : bytes read/written due to IO requests to memory controller (in GBytes); this may be an over estimate due to same-cache-line partial requests
 TEMP  : Temperature reading in 1 degree Celsius relative to the TjMax temperature (thermal headroom): 0 corresponds to the max temperature

 Core (SKT) | EXEC | IPC  | FREQ  | AFREQ | L3MISS | L2MISS | L3HIT | L2HIT | L3CLK | L2CLK  | READ  | WRITE |  IO   | TEMP

   0    0     0.01   0.32   0.04    0.54     456 K    649 K    0.30    0.25    0.84    0.07     N/A     N/A     N/A     65
   1    0     0.01   0.54   0.02    0.46     286 K    412 K    0.31    0.31    0.91    0.08     N/A     N/A     N/A     65
   2    0     0.00   0.45   0.01    0.47     106 K    119 K    0.11    0.06    1.29    0.03     N/A     N/A     N/A     60
   3    0     0.02   0.81   0.03    0.54     524 K    598 K    0.12    0.19    1.21    0.03     N/A     N/A     N/A     60
   4    0     0.01   0.67   0.02    0.46     229 K    264 K    0.13    0.20    0.98    0.03     N/A     N/A     N/A     60
   5    0     0.00   0.25   0.01    0.47     216 K    224 K    0.04    0.03    1.86    0.02     N/A     N/A     N/A     60
   6    0     0.00   0.15   0.00    0.46      18 K     19 K    0.02    0.03    1.42    0.01     N/A     N/A     N/A     60
   7    0     0.00   0.34   0.00    0.47      45 K     46 K    0.02    0.03    1.69    0.01     N/A     N/A     N/A     60
-----------------------------------------------------------------------------------------------------------------------------
 SKT    0     0.01   0.53   0.02    0.50    1884 K   2334 K    0.19    0.21    1.07    0.05    0.18    0.02    0.04     60
-----------------------------------------------------------------------------------------------------------------------------
 TOTAL  *     0.01   0.53   0.02    0.50    1884 K   2334 K    0.19    0.21    1.07    0.05    0.18    0.02    0.04     N/A

 Instructions retired:  167 M ; Active cycles:  317 M ; Time (TSC): 2597 Mticks ; C0 (active,non-halted) core residency: 3.03 %

 C1 core residency: 4.92 %; C3 core residency: 1.98 %; C6 core residency: 0.09 %; C7 core residency: 89.97 %;
 C2 package residency: 6.29 %; C3 package residency: 4.29 %; C6 package residency: 4.51 %; C7 package residency: 57.55 %;

 PHYSICAL CORE IPC                 : 1.06 => corresponds to 26.41 % utilization for cores in active state
 Instructions per nominal CPU cycle: 0.02 => corresponds to 0.40 % core utilization over time interval
KUTrace
KUtrace is a low-overhead Linux kernel tracing facility for observing and visualizing all the execution time on all cores of a multi-core processor.
Physical Memory (RAM)
Query memory information:
$ cat /proc/meminfo
MemTotal:       15943596 kB
MemFree:         4772348 kB
Buffers:          305280 kB
Cached:          8222008 kB
Slab:             369028 kB
AnonPages:       5397004 kB...
On newer versions of Linux, use the "Available" statistics to determine the approximate amount of RAM that's available for use for programs:
Many load balancing and workload placing programs check /proc/meminfo to estimate how much free memory is available. They generally do this by adding up "free" and "cached", which was fine ten years ago, but is pretty much guaranteed to be wrong today. It is wrong because Cached includes memory that is not freeable as page cache, for example shared memory segments, tmpfs, and ramfs, and it does not include reclaimable slab memory, which can take up a large fraction of system memory on mostly idle systems with lots of files. Currently, the amount of memory that is available for a new workload, without pushing the system into swap, can be estimated from MemFree, Active(file), Inactive(file), and SReclaimable, as well as the "low" watermarks from /proc/zoneinfo. However, this may change in the future, and user space really should not be expected to know kernel internals to come up with an estimate for the amount of free memory. It is more convenient to provide such an estimate in /proc/meminfo. If things change in the future, we only have to change it in one place.
Notes:
- Physical memory used ~= MemTotal - MemFree - Buffers - Cached
- AnonPages ~= The sum total of virtual memory allocations (e.g.
malloc, mmap, etc.) by currently running processes. This is roughly
equivalent to summing the RSS column in $(ps -eww -o pid,rss) (although
RSS pages reported in $(ps) may be shared across processes):
$ ps -eww -o pid,rss | tail -n+2 | awk '{print $2}' | paste -sd+ | bc
lsmem provides detailed information on memory. For
example:
lsmem
RANGE                                  SIZE  STATE REMOVABLE BLOCK
0x0000000000000000-0x0000000007ffffff  128M online        no     0
0x0000000008000000-0x000000006fffffff  1.6G online       yes  1-13
0x0000000070000000-0x0000000097ffffff  640M online        no 14-18
0x0000000098000000-0x00000000a7ffffff  256M online       yes 19-20
0x00000000a8000000-0x00000000bfffffff  384M online        no 21-23
0x0000000100000000-0x00000001bfffffff    3G online        no 32-55
0x00000001c0000000-0x00000001c7ffffff  128M online       yes    56
0x00000001c8000000-0x00000001dfffffff  384M online        no 57-59
0x00000001e0000000-0x00000001efffffff  256M online       yes 60-61
0x00000001f0000000-0x000000023fffffff  1.3G online        no 62-71

Memory block size:       128M
Total online memory:       8G
Total offline memory:      0B
Per-process Memory Usage
Use the ps command to show the resident and virtual sizes of a process:
$ ps -eww -o pid,rss,vsz,command
  PID   RSS    VSZ COMMAND
32665 232404 4777744 java ... server1
Resident memory pages may be shared across processes. The file /proc/$PID/smaps includes a "Pss" line for each virtual memory area which is the proportional set size, which is a subset of RSS, and tries to take into account shared resident pages.
tmpfs
Filesystems mounted with tmpfs
consume RAM and/or swap. Use df to view size and usage. For
example:
$ df -ht tmpfs
Filesystem      Size  Used Avail Use% Mounted on
tmpfs           2.0G     0  2.0G   0% /dev/shm
tmpfs           785M  1.3M  784M   1% /run
tmpfs           2.0G   16K  2.0G   1% /tmp
tmpfs           393M  144K  393M   1% /run/user/1000
Also view Shmem in /proc/meminfo.
Some distributions mount /tmp on tmpfs and programs
using a lot of space in /tmp may drive RAM usage. In
general, such applications should use
/var/tmp instead. A common way to disable this
/tmp tmpfs mount is to run
sudo systemctl mask tmp.mount and reboot.
Memory in cgroups
- cgroups v1:
cat /sys/fs/cgroup/cpu/$SLICE/$SCOPE/memory.stat - cgroups v2:
cat /sys/fs/cgroup/$SLICE/$SCOPE/memory.stat
Memory Pressure
Recent versions of Linux include Pressure
Stall Information (PSI) statistics to better understand memory
pressure and constraints. For example, in
/proc/pressure/memory (or memory.pressure in
cgroups):
cat /proc/pressure/memory
some avg10=0.00 avg60=0.00 avg300=0.00 total=0
full avg10=0.00 avg60=0.00 avg300=0.00 total=0
The "some" line indicates the share of time in which at least some tasks are stalled on a given resource.
The "full" line indicates the share of time in which all non-idle tasks are stalled on a given resource simultaneously. In this state actual CPU cycles are going to waste, and a workload that spends extended time in this state is considered to be thrashing. This has severe impact on performance, and it's useful to distinguish this situation from a state where some tasks are stalled but the CPU is still doing productive work. As such, time spent in this subset of the stall state is tracked separately and exported in the "full" averages.
The ratios (in %) are tracked as recent trends over ten, sixty, and three hundred second windows, which gives insight into short term events as well as medium and long term trends. The total absolute stall time (in us) is tracked and exported as well, to allow detection of latency spikes which wouldn't necessarily make a dent in the time averages, or to average trends over custom time frames.
free
Query physical memory usage:
$ free -m
             total       used       free     shared    buffers     cached
Mem:         15569      10888       4681          0        298       8029
-/+ buffers/cache:       2561      13008
Swap:            0          0          0
In general, you want to look at the "-/+ buffers/cache" line because buffers and cache are not program memory.
/proc/meminfo
/proc/meminfo
provides information about memory.
Example (only showing first few lines):
$ cat /proc/meminfo
MemTotal:       10185492 kB
MemFree:         6849096 kB
MemAvailable:    9621568 kB
Buffers:            1980 kB
Cached:          2960552 kB
[...]
Review the MemAvailable line To find how much memory is
available if needed:
Paging
When the physical memory is full, paging (also known as swapping) occurs to provide additional memory. Paging consists of writing the contents of physical memory to disk, making the physical memory available for use by applications. The least recently used information is moved first. Paging is expensive in terms of performance because, when required information is stored on disk it must be loaded back into physical memory, which is a slow process.
Where paging occurs, Java applications are impacted because of garbage collection. Garbage collection requires every part of the Java heap to be read. If any of the Java heap has been paged out, it must be paged back when garbage collection runs, slowing down the garbage collection process.
The vmstat output shows whether paging was taking place when the problem occurred. vmstat output has the following format:
procs -----------memory----------  ---swap--  -----io---- --system-- ----cpu----
  r  b   swpd   free    buff   cache   si   so    bi    bo   in    cs us sy  id wa
  0  0  17196 679860 1196656 2594884    0    0     1     4    0     0  0  0 100  0
  0  0  17196 679868 1196656 2594884    0    0     0    40 1012    43  0  0 100  0
  0  0  17196 679992 1196656 2594884    0    0     0     3 1004    43  0  0 100  0
The columns of interest are... si and so (swap in and swap out) columns for Linux. Nonzero values indicate that paging is taking place.
What is swapped out?
Search for largest values:
$ free -h &>> diag_swap_$(hostname)_$(date +%Y%m%d).txt
$ for pidfile in /proc/[0-9]*/status; do echo $pidfile &>> diag_swap_$(hostname)_$(date +%Y%m%d).txt; awk '/VmSwap|Name/' $pidfile &>> diag_swap_$(hostname)_$(date +%Y%m%d).txt; done
Shared Memory
It may be necessary to tune the kernel's shared memory configuration for products such as databases.
- /proc/sys/kernel/shmall: The maximum amount of shared memory for the kernel to allocate.
- /proc/sys/kernel/shmmax: The maximum size of any one shared memory segment.
- /proc/sys/kernel/shmmni: The maximum number of shared memory segments.
For example, set kernel.shmmax=1073741824 in
/etc/sysctl.conf and apply with sysctl -p.
Address Space Layout Randomization
Address space layout randomization (ASLR) is a feature of some kernels to randomize virtual address space locations of various program allocations. This is an anti-hacking security feature although it may cause unintuitive and random performance perturbations. For testing/benchmarking, you may see if this is the case by disabling it temporarily:
echo 0 | sudo tee /proc/sys/kernel/randomize_va_spaceAlternatively, ASLR may be disabled on a per-process basis with setarch -R.
NUMA
NUMA stands for Non-Uniform Memory Access which means that RAM is split into multiple nodes, each of which is local to particular sets of CPUs with slower, "remote" access for other CPUs.
The numactl
command provides various utilities such as displaying NUMA layout:
$ numactl --hardware
available: 1 nodes (0)
node 0 cpus: 0 1 2 3 4 5 6 7
node 0 size: 16000 MB
node 0 free: 4306 MB
node distances:
node   0
  0:  10
A process may be started on a particular NUMA node with
numactl -m $NODE ... or processes may be pinned to the CPUs
connected to that node with taskset.
Display the current NUMA
mappings per process with cat /proc/$PID/numa_maps. To
print memory usage by NUMA node:
awk '/N[0-9]+=[0-9]+/ { for (i=1; i<=NF; i++) { if ($i ~ /N[0-9]+=[0-9]+/) { split($i, pieces, /=/); pages[pieces[1]] += pieces[2]; } }} END { for (node in pages) { printf("Node %s = %d bytes\n", node, pages[node]*1024);} }' numa_mapsThe numastat
command (in the package numactl)
shows if memory was allocated to foreign nodes despite a process
preferring its local node. This isn't exactly remote accesses but it
could be interesting. You can just run this once for the whole node
(numastat), and then once for one or more processes
(numstat -p $PID).
If testing can be done, a relatively lower IPC when processes are unpinned to nodes suggests slower, remote memory access.
It may be worth testing disabling automatic NUMA
balancing and page
migration between NUMA nodes
(echo 0 > /proc/sys/kernel/numa_balancing) and disable
numad if running.
On Intel CPUs, Intel provides NumaTOP to investigate NUMA accesses.
On Intel CPUs, Intel provides the PCM tool suite with a tool
called pcm-numa which shows remote RAM access per chip
(Remote DRAM Accesses). For example:
Update every 1.0 seconds
Time elapsed: 1004 ms
Core | IPC  | Instructions | Cycles  |  Local DRAM accesses | Remote DRAM Accesses
   0   0.60         45 M       75 M       188 K                   129 K
   1   0.66       7256 K       10 M      4724                      25 K
   2   0.26       1185 K     4647 K       288                    7177
[...]
Intel also provides the Memory Latency Checker to review NUMA-related latencies.
The pmrep
tool from RedHat shows remote% per second which is
"where the processor that triggered the hinting page fault and the
memory it referred to are on different NUMA nodes". Hinting page faults
aren't directly remote memory accesses; instead, they're related to the
kernel's monitoring of whether or not to migrate memory chunks, so it's
a subset of memory accesses, but if remote% spikes during issues, that
could be a good hint. This might only work if NUMA rebalancing is
enabled.
GLIBC malloc
In recent kernels, the text is at the bottom, stack at the top, and mmap/heap sections grow towards each other in a shared space (although they cannot overlap). By default, the malloc implementation in glibc (which was based on ptmalloc, which in turn was based on dlmalloc) will allocate into either the native heap (sbrk) or mmap space, based on various heuristics and thresholds: If there's enough free space in the native heap, allocate there. Otherwise, if the allocation size is greater than some threshold (slides between 128KB and 32/64MB based on various factors), allocate a private, anonymous mmap instead of native heap (mmap isn't limited by ulimit -d).
In the raw call of sbrk versus mmap,
mmap is slower because it must zero
the range of bytes.
MALLOC_ARENA_MAX
Starting with glibc 2.11 (for example, customers upgrading from RHEL
5 to RHEL 6), by default, when glibc malloc detects mutex contention
(i.e. concurrent mallocs), then the native malloc heap is broken up into
sub-pools called arenas. This is achieved by assigning threads their own
memory pools and by avoiding locking in some situations. The amount of
additional memory used for the memory pools (if any) can be controlled
using the environment variables MALLOC_ARENA_TEST and
MALLOC_ARENA_MAX. MALLOC_ARENA_TEST specifies
that a test for the number of cores is performed once the number of
memory pools reaches this value. MALLOC_ARENA_MAX sets the
maximum number of memory pools used, regardless of the number of
cores.
The default maximum arena size is 1MB on 32-bit and 64MB on 64-bit. The default maximum number of arenas is the number of cores multiplied by 2 for 32-bit and 8 for 64-bit.
This can increase fragmentation because the free trees are separate.
In principle, the net performance impact should be positive of per thread arenas, but testing different arena numbers and sizes may result in performance improvements depending on your workload.
You can revert the arena behavior with the environment variable
MALLOC_ARENA_MAX=1.
OOM Killer
If /proc/sys/vm/overcommit_memory
is set to 0 (the default), then the Linux kernel will allow memory
overcommit. If RAM and swap space become exhausted, the Linux
oom-killer will send a SIGKILL (9) signal to processes until sufficient
space is freed:
By default, Linux follows an optimistic memory allocation strategy. This means that when malloc() returns non-NULL there is no guarantee that the memory really is available. In case it turns out that the system is out of memory, one or more processes will be killed by the OOM killer.
The SIGKILL signal cannot be caught, blocked, or ignored by processes, and no process core dump is produced.
If /proc/sys/vm/panic_on_oom is set to 1, then a kernel
panic will be produced when the OOM killer is triggered and the system
is rebooted. Creating a dump on a panic requires configuring kdump.
The kernel decides which process to kill based on various heuristics
and per-process configuration (section 3.1). A process may be
excluded from the oom-killer by setting its oom_score_adj
to -1000:
$ echo -1000 > /proc/${PID}/oom_score_adjThe OOM killer may be disabled. For example, set
vm.overcommit_memory=2 and
vm.overcommit_ratio=100 in /etc/sysctl.conf
and apply with sysctl -p. In this case, malloc will return
NULL when there is no memory and available. Many workloads can't support
such configurations because of high virtual memory allocations.
OOM Killer Message
When the OOM killer is invoked, a message is written to the kernel log. For example:
kernel: Out of memory: Kill process 20502 (java) score 296 or sacrifice child
kernel: Killed process 20502 (java), UID 1006, total-vm:14053620kB, anon-rss:10256240kB, file-rss:0kB, shmem-rss:0kB
The total and free swap usage at the time is also included. For example:
kernel: Free swap  = 0kB
kernel: Total swap = 2001916kB
By default (vm.oom_dump_tasks = 1), a list of all tasks and their memory usage is included. In general, resolve the OOM issue by searching for the processes with the largest RSS values. For example:
kernel: [ pid ]   uid  tgid total_vm      rss nr_ptes swapents oom_score_adj name
kernel: [16359]  1006 16359  3479474  2493182    5775    13455             0 java
kernel: [20502]  1006 20502  3513405  2564060    6001     8788             0 java
kernel: [25415]  1006 25415  3420281  2517763    5890    15640             0 java
kernel: [ 1984]     0  1984  3512173   115259     908    81569             0 jsvc
[...]
In the process list, the information is retreived
through each PID's task_struct
and its mm field (mm_struct).
The important statistic in the task dump is rss (resident
set size) which is calculated by get_mm_rss
that calls get_mm_counter
through the rss_stat (mm_rss_stat)
field of mm for MM_FILEPAGES,
MM_ANONPAGES, and MM_SHMEMPAGES which are
page counts.
Therefore, multiply by the page size (getconf PAGESIZE)
to convert rss to bytes. The page size is CPU architecture
specific. A common
PAGE_SIZE is 4KB.
EarlyOOM
EarlyOOM is a user-space memory watcher tool that proactively kills memory-hungry processes when the system is dangerously low on free computational memory (unlike the kernel's OOM killer which only kills memory-hungry processes when the system is absolutely exhausted).
EarlyOOM is enabled by default starting with Fedora 33.
It may be disabled with
sudo systemctl stop earlyoom.service && sudo systemctl disable earlyoom.service
File cache
/proc/sys/vm/swappiness
The default value of /proc/sys/vm/swappiness
is 60:
This control is used to define how aggressive the kernel will swap memory pages. Higher values will increase aggressiveness, lower values decrease the amount of swap. The default value is 60.
swappiness, is a parameter which sets the kernel's balance between reclaiming pages from the page cache and swapping out process memory. The reclaim code works (in a very simplified way) by calculating a few numbers:
- The "distress" value is a measure of how much trouble the kernel is having freeing memory. The first time the kernel decides it needs to start reclaiming pages, distress will be zero; if more attempts are required, that value goes up, approaching a high value of 100.
- mapped_ratio is an approximate percentage of how much of the system's total memory is mapped (i.e. is part of a process's address space) within a given memory zone.
- vm_swappiness is the swappiness parameter, which is set to 60 by default.
With those numbers in hand, the kernel calculates its "swap tendency":
swap_tendency = mapped_ratio/2 + distress + vm_swappiness;
If swap_tendency is below 100, the kernel will only reclaim page cache pages. Once it goes above that value, however, pages which are part of some process's address space will also be considered for reclaim. So, if life is easy, swappiness is set to 60, and distress is zero, the system will not swap process memory until it reaches 80% of the total. Users who would like to never see application memory swapped out can set swappiness to zero; that setting will cause the kernel to ignore process memory until the distress value gets quite high.
A value of 0 tells the kernel to avoid paging program pages to disk as much as possible. A value of 100 encourages the kernel to page program pages to disk even if filecache pages could be removed to make space.
Note that this value is not a percentage of physical memory, but as the above example notes, it is a variable in a function. If distress is low and the default swappiness of 60 is set, then program pages may start to be paged out when physical memory exceeds 80% usage (where usage is defined as usage by program pages). Which is to say, by default, if your programs use more than 80% of physical memory, the least used pages in excess of that will be paged out.
This may be adversely affecting you if you see page outs but filecache is non-zero. For example, in vmstat, if the "so" column is non-zero (you are paging out) and the "cache" column is a large proportion of physical memory, then the kernel is avoiding pushing those filecache pages out as much as it can and instead paging program pages. In this case, either reduce the swappiness or increase the physical memory. This assumes the physical memory demands are expected and there is no leak.
In general, for Java-based workloads which have light disk file I/O, set vm.swappiness=0 in /etc/sysctl.conf and apply with sysctl -p.
Note that recent versions of the Linux kernel (generally >= 3.5) have made vm.swappiness=0 more aggressive in avoiding swapping out anonymous pages. Some prefer to use vm.swappiness=1 to retain the old behavior of a slight preference for some swapping of anonymous pages under memory pressure. For the purposes of the above recommendations for Java-based workloads which have light disk file I/O, it's preferable to set vm.swappiness=0.
Kernel memory and slab
In addition to filecache discussed above, the kernel may have other
caches such as slab (which can be driven by application behavior). The
/proc/slabinfo and slabtop program may be used
to investigate slab usage as well as per-cgroup statistics such as
slab_reclaimable/slab_unreclaimable in
memory.stat.
In general, it is not necessary to tune reclaimable filecache and slab buffers on Linux as they can be reclaimed automatically:
free slab objects and pagecache [...] are automatically reclaimed by the kernel when memory is needed elsewhere on the system
It is by design that Linux aggressively uses free RAM for caches but if programs demand memory, then the caches can be quickly dropped.
In addition to vm.swappiness for filecache discussed in
the previous section, additional tuning that may be applied includes
vm.vfs_cache_pressure, vm.min_slab_ratio, and
vm.min_free_kbytes.
Free caches may be manually dropped (for example, at the start of a performance test), although this is generally not recommended:
- Flush free filecache:
sysctl -w vm.drop_caches=1 - Flush free reclaimable slab (e.g. inodes, dentries):
sysctl -w vm.drop_caches=2 - Flush both free filecache and free reclaimable slab:
sysctl -w vm.drop_caches=3
To investigate
the drivers of slab, use eBPF trace on
t:kmem:kmem_cache_alloc. For example:
$ /usr/share/bcc/tools/trace -K 't:kmem:kmem_cache_alloc'
PID     TID     COMM            FUNC
9120    9120    kworker/0:2     kmem_cache_alloc
        b'kmem_cache_alloc+0x1a8 [kernel]'
        b'kmem_cache_alloc+0x1a8 [kernel]'
        b'__d_alloc+0x22 [kernel]' [...]
pdflush
The pdflush process writes dirty file page cache entries to disk asynchronously.
/proc/sys/vm/dirty_writeback_centisecs controls the frequency pdflush awakes and /proc/sys/vm/dirty_expire_centiseconds controls the threshold at which a dirty page is judged that it needs to be written by a run of pdflush (or if memory is low, judged with /proc/sys/vm/dirty_background_ratio). If the total size of dirty pages as a proportion of physical memory exceeds /proc/sys/vm/dirty_ratio, processes write to disk synchronously.
If system I/O activity is heavy but bursty and this causes problems, consider reducing the above variables, first starting with dirty_background_ratio (e.g. 3), followed by dirty_ratio (e.g. 15), followed by dirty_expire_centiseconds (e.g. 500), followed by dirty_writeback_centisecs (e.g. 100).
For example, set vm.dirty_background_ratio=3 in /etc/sysctl.conf and apply with sysctl -p
Zero Swap Space
While there is considerable philosophical debate about swap, consider disabling swap, setting vm.panic_on_oom=1, and configuring kernel vmcore dumps with process-level virtual address space information to avoid swap thrashing situations and reduce downtime, whilst analyzing post-mortem vmcores for excessive memory usage, leaks, or undersizing.
To disable swap, use $(swapoff -a) to immediately disable swap partitions, and then remove any swap partitions from /etc/fstab for future reboots.
Example of configuring kdump on RHEL:
- Configure, start, and enable the crash
kernel/kdump
- Size the amount of RAM for the crash kernel
- Change /etc/kdump.conf to ensure makedumpfile uses
-d 23,31so that process virtual address space information is dumped for each user process (command line arguments, virtual memory, etc.).
- Set vm.panic_on_oom=1 in /etc/sysctl.conf
- Install the kernel and glibc symbols
- Install the
crashutility- Test it out (perhaps with
kernel.sysrq=1and/proc/sysrq-trigger) and learn how to use it:crash /usr/lib/debug/lib/modules/*/vmlinux /var/crash/*/vmcore
- Test it out (perhaps with
Kernel Samepage Merging
Test disabling kernel samepage merging:
echo 0 > /sys/kernel/mm/ksm/runInput/Output (I/O)
Unless tracking file and directory access times is required, use the
noatime and nodiratime flags (or consider
relatime) when mounting
filesystems to remove unnecessary disk activity.
Query disk usage:
$ df -h
Filesystem                       Size  Used Avail Use% Mounted on
/dev/mapper/vg_lifeboat-lv_root  385G  352G   14G  97% /
tmpfs                            7.7G  628K  7.7G   1% /dev/shm
/dev/sda1                        485M   97M  363M  22% /boot
Query filesystem information:
$ stat -f /
  File: "/"
    ID: 2975a4f407cfa7e5 Namelen: 255     Type: ext2/ext3
Block size: 4096       Fundamental block size: 4096
Blocks: Total: 100793308  Free: 8616265    Available: 3496265
Inodes: Total: 25600000   Free: 20948943
Query disk utilization:
$ iostat -xm 5 2
Linux 2.6.32-358.11.1.el6.x86_64 (oc2613817758.ibm.com)     02/07/2014     _x86_64_    (8 CPU)

avg-cpu:  %user   %nice %system %iowait  %steal   %idle
           1.17    0.00    0.55    0.25    0.00   98.03

Device:         rrqm/s   wrqm/s     r/s     w/s    rMB/s    wMB/s avgrq-sz avgqu-sz   await  svctm  %util
sda               0.17    17.13    1.49    3.63     0.05     0.08    50.69     0.13   26.23   3.98   2.03
dm-0              0.00     0.00    1.48   20.74     0.05     0.08    11.59     7.46  335.73   0.92   2.05
dm-1              0.00     0.00    1.48   20.57     0.05     0.08    11.68     7.46  338.35   0.93   2.05...
Running iostat in the background:
nohup iostat -xmt 60 > diag_iostat_$(hostname)_$(date +%Y%m%d_%H%M%S).txt &fatrace
If you have high I/O wait times, fatrace
can show which files are being read and written. This could also be done
with something like eBPF but fatrace is much simpler. It was created by
the Ubuntu team but is also available in other Linux distributions (e.g.
Red
Hat).
Start:
nohup sudo fatrace -t -f CROW -o diag_fatrace_$(hostname)_$(date +%Y%m%d_%H%M%S).txt &Stop:
sudo pkill -INT fatraceExample output:
14:47:03.106836 java(1535): O /etc/hosts
14:47:03.106963 java(1535): R /etc/hosts
fuser
fuser
shows processes reading/writing a particular path. For example:
# /usr/sbin/fuser -a -v -u /opt/IBM/WebSphere/AppServer/profiles/AppSrv01/logs/server1/SystemOut.log
                     USER        PID ACCESS COMMAND
/opt/IBM/WebSphere/AppServer/profiles/AppSrv01/logs/server1/SystemOut.log:
                     was        1517 F.... (was)java
                     was        1674 f.... (was)tail
iotop
iotop is a top-like tool to understand file I/O by PID.
The command may be run in interactive mode or in batch mode as in the example below. Note that output is not sorted by I/O rates.
$ sudo iotop -bot -d 10
    TIME    TID  PRIO  USER      DISK READ  DISK WRITE  SWAPIN      IO    COMMAND
06:50:41 Total DISK READ:        28.75 M/s | Total DISK WRITE:         8.19 M/s
06:50:41 Current DISK READ:      28.75 M/s | Current DISK WRITE:      10.97 M/s
    TIME    TID  PRIO  USER        DISK READ  DISK WRITE  SWAPIN      IO    COMMAND
b'06:50:41     130 be/4 root     1633.01 B/s   15.95 K/s  ?unavailable?  [kworker/u12:1-btrfs-endio]'
b'06:50:41     147 be/4 root        0.00 B/s    9.57 K/s  ?unavailable?  [kworker/u12:3-btrfs-endio-write]'
b'06:50:41     157 be/4 root        0.00 B/s    3.19 K/s  ?unavailable?  [kworker/u12:6-btrfs-worker]'
b'06:50:41     477 be/4 root        0.00 B/s  400.28 K/s  ?unavailable?  [btrfs-transacti]'
b'06:50:41    2562 be/4 root        4.78 K/s    7.75 M/s  ?unavailable?  packagekitd [PK-Backend]'
b'06:50:41    2333 be/4 root        3.19 K/s   13.56 K/s  ?unavailable?  [kworker/u12:9-blkcg_punt_bio]'
b'06:50:41    2334 be/4 root        0.00 B/s 1633.01 B/s  ?unavailable?  [kworker/u12:10-btrfs-endio-meta]'
b'06:50:41    2335 be/4 root        0.00 B/s    7.97 K/s  ?unavailable?  [kworker/u12:11-btrfs-endio-write]'
b'06:50:41    2555 be/4 user1      28.74 M/s    0.00 B/s  ?unavailable?  tar czvf /tmp/test.tar.gz /'
06:50:51 Total DISK READ:        27.94 M/s | Total DISK WRITE:         6.66 M/s
06:50:51 Current DISK READ:      27.94 M/s | Current DISK WRITE:       5.42 M/s
    TIME    TID  PRIO  USER        DISK READ  DISK WRITE  SWAPIN      IO    COMMAND
b'06:50:51     130 be/4 root        0.00 B/s  242.81 K/s  ?unavailable?  [kworker/u12:1-btrfs-endio-write]'
b'06:50:51     147 be/4 root        0.00 B/s   14.35 K/s  ?unavailable?  [kworker/u12:3-btrfs-endio]'
b'06:50:51     157 be/4 root        0.00 B/s  140.35 K/s  ?unavailable?  [kworker/u12:6-btrfs-endio-write]'
b'06:50:51     585 be/4 root        0.00 B/s   15.55 K/s  ?unavailable?  systemd-journald'
b'06:50:51    2562 be/4 root     1224.83 B/s    6.09 M/s  ?unavailable?  packagekitd [PK-Backend]'
b'06:50:51    2333 be/4 root        0.00 B/s   46.65 K/s  ?unavailable?  [kworker/u12:9-btrfs-endio]'
b'06:50:51    2334 be/4 root        0.00 B/s  114.83 K/s  ?unavailable?  [kworker/u12:10-btrfs-endio-write]'
b'06:50:51    2335 be/4 root        0.00 B/s    7.97 K/s  ?unavailable?  [kworker/u12:11-btrfs-endio-write]'
b'06:50:51    2555 be/4 user1      27.94 M/s    0.00 B/s  ?unavailable?  tar czvf /tmp/test.tar.gz /'
dstat
dstat (covered above) may be used to monitor I/O. For example:
$ dstat -pcmrd

---procs--- ----total-usage---- ------memory-usage----- --io/total- -dsk/total-
run blk new|usr sys idl wai stl| used  free  buf   cach| read  writ| read  writ
 32   0   0| 27  73   0   0   0|2232M  249G   61M  568M|11.1M    0 |  42G    0
 33   0   0| 27  73   0   0   0|2232M  249G   61M  568M|11.1M    0 |  42G    0
ioping
ioping
shows diagnostics for a particular device.
Flushing and Writing Statistics
The amount of bytes pending to be written to all devices may be queried with Dirty and Writeback in /proc/meminfo; for example:
$ grep -e Dirty -e Writeback /proc/meminfo
Dirty:                 8 kB
Writeback:             0 kB
WritebackTmp:          0 kB
A tool such as $(watch) may be used to show a refreshing screen.
Details on a per-device
basis may be queried in /sys/block/*/stat
For example:
$ for i in /sys/block/*/stat; do echo $i; awk '{print $9}' $i; done
/sys/block/sda/stat
0
/sys/block/sdb/stat
0
dd
dd
may be used for various disk tasks.
Create a ramdisk with a testfile for subsequent tests:
mkdir /tmp/ramdisk
mount -t tmpfs -o size=1024m tmpfs /tmp/ramdisk
time dd if=/dev/urandom of=/tmp/ramdisk/play bs=1M count=1024 status=progress
Test write speed of the disk at /opt/disk1:
sudo sync
time dd if=/tmp/ramdisk/play of=/opt/disk1/play bs=1M count=1024 oflag=dsync status=progress
Test read speed of the disk at /opt/disk1:
echo 3 | sudo tee /proc/sys/vm/drop_caches
dd if=/opt/disk1/play of=/dev/null bs=1M count=1024 status=progress
ncdu
ncdu
provides a recursive tree view of disk usage. For example:
ncdu 1.15.1 ~ Use the arrow keys to navigate, press ? for help
--- /opt/IBM/WebSphere/AppServer -----------------------------
  532.3 MiB [##########] /profiles
  334.0 MiB [######    ] /runtimes
  265.6 MiB [####      ] /plugins
  238.9 MiB [####      ] /deploytool
  233.5 MiB [####      ] /java
hdparm
hdparm
may be used to benchmark the performance of a disk. For example:
hdparm -Tt /dev/sda- Review settings such as readahead:
sudo hdparm /dev/nvme0n1 - Change settings such as disabling readahead:
sudo hdparm -a 0 /dev/nvme0n1
bonnie++
bonnie++
may be used to benchmark the performance of a disk.
parted
parted
lists drive partitions. For example:
parted /dev print allblkid
blkid
lists partition details.
blkid
lsblk
lists partition details. For example:
lsblk -f -mfdisk
fdisk
lists disk devices. For example:
fdisk -lfio
fio may be used to test disk I/O performance. For example:
$ fio --readonly --name=onessd \
      --filename=/dev/nvme0n1 \
      --filesize=100g --rw=randread --bs=4k --direct=1 --overwrite=0 \
      --numjobs=3 --iodepth=32 --time_based=1 --runtime=3600 \
      --ioengine=io_uring \
      --registerfiles --fixedbufs \
      --gtod_reduce=1 --group_reporting
I/O schedulers
- Show current scheduler:
grep . /sys/class/block/nvme*n1/queue/scheduler - Change current scheduler (e.g. Multi-Queue deadline):
echo mq-deadline | sudo tee -a /sys/class/block/nvme0n1/queue/scheduler
Solid State Drives
Solid State Drives (SSDs) include NVMe (Non-Volatile Memory Express) drives over PCI Express.
NVMe
- List drives:
sudo nvme list - Ensure PCIi link speed is set to the maximum in BIOS
- Show maximum link speed:
sudo lspci -vand search for "Physical Layer"
Networking
ip
ip is a tool to query and modify network interfaces.
Common sub-commands:
Common options:
ip addr: Display network interfacesip route: Routing tableip route get 10.20.30.100: Get the next hop to 10.20.30.100ip -s -h link show eth0: General interface informationip -s link: Transfer statistics
Permanent network interface changes
NetworkManager dispatcher scripts
If using NetworkManager, dispatcher scripts may be used to apply changes when the interface comes up. For example:
- As root, create
/etc/NetworkManager/dispatcher.d/30-linkup:#!/bin/sh if [ "$1" == "eth0" ] && [ "$2" == "up" ]; then ip route change [...] quickack 1 elif [ "$1" == "eth1" ] && [ "$2" == "up" ]; then ip route change [...] quickack 1 fi chmod +x /etc/NetworkManager/dispatcher.d/30-linkup- Reboot and check
ip route show
mtr
mtr
combines the functionality of ping and
traceroute to provide statistics on network latency and
potential packet loss. For example:
$ mtr --report-wide --show-ips --aslookup --report-cycles 30 example.com
Start: 2024-02-13T09:22:51-0600
HOST: kgibm                                                                Loss%   Snt   Last   Avg  Best  Wrst StDev
  1. AS???    dsldevice.attlocal.net (192.168.1.254)                        0.0%    30    1.1   1.3   0.8   5.5   0.8
  2. AS1234   a.example.com (203.0.113.1)                                   0.0%    30    2.3   2.1   1.4   3.4   0.4
  3. AS???    203.0.113.2                                                   0.0%    30    2.2   2.2   1.9   3.1   0.2
  4. AS???    ???                                                          100.0    30    0.0   0.0   0.0   0.0   0.0
  5. AS???    203.0.113.3                                                   0.0%    30    7.5   7.6   6.9   8.4   0.3
  6. AS1234   203.0.113.4                                                   0.0%    30   10.4  10.2   9.4  11.9   0.5
  7. AS12345  b.example.com (203.0.113.5)                                   0.0%    30   10.6  10.1   9.3  11.4   0.5
  8. AS???    ???                                                          100.0    30    0.0   0.0   0.0   0.0   0.0
  9. AS12345  c.example.com (203.0.113.6)                                  10.0%    30   10.5  10.4   9.9  12.2   0.5
 10. AS123456 203.0.113.7                                                   0.0%    30   10.0  10.0   9.2  11.9   0.5
The Avg, Wrst, and StDev are
useful gauges of network latencies.
Be careful interpreting
the Loss% column:
To determine if the loss you’re seeing is real or due to rate limiting, take a look at the subsequent hop. If that hop shows a loss of 0.0%, then you are likely seeing ICMP rate limiting and not actual loss. [...] When different amounts of loss are reported, always trust the reports from later hops.
In the above example, since the final hop has a Loss% of
0.0%, then there is no packet loss detected.
In addition, it's important to gather mtr in both
directions at the same time, if possible:
Some loss can also be explained by problems in the return route. Packets will reach their destination without error but have a hard time making the return trip. For this reason, it is often best to collect MTR reports in both directions when you’re experiencing an issue.
In other words, if you are running mtr targeting
example.com from some workstation, then, if possible, you
should remote into that server (in this example,
example.com) and perform the same mtr command
at the same time, targeting your workstation in the reverse direction.
If the Loss% of the last hop of both mtr
outputs is approximately the same, then the packet loss could simply be
on the path to your workstation rather than the target.
ping
ping sends ICMP packets to a destination to test basic speed. For example:
$ ping -c 4 -n 10.20.30.1
PING 10.20.30.1 (10.20.30.1) 56(84) bytes of data.
64 bytes from 10.20.30.1: icmp_seq=1 ttl=250 time=112 ms
64 bytes from 10.20.30.1: icmp_seq=2 ttl=250 time=136 ms
64 bytes from 10.20.30.1: icmp_seq=3 ttl=250 time=93.8 ms
64 bytes from 10.20.30.1: icmp_seq=4 ttl=250 time=91.6 ms
In general, and particularly for LANs, ping times should be less than a few hundred milliseconds with little standard deviation.
dig
dig tests DNS resolution time. Examples:
dig -4 example.com: Use the configured resolversdig -4 @1.1.1.1 example.com: Use a specific DNS resolverdig -4 +dnssec +multi example.com: Check DNSSEC
ss
ss is a tool to investigate sockets.
ss summary
The summary option prints statistics about sockets:
$ ss --summary
Total: 559
TCP:   57 (estab 2, closed 21, orphaned 0, timewait 0)

Transport Total       IP        IPv6
RAW          0         0           0
UDP          0         0           0
TCP         36        31           5
INET        36        31           5
FRAG         0         0           0
ss basic usage
ss with -amponet prints details about each socket (simlar to the obsolete netstat command plus more details):
$ ss -amponet
State Recv-Q Send-Q Local Address:Port Peer Address:Port
LISTEN 0 128 0.0.0.0:9080 0.0.0.0:* users:(("java",pid=17,fd=159)) uid:1001 ino:6396895 sk:15a <-> skmem:(r0,rb87380,t0,tb16384,f0,w0,o0,bl0,d0)
ESTAB 0 0 127.0.0.1:389 127.0.0.1:41116 timer:(keepalive,66min,0) ino:6400030 sk:1 <-> skmem:(r0,rb1062000,t0,tb2626560,f0,w0,o0,bl0,d0)
ESTAB 0 0 127.0.0.1:41116 127.0.0.1:389 users:(("java",pid=17,fd=187)) uid:1001 ino:6395839 sk:2 <-> skmem:(r0,rb1061808,t0,tb2626560,f0,w0,o0,bl0,d0)
Add the -i flag to print detailed kernel statistics:
$ ss -amponeti
State Recv-Q Send-Q Local Address:Port Peer Address:Port
LISTEN 0 128 0.0.0.0:9080 0.0.0.0:* users:(("java",pid=17,fd=159)) uid:1001 ino:6396895 sk:15a <-> skmem:(r0,rb87380,t0,tb16384,f0,w0,o0,bl0,d0) cubic rto:1000 mss:536 cwnd:10 lastsnd:1009912410 lastrcv:1009912410 lastack:1009912410
ESTAB 0 0 127.0.0.1:389 127.0.0.1:41116 timer:(keepalive,64min,0) ino:6400030 sk:1 <-> skmem:(r0,rb1062000,t0,tb2626560,f0,w0,o0,bl0,d0) ts sack cubic wscale:7,7 rto:210 rtt:0.393/0.687 ato:40 mss:21888 pmtu:65535 rcvmss:536 advmss:65483 cwnd:10 bytes_acked:14 bytes_received:51 segs_out:2 segs_in:4 data_segs_out:1 data_segs_in:1 send 4455572519bps lastsnd:3321860 lastrcv:3321860 lastack:3321860 pacing_rate 8902650136bps delivery_rate 64376464bps app_limited rcv_space:43690 rcv_ssthresh:43690 minrtt:0.061
ESTAB 0 0 127.0.0.1:41116 127.0.0.1:389 users:(("java",pid=17,fd=187)) uid:1001 ino:6395839 sk:2 <-> skmem:(r0,rb1061808,t0,tb2626560,f0,w0,o0,bl0,d0) ts sack cubic wscale:7,7 rto:210 rtt:0.007/0.004 ato:40 mss:21888 pmtu:65535 rcvmss:536 advmss:65483 cwnd:10 bytes_acked:52 bytes_received:14 segs_out:4 segs_in:3 data_segs_out:1 data_segs_in:1 send 250148571429bps lastsnd:3321860 lastrcv:3321860 lastack:3321860 delivery_rate 58368000000bps app_limited rcv_space:43690 rcv_ssthresh:43690 minrtt:0.003
Newer versions of the command support the -O flag to
print kernel statistics on the same line as each socket:
$ ss -amponetOiss filtering
ss supports filtering on things such as TCP state, port,
etc.:
- Only established sockets:
ss -amponet state established - Only time-wait sockets:
ss -amponet state established - Destination port filtering:
ss -amponet dst :80 - Source port filtering:
ss -amponet src :12345
ss notes
timer:(persist)means the socket has received a zero-window update and is waiting for the peer to advertise a non-zero window.
nstat
nstat is a tool for monitoring network statistics and it's a proposed successor to netstat.
By default, nstat will show statistics with non-zero values since the last time nstat was run, which means that every time it is run, statistics are reset (not in the kernel itself, but in a user-based history file). Example output:
$ nstat
#kernel
IpInReceives                    508                0.0
IpInDelivers                    508                0.0
IpOutRequests                   268                0.0
TcpPassiveOpens                 1                  0.0
TcpInSegs                       508                0.0
If nstat has not been run recently, it may reset its history and the following message is displayed:
nstat: history is stale, ignoring it.The final column is a rate column which is only calculated if the nstat daemon is started (see the "nstat daemon" section below).
Common options:
-a: Dump absolute statistics instead of statistics since the last time nstat was run.-s: Do not include this nstat run in the statistics history (i.e. don't reset the statistics history).-z: Dump all zero values as well (useful for grepping/plotting).
nstat common usage
If you want to handle differencing the absolute values yourself:
nstat -sazTo search for a particular statistic, you can specify it at the end. For example:
nstat -saz TcpRetransSegsIf you want nstat to handle differencing the values for you:
nstat -zIf you want nstat to show you what has increased since last running nstat:
nstatCommon nstat statistics
- TCP retransmissions: TcpRetransSegs, TcpExtTCPSlowStartRetrans, TcpExtTCPSynRetrans
- TCP delayed acknowledgments: TcpExtDelayedACKs
Running nstat in the background
The following will run nstat every 60 seconds and write the output to
diag_nstat_*.txt. If there are errors running the commands
(e.g. permissions), the script will exit immediately and you should
review console output and nohup.out:
nohup sh -c "while true; do date >> diag_nstat_$(hostname).txt || exit 1; nstat -saz >> diag_nstat_$(hostname).txt || exit 1; sleep 60; done" &Stop the collection:
pkill -f "nstat -saz"
nstat daemon
Execute nstat with the following options to start a daemon, where the first number is the period of collection in seconds and the second number is the time interval in seconds to use for the rate calculations:
nstat -d 60 -t 60Then execute nstat again. Example output:
$ nstat
#45776.1804289383 sampling_interval=60 time_const=60
IpInReceives                    1166              45.4
IpInDelivers                    1166              45.4
IpOutRequests                   1025              31.7
TcpActiveOpens                  5                  0.4
TcpInSegs                       1152              44.9
TcpOutSegs                      1042              40.1
TcpOutRsts                      0                  0.1
UdpInDatagrams                  14                 0.5
UdpOutDatagrams                 14                 0.5
TcpExtTW                        13                 0.2
TcpExtDelayedACKs               39                 0.8
TcpExtTCPHPHits                 550               29.3
TcpExtTCPPureAcks               367                6.2
TcpExtTCPHPAcks                 121                5.7
TcpExtTCPRcvCoalesce            211               18.0
TcpExtTCPWantZeroWindowAdv      0                  0.1
TcpExtTCPOrigDataSent           227               17.3
TcpExtTCPKeepAlive              320                5.1
IpExtInOctets                   408933          31441.2
IpExtOutOctets                  144543          19947.3
IpExtInNoECTPkts                1166              45.4
Stopping the nstat daemon:
pkill nstatTCP Keep-Alive
TCP Keep-Alive
periodically sends packets on idle connections to make sure they're
still alive. This feature is disabled by default and must be explicitly
enabled on a per-socket basis (e.g. using setsockopt
with SO_KEEPALIVE
or a higher-level API like Socket.setKeepAlive).
TCP keepalive is different from HTTP KeepAlive.
Major products such as WAS traditional, WebSphere Liberty, the DB2 JDBC
driver, etc. enable keep-alive on most TCP sockets by default.
In general, the purpose of enabling and tuning TCP keepalive is to set it below any firewall or server idle timeouts between two servers on a LAN using connection pools between them (web service client, DB, LDAP, etc.) to reduce the performance overhead of connection re-establishment.
If TCP Keep-Alive is enabled, there are three kernel parameters to tune for TCP keep-alive:
tcp_keepalive_time: The number of seconds after which a socket is considered idle after which the kernel will start to send TCP keepalive probes while it's idle. This defaults to 7200 seconds (2 hours) and is the major TCP keep-alive tuning knob. In general, this should be set to a value below the firewall timeout. This may also be set withsetsockoptwithTCP_KEEPIDLE.tcp_keepalive_intvl: The number of seconds to wait between sending each TCP keep-alive probe. This defaults to 75 seconds. This may also be set withsetsockoptwithTCP_KEEPINTVL.tcp_keepalive_probes: The maximum number of probes to send without responses before giving up and killing the connection. This defaults to 9. This may also be set withsetsockoptwithTCP_KEEPCNT.
These parameters are normally set in /etc/sysctl.conf
and applied with sysctl -p. For example, with a firewall
idle timeout of 60 seconds:
net.ipv4.tcp_keepalive_time=45
net.ipv4.tcp_keepalive_intvl=5
net.ipv4.tcp_keepalive_probes=2
After changing these values, the processes must be restarted to pick them up.
TCP Delayed Acknowledgments
TCP delayed acknowledgments (delayed ACKs) are generally recommended to be disabled if there is sufficient network and CPU capacity for the potential added ACK-only packet load.
To see if a node is delaying ACKs, review the second column of nstat for TcpExtDelayedACKs; for
example:
$ nstat -saz TcpExtDelayedACKs
#kernel
TcpExtDelayedACKs      14    0.0
Or using netstat: netstat -s | grep "delayed acks"
To dynamically disable delayed ACKs, use ip route
to set quickack to 1. For example, to
dynamically disable on all routes:
$ ip route show | awk '{ system("ip route change " $0 " quickack 1"); }'To permanently disable delayed ACKs, add a script to make permanent network
interface changes and apply the same ip route change
commands (explicitly; not using the awk script above).
netstat
netstat is an obsolete tool for monitoring network statistics (for alternatives, see the ss, ip, and nstat commands above).
Use netstat to collect a snapshot of network activity:
netstat -antop. Example:
$ netstat -antop
Active Internet connections (servers and established)
Proto Recv-Q Send-Q Local Address               Foreign Address             State       PID/Program name    Timer
tcp        0      0 0.0.0.0:6000                0.0.0.0:*                   LISTEN      3646/Xorg           off (0.00/0/0)
tcp        0      0 10.20.117.232:46238         10.20.54.72:80              ESTABLISHED 4140/firefox        off (0.00/0/0)
tcp        0      0 10.20.133.78:35370          10.20.253.174:443           TIME_WAIT   -                   timewait (6.63/0/0)
tcp        0      0 10.20.133.78:52458          10.20.33.79:1352            ESTABLISHED 5441/notes          keepalive (3542.42/0/0)
tcp        0      1 ::ffff:10.20.133.78:49558   ::ffff:10.20.52.206:52311   SYN_SENT    3502/BESClient      on (7.65/4/0)
The -o parameter adds the Timer column which will show various timers. For example, the first number before the slash for timewait indicates how many seconds until the socket will be cleared.
Query network interface statistics:
$ netstat -s
Ip:
    5033261 total packets received
    89926 forwarded
    0 incoming packets discarded
    4223478 incoming packets delivered
    4202714 requests sent out
    38 outgoing packets dropped
    2 dropped because of missing route
    26 reassemblies required
    13 packets reassembled ok
Tcp:
    15008 active connections openings
    248 passive connection openings
    611 failed connection attempts
    160 connection resets received
    4 connections established
    4211392 segments received
    4093580 segments send out
    8286 segments retransmited
    0 bad segments received.
    3855 resets sent...
Since kernel 2.6.18, the current and maximum sizes of the socket backlog on a connection are reported in the Recv-Q and Send-Q columns, respectively, for listening sockets:
Recv-Q Established: The count of bytes not copied by the user program connected to this socket.
Listening: Since Kernel 2.6.18 this column contains the current syn backlog.
Send-Q Established: The count of bytes not acknowledged by the remote host.
Listening: Since Kernel 2.6.18 this column contains the maximum size of the syn backlog.
See implementation details of netstat -s.
Some are described in RFCs 2011 and 2012.
Interface packet drops, errors, and buffer overruns
Check if the RX-DRP, RX-ERR,
RX-OVER, TX-DRP, TX-ERR, and
TX-OVER are non-zero:
$ netstat -i
Kernel Interface table
Iface       MTU Met    RX-OK RX-ERR RX-DRP RX-OVR    TX-OK TX-ERR TX-DRP TX-OVR Flg
eth0       1500   0        0      0      0      0        0      0      0      0 BMU
lo        16436   0  3162172      0      0      0  3162172      0      0      0 LRU
tun0       1362   0   149171      0      0      0   150329      0      0      0 MOPRU
virbr0     1500   0    43033      0      0      0    63937      0      0      0 BMRU
virbr1     1500   0        0      0      0      0      124      0      0      0 BMRU
wlan0      1500   0  1552613      0      0      0   704346      0      0      0 BMRU
- ERR - damaged (reason unspecified, but on receive usually means a frame checksum error)
- DRP - dropped (reason unspecified)
- OVR - lost because of DMA overrun (when the NIC does DMA direct between memory and the wire, and the memory could not keep up with the wire speed)
lnstat
lnstat
is a tool for monitoring various kernel network statistics.
By default, lnstat will run with a 3 second interval until Ctrl^C is pressed. Example output:
nf_connt|nf_connt|nf_connt|nf_connt|nf_connt|nf_connt|nf_connt| [...]
 entries|searched|   found|     new| invalid|  ignore|  delete| [...]
       5|       0|       0|       0|       0|      32|       0| [...]
       5|       0|       0|       0|       0|       0|       0| [...]
       5|       0|       0|       0|       0|       0|       0| [...]
The interval may be specified in seconds with -i.
Running lnstat in the background
The following will run lnstat every 60 seconds and write the output to diag_lnstat_*.txt. If there are errors running the commands (e.g. permissions), the script will exit immediately and you should review console output and nohup.out:
nohup lnstat -i 60 >> diag_lnstat_$(hostname)_$(date +%Y%m%d_%H%M%S).txt &Stop the collection:
pkill lnstat
lsof
Running lsof:
lsofRunning lsof if only interested in network (some of the flags imply not showing regular files):
lsof -PnlLast command but grouping by TCP socket connection states:
lsof -Pnl | grep "TCP " | awk '{print $(NF)}' | sort | uniq -cNetworked Filesystems (NFS)
NFS may be monitored with tools such as nfsiostat.
For example:
nohup stdbuf --output=L nfsiostat 300 > diag_nfsiostat_$(hostname)_$(date +%Y%m%d_%H%M%S).txt &Note: Without using stdbuf, older versions of nfsiostat
do not flush output when stdout is redirected, so output to the file may
be delayed.
For example:
nfs.example.com:/path mounted on /path:
   op/s     rpc bklog
 189.86        0.00
read:             ops/s        kB/s       kB/op     retrans     avg RTT (ms)    avg exe (ms)
          3.755      60.772      16.186        4 (0.0%)      15.335     125.260
write:            ops/s        kB/s       kB/op     retrans     avg RTT (ms)    avg exe (ms)
        148.911     446.987       3.002       22 (0.0%)       3.249       5.660
ethtool
ethtool
may be used to query network driver and hardware settings.
Ring buffer
# ethtool -g eth0
Ring parameters for eth0:
Pre-set maximums:
RX:             2040
RX Mini:        0
RX Jumbo:       8160
TX:             255
Current hardware settings:
RX:             255
RX Mini:        0
RX Jumbo:       0
TX:             255
All statistics (unstructured)
ethtool -S eth0Speed information
ethtool eth0Feature flags
ethtool -k eth0Transfer statistics
ethtool -S eth0Driver information
ethtool -i eth0Socket Buffers
Review the background on TCP congestion control.
The default receive buffer size for all network protocols is net.core.rmem_default.
The default receive buffer size for TCP sockets (for both IPv4 and IPv6)
is the second value of net.ipv4.tcp_rmem.
These values may be overridden by an explicit call to setsockopt(SO_RCVBUF)
which will set the receive buffer size to two times the requested value.
The default or requested receive buffer size is limited by
net.core.rmem_max and, in the case of TCP, the third value
(max) in net.ipv4.tcp_rmem.
Starting with Linux 2.4.17 and 2.6.7, the kernel auto-tunes the TCP
receive buffer by default. This is controlled with the property tcp_moderate_rcvbuf.
If auto-tuning is enabled, the kernel will start the buffer at the
default and modulate the size between the first (min) and third (max)
values of net.ipv4.tcp_rmem, depending on memory
availability. In general, the min should be set quite low to handle the
case of physical memory pressure and a large number of sockets.
The default send buffer size for all network protocols is net.core.wmem_default.
The default send buffer size for TCP sockets (for both IPv4 and IPv6) is
the second value of net.ipv4.tcp_wmem.
These values may be overridden by an explicit call to setsockopt(SO_SNDBUF)
which will set the send buffer size to two times the requested value.
The default or requested send buffer size is limited by
net.core.wmem_max and, in the case of TCP, the third value
(max) in net.ipv4.tcp_wmem.
Both receive and send TCP buffers (for both IPv4 and IPv6) are
regulated by net.ipv4.tcp_mem.
tcp_mem is a set of three numbers - low, pressure, and high
- measured in units of the system page size
(getconf PAGESIZE). When the number of pages allocated by
receive and send buffers is below low, TCP does not try to
reduce its buffers' memory usage. When the number of pages exceeds
pressure, TCP tries to reduce its buffers' memory usage.
The total buffers' memory usage page may not exceed the number of pages
specified by high. In general, these values are set as some
proportions of physical memory, taking into account
program/computational demands. By default, Linux sets these to
proportions of RAM on boot. Query the value with sysctl and
multiply the middle number by the page size
(getconf PAGESIZE) and this is the number of bytes at which
point the OS may start to trim TCP buffers.
For example, consider setting values similar to the following in
/etc/sysctl.conf and running sysctl -p:
net.core.rmem_default=1048576
net.core.wmem_default=1048576
net.core.rmem_max=16777216
net.core.wmem_max=16777216
net.ipv4.tcp_rmem=4096 1048576 16777216
net.ipv4.tcp_wmem=4096 1048576 16777216Congestion Control Algorithm
The default congestion algorithm is cubic. A space-delimited list of available congestion algorithms may be printed with:
$ sysctl net.ipv4.tcp_available_congestion_control
net.ipv4.tcp_available_congestion_control = cubic reno htcp
Additional congestion control algorithms, often shipped but not enabled, may be enabled with modprobe. For example, to enable TCP Hybla for high RTT links:
# modprobe tcp_hyblaThe current congestion control algorithm may be dynamically updated with:
# sysctl -w net.ipv4.tcp_congestion_control=hyblaAnother commonly used algorithm is htcp.
The congestion window is not advertised on the network but instead
lives within memory on the sender. To query the congestion window, use
the ss command and search for the cwnd value.
For example:
$ ss -i
State      Recv-Q Send-Q      Local Address:Port          Peer Address:Port
ESTAB      0      0            10.20.30.254:47768        10.20.30.40:http
     cubic wscale:0,9 rto:266 rtt:66.25/25.25 ato:40 cwnd:10 send 1.7Mbps rcv_space:14600
The default congestion window size (initcwnd) may be
changed by querying the default route and using the change command with
initcwnd added. For example:
# ip route show | grep default
default via 10.20.30.1 dev wlan0  proto static
# ip route change default via 10.20.30.1 dev wlan0  proto static initcwnd 10
The default receive window size (initrwnd) may be
changed in a similar way.
Queuing Discipline
The queuing
discipline controls how packets are queued and it's configured with
net.core.default_qdisc:
# sysctl net.core.default_qdisc
net.core.default_qdisc = pfifo_fast
Another commonly used algorithm is fq (fair
queuing).
Maximum Flow Rate
The maximum flow rate may be throttled to reduce the chances of overflowing host receive buffers or intermediate switch buffers in response to packet bursts. For example, for a 10G card, test a maximum flow rate like 8G:
/sbin/tc qdisc add dev eth0 root fq maxrate 8gbitSlow Start after Idle
Starting with kernel version 2.6.18, by default, a socket's
congestion window will be reduced when idle. For internal network
communication using persistent TCP connection pools over controlled, LAN
networks (e.g. a reverse proxy to an application server such as IHS }
WAS connections), set net.ipv4.tcp_slow_start_after_idle=0
in /etc/sysctl.conf and run sysctl -p to
disable reducing the TCP congestion window for idle connections:
net.ipv4.tcp_slow_start_after_idle=0Emulating Network Behaviors
tc
netem is a network emulation component of the traffic control (tc) suite. For example, to emulate a 100ms delay on all packets on an interface:
sudo tc qdisc add dev ${INTERFACE} root netem delay 100msClear induced delay:
sudo tc qdisc del dev ${INTERFACE} rootMonitor TCP Retransmits
For an overview of why it's important to monitor TCP retransmits, see the Operating Systems chapter section on Monitor TCP Retransmits.
On Linux, monitor nstat for TcpRetransSegs, TcpExtTCPSlowStartRetrans, TcpExtTCPSynRetrans. See the nstat section for details. For example:
$ nstat -asz | grep -e TcpRetransSegs -e TcpExtTCPSlowStartRetrans -e TcpExtTCPSynRetrans
TcpRetransSegs                  0                  0.0
TcpExtTCPSlowStartRetrans       0                  0.0
TcpExtTCPSynRetrans             0                  0.0
An alternative is netstat although this is now obsolete in favor of nstat:
$ netstat -s | grep -i retrans
    283 segments retransmited
If a TCP implementation enables RFC 6298 support, then the RTO is recommended to be at least 1 second:
Whenever RTO is computed, if it is less than 1 second, then the RTO SHOULD be rounded up to 1 second. Traditionally, TCP implementations use coarse grain clocks to measure the RTT and trigger the RTO, which imposes a large minimum value on the RTO. Research suggests that a large minimum RTO is needed to keep TCP conservative and avoid spurious retransmissions [AP99]. Therefore, this specification requires a large minimum RTO as a conservative approach, while at the same time acknowledging that at some future point, research may show that a smaller minimum RTO is acceptable or superior.
However, this is not a "MUST" and Linux, for example, uses a default minimum value of 200ms, although it may be dynamically adjusted upwards.
The current timeout (called retransmission timeout or "rto") can be
queried on Linux using ss:
$ ss -i
...
     cubic rto:502 rtt:299/11.25 ato:59 cwnd:10 send 328.6Kbps rcv_rtt:2883 rcv_space:57958
The minimum RTO can be configured using the ip
command on a particular route and setting rto_min (relatedly, see tcp_frto).
Monitor TCP State Statistics
One simple and very useful indicator of process health and load is its TCP activity. The following script takes a set of ports and summarizes how many TCP sockets are established, opening, and closing for each port. It has been tested on Linux and AIX. Example output:
$ portstats.sh 80 443
PORT   ESTABLISHED  OPENING  CLOSING
80     3            0        0
443    10           0        2
====================================
Total  13           0        2
portstats.sh:
#!/bin/sh

usage() {
  echo "usage: portstats.sh PORT_1 PORT_2 ... PORT_N"
  echo "       Summarize network connection statistics coming into a set of ports."
  echo ""
  echo "       OPENING represents SYN_SENT and SYN_RECV states."
  echo "       CLOSING represents FIN_WAIT1, FIN_WAIT2, TIME_WAIT, CLOSED, CLOSE_WAIT,"
  echo "                          LAST_ACK, CLOSING, and UNKNOWN states."
  echo ""
  exit;
}

NUM_PORTS=0
OS=`uname`

for c in $*
do
  case $c in
  -help)
    usage;
    ;;
  --help)
    usage;
    ;;
  -usage)
    usage;
    ;;
  --usage)
    usage;
    ;;
  -h)
    usage;
    ;;
  -?)
    usage;
    ;;
  *)
    PORTS[$NUM_PORTS]=$c
    NUM_PORTS=$((NUM_PORTS + 1));
    ;;
  esac
done

if [ "$NUM_PORTS" -gt "0" ]; then
  date
  NETSTAT=`netstat -an | grep tcp`
  i=0
  for PORT in ${PORTS[@]}
  do
    if [ "$OS" = "AIX" ]; then
      PORT="\.$PORT\$"
    else
      PORT=":$PORT\$"
    fi
    ESTABLISHED[$i]=`echo "$NETSTAT" | grep ESTABLISHED | awk '{print $4}' | grep "$PORT" | wc -l`
    OPENING[$i]=`echo "$NETSTAT" | grep SYN_ | awk '{print $4}' | grep "$PORT" | wc -l`
    WAITFORCLOSE[$i]=`echo "$NETSTAT" | grep WAIT | awk '{print $4}' | grep "$PORT" | wc -l`
    WAITFORCLOSE[$i]=$((${WAITFORCLOSE[$i]} + `echo "$NETSTAT" | grep CLOSED | awk '{print $4}' | grep "$PORT" | wc -l`));
    WAITFORCLOSE[$i]=$((${WAITFORCLOSE[$i]} + `echo "$NETSTAT" | grep CLOSING | awk '{print $4}' | grep "$PORT" | wc -l`));
    WAITFORCLOSE[$i]=$((${WAITFORCLOSE[$i]} + `echo "$NETSTAT" | grep LAST_ACK | awk '{print $4}' | grep "$PORT" | wc -l`));
    WAITFORCLOSE[$i]=$((${WAITFORCLOSE[$i]} + `echo "$NETSTAT" | grep UNKNOWN | awk '{print $4}' | grep "$PORT" | wc -l`));

    TOTESTABLISHED=0
    TOTOPENING=0
    TOTCLOSING=0
    i=$((i + 1));
  done

  printf '%-6s %-12s %-8s %-8s\n' PORT ESTABLISHED OPENING CLOSING
  i=0
  for PORT in ${PORTS[@]}
  do
    printf '%-6s %-12s %-8s %-8s\n' $PORT ${ESTABLISHED[$i]} ${OPENING[$i]} ${WAITFORCLOSE[$i]}
    TOTESTABLISHED=$(($TOTESTABLISHED + ${ESTABLISHED[$i]}));
    TOTOPENING=$(($TOTOPENING + ${OPENING[$i]}));
    TOTCLOSING=$(($TOTCLOSING + ${WAITFORCLOSE[$i]}));
    i=$((i + 1));
  done

  printf '%36s\n' | tr " " "="
  printf '%-6s %-12s %-8s %-8s\n' Total $TOTESTABLISHED $TOTOPENING $TOTCLOSING

else
  usage;
fi
TIME_WAIT
See the Operating Systems chapter for the theory of TIME_WAIT.
Linux has a compile-time
constant of 60 seconds for a TIME_WAIT timeout.
net.ipv4.tcp_fin_timeout is not for
TIME_WAIT but instead for the FIN_WAIT_2
state.
Changing the MTU
If all components in a network path support larger MTU (sometimes called "jumbo frames") and if this setting is enabled on these devices, then an MTU line may be added to /etc/sysconfig/network-scripts/ifcfg-${INTERfACE} and the network service restarted to utilize the larger MTU. For example:
MTU=9000TCP Reordering
In some benchmarks, changing the values of net.ipv4.tcp_reordering
and net.ipv4.tcp_reordering improved network
performance.
Other Network Configuration
To update the socket
listen backlog, set net.core.somaxconn in
/etc/sysctl.conf and apply with sysctl -p.
To update the maximum
incoming packet backlog, set
net.core.netdev_max_backlog in
/etc/sysctl.conf and apply with sysctl -p.
See examples for high bandwidth networks.
Each network adapter has an outbound transmission queue which limits
the outbound TCP sending rate. Consider increasing this by running ip link set $DEVICE txqueuelen $PACKETS
on each relevant device. Test values such as 4096.
tcpdump
tcpdump details
Review the Wireshark chapter for details on how to analyze the data.
If the traffic in question occurs on a single interface, it's better
to use the interface name rather than -i any as this has
less of a chance to confuse Wireshark than the any
pseudo-interface.
If -W 1 is specified, there will be just one file and it
will overwrite at the beginning when rotating, so it's usually better to
use -W 2 with half the desired -C to ensure
having some history (e.g. if the problem is reproduced right after a
rotation). If -W is not specified, the behavior is unclear with some
testing showing strange behavior, so it's best to specify -W.
Review nohup.out to check if
packets dropped by kernel is greater than 0. If so,
consider increasing
the bufffers with -B N (where N is in KB):
Packets that arrive for a capture are stored in a buffer, so that they do not have to be read by the application as soon as they arrive. On some platforms, the buffer's size can be set; a size that's too small could mean that, if too many packets are being captured and the snapshot length doesn't limit the amount of data that's buffered, packets could be dropped if the buffer fills up before the application can read packets from it, while a size that's too large could use more non-pageable operating system memory than is necessary to prevent packets from being dropped.
snarflen
The -s $X snarflen argument specifies up to how many
bytes to capture per packet. Use -s 0 to capture all packet
contents although this may cause a significant overhead if there is a
lot of network activity which isn't filtered. The default snarflen
depends on the version of tcpdump, so it's best to explicitly specify
it.
Dumping pcap files from the command line
In addition to using Wireshark, you may also dump the tcpdump on any Linux machine using the same tcpdump command. For example:
sudo tcpdump -A -n -nn -l -tttt -r capture.pcapCapture network traffic with tcpdump
Review capturing network trace with tcpdump on all ports.
Capture network traffic with tcpdump on one port
Review capturing network trace with tcpdump on a specific port.
Read tcpdump
Wireshark and its associated tshark are generally the best and most
powerful tools to analyze tcpdumps; however, for simplicity or
convenience, it may be useful to read tcpdumps directly using tcpdump -r.
For example:
TZ=UTC tcpdump -nn -r *.pcapRead tcpdump for particular host and port
TZ=UTC tcpdump -nn -r *.pcap host 10.1.2.3 and port 80arping
Find the MAC address associated with an IP address:
arping 10.20.30.100tcping
Send a TCP packet to a destnation host and port to test if it's available. For example:
$ tcping ibm.com 443
ibm.com port 443 open.
$ tcping fakeibm.com 443
fakeibm.com port 443 closed.
arp
Show the arp table:
arp -a -varpwatch
arpwatch shows new ARP announcements:
arpwatch -i eth0iptraf-ng
iptraf-ng
monitors network usage. There are different run modes. Some work on all
interfaces with -i all and some only work for a named
interface.
IP traffic monitor:
$ sudo iptraf-ng -i all
 iptraf-ng 1.1.4
┌ TCP Connections (Source Host:Port) ─                                      Packets ─           Bytes ── Flag ── Iface ─        ┐
│┌172.17.0.2:9080                                                         >       1                52    --A-    eth0           │
│└172.17.0.1:54608                                                        =       0                 0    ----    eth0           │
│┌172.17.0.1:57244                                                        =       3               261    -PA-    eth0           │
│└172.17.0.2:9080                                                         =       3               516    -PA-    eth0           │
└ TCP:      2 entries ─                                                                                                 Active  ┘
 Packets captured:                                          28984       │  TCP flow rate:         0.00 kbps
LAN station monitor:
$ sudo iptraf-ng -l all
 iptraf-ng 1.1.4
┌─444444 PktsIn ─         IP In ────── BytesIn ─       InRate ───── PktsOut ─         IP Out ───── BytesOut ──── OutRate ─      ┐
│ Ethernet HW addr: 02:42:ac:11:00:02 on eth0                                                                                   │
│ └     17967           17967         1105652         1082.2         17961           17961         2212603        2165.1        │
│ Ethernet HW addr: 02:42:91:4a:2b:ba on eth0                                                                                   │
│ └     17961           17961         2212603         2165.1         17967           17967         1105652        1082.2        │
General interface statistics:
$ sudo iptraf-ng -g
 iptraf-ng 1.1.4
┌ Iface ─                  Total ─          IPv4 ─          IPv6 ─         NonIP ────── BadIP ─           Activity ─            ┐
│ lo                           0               0               0               0            0              0.00 kbps            │
│ eth0                     51173           51173               0               0            0           3244.22 kbps            │
Detailed statistics on an interface:
$ sudo iptraf-ng -d eth0
 iptraf-ng 1.1.4
┌ Statistics for eth0 ─                                                                                                         ┐
│                                                                                                                               │
│               Total      Total    Incoming   Incoming    Outgoing   Outgoing                                                  │
│             Packets      Bytes     Packets      Bytes     Packets      Bytes                                                  │
│ Total:        25546    2359352       12775     786205       12771    1573147                                                  │
│ IPv4:         25546    2359352       12775     786205       12771    1573147                                                  │
│ IPv6:             0          0           0          0           0          0                                                  │
│ TCP:          25546    2359352       12775     786205       12771    1573147                                                  │
│ UDP:              0          0           0          0           0          0                                                  │
│ ICMP:             0          0           0          0           0          0                                                  │
│ Other IP:         0          0           0          0           0          0                                                  │
│ Non-IP:           0          0           0          0           0          0                                                  │
│                                                                                                                               │
│                                                                                                                               │
│ Total rates:       3164.82 kbps            Broadcast packets:            0                                                    │
│                       4283 pps             Broadcast bytes:              0                                                    │
│                                                                                                                               │
│ Incoming rates:    1054.61 kbps                                                                                               │
│                       2142 pps                                                                                                │
│                                            IP checksum errors:           0                                                    │
│ Outgoing rates:    2110.20 kbps                                                                                               │
│                       2141 pps                                                                                                │
Packet size counts on an interface:
$ sudo iptraf-ng -z eth0
 iptraf-ng 1.1.4
┌ Packet Distribution by Size ─                                                                                                 ┐
│                                                                                                                               │
│ Packet size brackets for interface eth0                                                                                       │
│                                                                                                                               │
│                                                                                                                               │
│ Packet Size (bytes)      Count     Packet Size (bytes)     Count                                                              │
│     1 to   75:           14973      751 to  825:               0                                                              │
│    76 to  150:            4991      826 to  900:               0                                                              │
│   151 to  225:             998      901 to  975:               0                                                              │
│   226 to  300:               0      976 to 1050:               0                                                              │
│   301 to  375:               0     1051 to 1125:               0                                                              │
│   376 to  450:             998     1126 to 1200:               0                                                              │
│   451 to  525:               0     1201 to 1275:               0                                                              │
│   526 to  600:               0     1276 to 1350:               0                                                              │
│   601 to  675:               0     1351 to 1425:               0                                                              │
│   676 to  750:               0     1426 to 1500+:              0                                                              │
│                                                                                                                               │
│                                                                                                                               │
│ Interface MTU is 1500 bytes, not counting the data-link header                                                                │
│ Maximum packet size is the MTU plus the data-link header length                                                               │
│ Packet size computations include data-link headers, if any                                                                    │
nethogs
nethogs
monitors network usage by process.
Example:
$ sudo nethogs -a -v 2 -d 5
NetHogs version 0.8.5

    PID USER     PROGRAM                            DEV        SENT      RECEIVED
      ? root     172.17.0.2:9080-172.17.0.1:48446         7682253.000 4230555.000 B
      ? root     unknown TCP                                    0.000       0.000 B

  TOTAL                                                   7682253.000 4230555.000 B
The various view modes (-v) are:
-v : view mode (0 = KB/s, 1 = total KB, 2 = total B, 3 = total MB). default is 0.iftop
iftop
monitors network usage.
Example:
$ sudo iftop -nN -i eth0
                         191Mb                     381Mb                    572Mb                     763Mb            954Mb
└────────────────────────┴─────────────────────────┴────────────────────────┴─────────────────────────┴─────────────────────────
172.17.0.2                                         => 172.17.0.1                                         1.91Mb  1.49Mb  1.49Mb
                                                   <=                                                     979Kb   765Kb   765Kb
────────────────────────────────────────────────────────────────────────────────────────────────────────────────────────────────
TX:             cum:   1.87MB   peak:    2.23Mb                                                  rates:   1.91Mb  1.49Mb  1.49Mb
RX:                     956KB            1.11Mb                                                            979Kb   765Kb   765Kb
TOTAL:                 2.80MB            3.35Mb                                                           2.87Mb  2.24Mb  2.24Mb
Add -P for statistics by port instead of aggregating by
host.
jnettop
jnettop
monitors network usage.
Example:
$ sudo jnettop -n
run   0:00:07 device eth0       pkt[f]ilter: none                                                                                     .
[c]ntfilter: on  [b]ps=bytes/s [l]ocal aggr.: none [r]emote aggr.: none
[q]uit [h]elp [s]orting [p]ackets [.] pause [0]-[9] switch device
LOCAL <-> REMOTE                                                                                                 TXBPS   RXBPS TOTALBPS
 (IP)                                         PORT  PROTO  (IP)                                         PORT       TX      RX    TOTAL
172.17.0.2 <-> 172.17.0.1                                                                                       754b/s  415b/s  1.14k/s
 172.17.0.2                                   9080    TCP  172.17.0.1                                  45128    1.47k    831b    2.29k

172.17.0.2 <-> 172.17.0.1                                                                                       754b/s  415b/s  1.14k/s
 172.17.0.2                                   9080    TCP  172.17.0.1                                  45130    1.47k    831b    2.29k

─LLLLLLLLLLLLLLLLLLLLLLLLLLLLLLLLLLLLLLLLLLLLLLLLLLLLLLLLLLLLLLLLLLLLLLLLLLLLLLLLLLLLLLLLLLLLLLLLLLLLLLLLLLLLLLLLLLLLLLLLLLLLLLLLLLLLL─
TOTAL                                                                                                           438k/s  241k/s   679k/s
                                                                                                                1.95m   1.08m    3.03m
trafshow
trafshow
monitors network usage.
Example:
$ sudo trafshow -n -i eth0
Source/24                               Destination/24                          Protocol        Size            CPS
─SSSSSSSSSSSSSSSSSSSSSSSSSSSSSSSSSSSSSSSSSSSSSSSSSSSSSSSSSSSSSSSSSSSSSSSSSSSSSSSSSSSSSSSSSSSSSSSSSSSSSSSSSSSSSSSSSSSSSSSSSSSS─
172.17.0.0,9080                         172.17.0.0                              6               37804K          281K
172.17.0.0                              172.17.0.0,9080                         6               17927K          134K
172.17.0.0                              172.17.0.0                              6               3503K           26K
172.17.0.0,48050                        172.17.0.0                              6               617
172.17.0.0,49000                        172.17.0.0                              6               617

─SSSSSSSSSSSSSSSSSSSSSSSSSSSSSSSSSSSSSSSSSSSSSSSSSSSSSSSSSSSSSSSSSSSSSSSSSSSSSSSSSSSSSSSSSSSSSSSSSSSSSSSSSSSSSSSSSSSSSSSSSSSS─
eth0                                    10 Flows                                Total:          57M             441K
iperf3
iperf3
may be used to test network speed. Start a server endpoint with
iperf3 -s and then use -c $server on the
client. Compare both directions.
nuttcp
nuttcp
may be used to test network speed. See examples.
speedtest-cli
speedtest-cli
may be used to test internet bandwidth speeds with a public speedtest
provider.
Example:
$ speedtest-cli --bytes --simple
Ping: 22.146 ms
Download: 34.88 Mbyte/s
Upload: 3.77 Mbyte/s
traceroute
Example:
traceroute example.com
traceroute to example.com (93.184.216.34), 30 hops max, 60 byte packets
 1  _gateway (172.17.0.1)  1.511 ms  1.276 ms  1.189 ms
[...]
11  93.184.216.34 (93.184.216.34)  8.908 ms  7.252 ms  6.674 ms
mtr
Live traceroute. Example:
                                    My traceroute  [v0.92]
fca32e320852 (172.17.0.2)                                            2020-09-09T21:04:08+0000
Keys:  Help   Display mode   Restart statistics   Order of fields   quit
                                                     Packets               Pings
 Host                                              Loss%   Snt   Last   Avg  Best  Wrst StDev
 1. _gateway                                        0.0%    14    0.1   0.1   0.1   0.2   0.0
[...]
10. 93.184.216.34                                   0.0%    13    6.4   7.4   6.4  12.5   2.2
nmap
nmap -p 1-65535 -T4 -A -v $host: Probe all TCP ports for a host.
Disable IPv6 DHCP Auto-negotiation
Add the following to /etc/sysctl.conf and apply with
sysctl -p:
net.ipv6.conf.all.autoconf=0
net.ipv6.conf.all.accept_ra=0
NetworkManager
Update DNS Servers
- Show active connections:
nmcli connection show --active - Show current DNS servers:
nmcli connection show $uuid | grep -i dns - Set an explicit set of DNS servers for IPv4 and IPv6 examples:
- CloudFlare:
nmcli connection modify $uuid ipv4.ignore-auto-dns yes ipv6.ignore-auto-dns yes ipv4.dns "1.1.1.1 1.0.0.1" ipv6.dns "2606:4700:4700::1111 2606:4700:4700::1001" - Google:
nmcli connection modify $uuid ipv4.ignore-auto-dns yes ipv6.ignore-auto-dns yes ipv4.dns "8.8.8.8 8.8.4.4" ipv6.dns "2001:4860:4860::8888 2001:4860:4860::8844" - Reset to DHCP:
nmcli connection modify $uuid ipv4.ignore-auto-dns no ipv6.ignore-auto-dns no ipv4.dns "" ipv6.dns "" ipv4.dns-search ""
- CloudFlare:
- Reload the connection or restart networking
nmcli connection up $uuidsystemctl restart NetworkManager(this latter option may be more useful in the case WiFi is being used and keys are stored in a wallet rather than using--askabove)
- Confirm settings:
cat /etc/resolv.confnmcli connection show $uuid | grep -i dns
- Test DNS lookup time:
dig example.com | grep -A 1 -e "ANSWER SECTION" -e "Query time" - Other useful commands:
- Show devices:
nmcli device - Show devices with details:
nmcli device show - Modify host-name lookup search list:
ipv4.dns-searchandipv6.dns-search - Add a DNS server instead of replacing:
nmcli connection modify $uuid +ipv4.dns $ip - Disconnect device:
nmcli device disconnect $device - Connect device:
nmcli device connect $device
- Show devices:
- See additional background
resolvectl
resolvectl is a utility to display DNS resolver configuration. For example:
$ resolvectl status
Link 3 (wlp3s0)
       Current Scopes: DNS LLMNR/IPv4 LLMNR/IPv6
 DefaultRoute setting: yes
        LLMNR setting: yes
 MulticastDNS setting: no
   DNSOverTLS setting: no
       DNSSEC setting: no
     DNSSEC supported: no
   Current DNS Server: 1.1.1.1
          DNS Servers: 1.1.1.1
                       1.0.0.1
           DNS Domain: ~.
Kernel
Thread Stacks
Output /proc/pid/stack and /proc/pid/task/*/stack to review all kernel stacks.
Process Tracing
strace may be used to trace system calls that a process makes, and ltrace may be used to trace library calls that a process makes. This can be helpful in certain situations when there are low level delays such as writing to disk (strace), or investigating library calls such as libc malloc calls (ltrace). strace and ltrace cannot be run at the same time for the same process.
strace
strace
traces system calls (syscalls) although it usually has an extremely
large overhead even if filtering is used.
strace usually doesn't come pre-installed and it must be installed from the normal repositories.
For example, to dynamically attach to a process and trace all syscalls of a process and all its threads to an output file:
$ strace -f -tt -s 256 -o outputfile.txt -p $PID
^C
$ cat outputfile.txt
31113 11:43:15.724911 open("/home/user/somefile", O_WRONLY|O_CREAT|O_TRUNC|O_LARGEFILE, 0666) = 139
31113 11:43:15.725109 fstat64(139, {st_mode=S_IFREG|0664, st_size=0, ...}) = 0
31113 11:43:15.728881 write(139, "<!DOCTYPE html PUBLIC \"-//W3C//D"..., 8192 <unfinished ...>
31113 11:43:15.729004 <... write resumed> ) = 8192
31113 11:43:15.729385 close(139 <unfinished ...>
31113 11:43:15.731440 <... close resumed> ) = 0
The -e option is a comma-delimited list of which
syscalls are traced (and others are not traced). For example:
strace -f -tt -e exit_group,write -s 256 -o outputfile.txt -p $PIDThe -k option on newer versions of strace
prints the stack leading to the syscall. For example:
$ strace -f -tt -k -e mmap,write -s 256 -o outputfile.txt -p $PID
^C
$ cat outputfile.txt
218   20:15:24.726282 mmap(NULL, 16777216, PROT_READ|PROT_WRITE, MAP_PRIVATE|MAP_ANONYMOUS, -1, 0) = 0x150a02000000
 > /usr/lib64/libc-2.30.so(__mmap+0x26) [0xfc356]
 > /opt/ibm/java/jre/lib/amd64/compressedrefs/libj9prt29.so(default_pageSize_reserve_memory+0xef) [0x305bf]
 > /opt/ibm/java/jre/lib/amd64/compressedrefs/libj9prt29.so(getMemoryInRangeForDefaultPages+0x44c) [0x30d6c]
 > /opt/ibm/java/jre/lib/amd64/compressedrefs/libj9prt29.so(omrvmem_reserve_memory_ex+0x333) [0x31593]
 > /opt/ibm/java/jre/lib/amd64/compressedrefs/libj9vm29.so(allocateFixedMemorySegmentInList+0x258) [0xcb408]
 > /opt/ibm/java/jre/lib/amd64/compressedrefs/libj9jit29.so(J9::SegmentAllocator::allocate(unsigned long, std::nothrow_t const&)+0x38) [0x155698]
 > /opt/ibm/java/jre/lib/amd64/compressedrefs/libj9jit29.so(J9::SegmentAllocator::allocate(unsigned long)+0xf) [0x15573f]
 > /opt/ibm/java/jre/lib/amd64/compressedrefs/libj9jit29.so(J9::J9SegmentCache::J9SegmentCache(unsigned long, J9::J9SegmentProvider&)+0x11f) [0x155aaf]
 > /opt/ibm/java/jre/lib/amd64/compressedrefs/libj9jit29.so(TR::CompilationInfoPerThread::initializeSegmentCache(J9::J9SegmentProvider&)+0x23) [0x1337d3]
 > /opt/ibm/java/jre/lib/amd64/compressedrefs/libj9jit29.so(TR::CompilationInfoPerThread::processEntries()+0x84) [0x133994]
 > /opt/ibm/java/jre/lib/amd64/compressedrefs/libj9jit29.so(TR::CompilationInfoPerThread::run()+0x29) [0x134069]
 > /opt/ibm/java/jre/lib/amd64/compressedrefs/libj9jit29.so(protectedCompilationThreadProc(J9PortLibrary*, TR::CompilationInfoPerThread*)+0x79) [0x134129]
 > /opt/ibm/java/jre/lib/amd64/compressedrefs/libj9prt29.so(omrsig_protect+0x1e2) [0x223d2]
 > /opt/ibm/java/jre/lib/amd64/compressedrefs/libj9jit29.so(compilationThreadProc(void*)+0x203) [0x134583]
 > /opt/ibm/java/jre/lib/amd64/compressedrefs/libj9thr29.so(thread_wrapper+0x185) [0xe335]
 > /usr/lib64/libpthread-2.30.so(start_thread+0xe1) [0x94e1]
 > /usr/lib64/libc-2.30.so(__clone+0x42) [0x101692]
More advanced example to track signals:
sh -c "PID=$(pgrep -o java); truncate -s 0 nohup.out && truncate -s 0 diag_strace_$(hostname).txt && date &>> nohup.out && echo PID=${PID} &>> diag_strace_$(hostname).txt && ps -L -p $PID &>> diag_strace_$(hostname).txt && (nohup strace -f -tt -e trace=rt_sigqueueinfo,rt_tgsigqueueinfo,rt_sigpending -o diag_strace_$(hostname)_$(date +%Y%m%d_%H%M%S).txt -p $PID &) && sleep 1 && cat nohup.out"
mmap
Trace mmap-related memory syscalls (particularly with the -k stack option, this may have a significant performance overhead):
Start (replace $PID with the process ID):
nohup strace -f -k -tt -e trace=mmap,munmap,mremap,shmat,shmdt,brk -qq -o diag_strace_$(hostname)_$(date +%Y%m%d_%H%M%S).txt -p $PID &Stop:
pkill -INT straceExample output:
216   17:03:26.915735 mmap(NULL, 16777216, PROT_READ|PROT_WRITE, MAP_PRIVATE|MAP_ANONYMOUS, -1, 0) = 0x150a02000000
58466 17:03:27.099645 --- SIGRT_30 {si_signo=SIGRT_30, si_code=SI_TKILL, si_pid=22, si_uid=1001} ---
58467 17:03:27.167435 --- SIGRT_30 {si_signo=SIGRT_30, si_code=SI_TKILL, si_pid=22, si_uid=1001} ---
58470 17:03:27.172575 --- SIGRT_30 {si_signo=SIGRT_30, si_code=SI_TKILL, si_pid=22, si_uid=1001} ---
58468 17:03:27.176465 --- SIGRT_30 {si_signo=SIGRT_30, si_code=SI_TKILL, si_pid=22, si_uid=1001} ---
215   17:03:27.215293 mmap(NULL, 16777216, PROT_READ|PROT_WRITE, MAP_PRIVATE|MAP_ANONYMOUS, -1, 0) = 0x150a01000000
218   17:03:27.258028 mmap(NULL, 16777216, PROT_READ|PROT_WRITE, MAP_PRIVATE|MAP_ANONYMOUS, -1, 0) = 0x150a00000000
216   17:03:27.344185 mmap(NULL, 16777216, PROT_READ|PROT_WRITE, MAP_PRIVATE|MAP_ANONYMOUS, -1, 0) = 0x1509ab000000
58472 17:03:27.384671 --- SIGRT_30 {si_signo=SIGRT_30, si_code=SI_TKILL, si_pid=22, si_uid=1001} ---
216   17:03:27.497329 munmap(0x1509ab000000, 16777216) = 0
216   17:03:27.798111 mmap(NULL, 16777216, PROT_READ|PROT_WRITE, MAP_PRIVATE|MAP_ANONYMOUS, -1, 0) = 0x1509ab000000
216   17:03:27.953452 munmap(0x1509ab000000, 16777216) = 0
215   17:03:27.963090 munmap(0x150a01000000, 16777216) = 0
ltrace
ltrace
traces library calls (e.g. libc) although it may have a significant
overhead even if filtering is used.
The -w N option on newer versions of ltrace
prints the stack leading to the call. For example:
218 20:19:53.651933 libj9prt29.so->malloc(128, 128, 0, 96 <unfinished ...>
218 20:19:53.675794 <... malloc resumed> )       = 0x150a2411d110
 > libj9prt29.so(omrmem_allocate_memory+0x71) [150a489ec3f1]
 > libj9jit29.so(_ZN2J921SystemSegmentProvider21createSegmentFromAreaEmPv+0xfc) [150a430542bc]
 > libj9jit29.so(_ZN2J921SystemSegmentProvider18allocateNewSegmentEmN2TR17reference_wrapperI15J9MemorySegmentEE+0x33) [150a430543b3]
 > libj9jit29.so(_ZN2J921SystemSegmentProvider7requestEm+0x393) [150a430549e3]
 > libj9jit29.so(_ZN2TR6Region8allocateEmPv+0x2d) [150a433253cd]
 > libj9jit29.so(_ZN9TR_Memory18allocateHeapMemoryEmN13TR_MemoryBase10ObjectTypeE+0xe) [150a4332557e]
 > libj9jit29.so(_ZN3CS214heap_allocatorILm65536ELj12E17TRMemoryAllocatorIL17TR_AllocationKind1ELj12ELj28EEE8allocateEmPKc.constprop.216+0x265) [150a435043c5]
 > libj9jit29.so(_ZN3OMR9OptimizerC2EPN2TR11CompilationEPNS1_20ResolvedMethodSymbolEbPK20OptimizationStrategyt+0x15d) [150a435045cd]
 > libj9jit29.so(_ZN2J99OptimizerC1EPN2TR11CompilationEPNS1_20ResolvedMethodSymbolEbPK20OptimizationStrategyt+0x23) [150a43228183]
 > libj9jit29.so(_ZN3OMR9Optimizer15createOptimizerEPN2TR11CompilationEPNS1_20ResolvedMethodSymbolEb+0x13a) [150a435022da]
 > libj9jit29.so(_ZN3OMR20ResolvedMethodSymbol5genILEP11TR_FrontEndPN2TR11CompilationEPNS3_20SymbolReferenceTableERNS3_12IlGenRequestE+0x3ec) [150a43354b4c]
malloc
Trace malloc-related memory library calls (particularly with the -w stack option, this may have a significant performance overhead):
Start (replace $PID with the process ID):
nohup ltrace -f -tt -w 10 -e malloc+free+calloc+realloc+alloca+malloc_trim+mallopt -o diag_ltrace_$(hostname)_$(date +%Y%m%d_%H%M%S).txt -p $PID &Stop:
pkill -INT ltraceExample output:
62080 17:25:58.500832 libdbgwrapper80.so->malloc(4377, 0x150a40e5ab96, 21, 0) = 0x1509d4009b90
62080 17:25:58.504123 libdbgwrapper80.so->free(0x1509d4009b90, 0x150a40e5abb4, 1, 0x150a4a0943fb) = 0
62080 17:25:58.509705 libdbgwrapper80.so->malloc(4377, 0x150a40e5ab96, 21, 0) = 0x1509d4009b90
62080 17:25:58.514305 libdbgwrapper80.so->free(0x1509d4009b90, 0x150a40e5abb4, 1, 0x150a4a0943fb <unfinished ...>
337 17:25:58.519176 <... free resumed> )         = <void>
62080 17:25:58.519361 <... free resumed> )       = 0
62080 17:25:58.519845 libdbgwrapper80.so->malloc(4377, 0x150a40e5ab96, 21, 0 <unfinished ...>
337 17:25:58.525282 libj9prt29.so->malloc(88, 88, 0, 56 <unfinished ...>
62080 17:25:58.528285 <... malloc resumed> )     = 0x1509d4009b90
337 17:25:58.529248 <... malloc resumed> )       = 0x1509d40077d0
Miscellaneous
Hardware
List hardware details: lshw
List kernel modules: lsmod
List USB information: lsusb and
usb-devices
Use the sensors and ipmitool commands.
CPU
Show frequencies:
cpupower frequency-infoShow idle states
cpupower idle-infoShow per-core information:
cpupower monitorFor dynamically updating information, see powertop.
Additional CPU information:
dmidecode -t 4dmidecode --type system -qdmidecode -q --type processordmidecode -q --type memory
Processor Sets/Pinning
[A] workload can get better performance if each WebSphere Application Server (WAS) instance, a process in itself, is set to run on a separate subset of CPU threads. Keeping a process on a set of CPU threads, and keeping other processes off that set of CPU threads, can improve performance because it preserves CPU cache warmth and NUMA memory locality. In this setup, with 8 WAS instances and 16 cores, each with 4 Simultaneous Multi-Threading (SMT) threads, each WAS instance was pinned to 2 cores, or 8 CPU threads.
The taskset command may be used to assign the CPUs for a program when the program is started. For example:
taskset -c 0-7   /opt/WAS8.5/profiles/specjprofile1/bin/startServer.sh server1
taskset -c 16-23 /opt/WAS8.5/profiles/specjprofile2/bin/startServer.sh server1
taskset -c 32-39 /opt/WAS8.5/profiles/specjprofile3/bin/startServer.sh server1
taskset -c 48-55 /opt/WAS8.5/profiles/specjprofile4/bin/startServer.sh server1
taskset -c 8-15  /opt/WAS8.5/profiles/specjprofile5/bin/startServer.sh server1
taskset -c 24-31 /opt/WAS8.5/profiles/specjprofile6/bin/startServer.sh server1
taskset -c 40-47 /opt/WAS8.5/profiles/specjprofile7/bin/startServer.sh server1
taskset -c 56-63 /opt/WAS8.5/profiles/specjprofile8/bin/startServer.sh server1
Interrupt Processing
Usually, the Linux kernel handles network devices by using the so called New API (NAPI), which uses interrupt mitigation techniques, in order to reduce the overhead of context switches: On low traffic network devices everything works as expected, the CPU is interrupted whenever a new packet arrives at the network interface. This gives a low latency in the processing of arriving packets, but also introduces some overhead, because the CPU has to switch its context to process the interrupt handler. Therefore, if a certain amount of packets per second arrives at a specific network device, the NAPI switches to polling mode for that high traffic device. In polling mode the interrupts are disabled and the network stack polls the device in regular intervals. It can be expected that new packets arrive between two polls on a high traffic network interface. Thus, polling for new data is more efficient than having the CPU interrupted and switching its context on every arriving packet. Polling a network device does not provide the lowest packet processing latency, though, but is throughput optimized and runs with a foreseeable and uniform work load.
IRQ Pinning
When processes are pinned to specific sets of CPUs, it can help to pin any interrupts that are used exclusively (or mostly) by those processes to the same set of CPUs. In this setup, each WAS instance was configured with its own IP address. The IP address was configured on a specific Ethernet device. The Ethernet device was handled by one or more interrupts or IRQs. Pinning the IRQs for an Ethernet device to the same set or subset of CPUs of the WebSphere Application Server (WAS) instance that has its IP address on that Ethernet device can help performance.
When you pin IRQs to CPUs, you must keep the irqbalance
service from setting the CPUs for those IRQs. The
irqbalance daemon periodically assigns the IRQs to
different CPUs depending on the current system usage. It is useful for
many system workloads, but if you leave irqbalance running
it can undo your IRQ CPU pinnings. The heavy-handed approach is to
simply turn off the irqbalance service and keep it from
starting on boot up.
# service irqbalance stop
# chkconfig irqbalance off
If you need the irqbalance service to continue to
balance the IRQs that you don't pin, then you can configure
irqbalance not to change the CPU pinnings for IRQs you
pinned. In the /etc/sysconfig/irqbalance file, set the
IRQBALANCE_ARGS parameter to ban irqbalance
from changing the CPU pinnings for your IRQs.
IRQBALANCE_ARGS="--banirq=34 --banirq=35 --banirq=36 --banirq=37 --banirq=38 --banirq=39 --banirq=40 --banirq=41"You must restart the irqbalance service for the changes
to take effect.
To pin the IRQs for an Ethernet device to a CPU or set of CPUs, first
you need to find the IRQ numbers the Ethernet device is using. They can
be found in the /proc/interrupts file.
- The first column in the file lists the IRQs currently being used by the system, each IRQ has its own row
- The following columns, one for each CPU in the system, list how many times the IRQ was handled on a specific CPU. In the example below, the columns for CPUs beyond CPU1 have been deleted. The file gets very wide when the system has a lot of CPUs.
- The last column lists the name of the IRQ.
In the example that follows, you can see that Ethernet device eth0 has IRQs 34, 35, 36, and 37, and eth1 has IRQs 38, 39, 40, and 41. It is best to read the rows from right to left. Find the device name in the last column, then look at the beginning of the row to determine the assigned IRQ.
           CPU0           CPU1      <additional CPU columns deleted>
 16:       3546          16486      ...     IPI
 29:      17452              0      ...     qla2xxx (default)
 30:       4303              0      ...     qla2xxx (rsp_q)
 31:        133              0      ...     qla2xxx (default)
 32:          0              0      ...     qla2xxx (rsp_q)
 33:     417366              0      ...     ipr
 34:    8568860              0      ...     eth0-q0
 35:         16              0      ...     eth0-q1
 36:          4              0      ...     eth0-q2
 37:          5              0      ...     eth0-q3
 38:        109              0      ...     eth1-q0
 39:          0              0      ...     eth1-q1
 40:          3              0      ...     eth1-q2
 41:          0              0      ...     eth1-q3
The CPUs an IRQ is allowed to run on are in the
/proc/irq/<irq-number>/smp_affinity file. The file
contains a hexadecimal bit-mask of the CPUs on which the IRQ is allowed
to run. The low order bit is CPU 0. Some Linux distributions also have a
/proc/irq/<irq-number>/smp_affinity_list file that
has the CPU list in human readable form. These files are writable; you
can set the CPUs an IRQ is allowed to run on by writing a new value to
the file.
Now, let's say that the first WAS instance is pinned to CPUs 0-3 and that its IP address is on eth0, and that the second WAS instance is pinned to CPUs 4-7 and that its IP address is on eth1. You could pin each of the four IRQs for eth0 to each of the four CPUs to which the first WAS instance is bound, and pin each of the four IRQs for eth1 to each of the four CPUs to which the second WAS instance is bound.
To specify the CPU numbers with a hexadecimal bit-mask, you would
write to the smp_affinity file.
# echo 00000001 > /proc/irq/34/smp_affinity
# echo 00000002 > /proc/irq/35/smp_affinity
# echo 00000004 > /proc/irq/36/smp_affinity
# echo 00000008 > /proc/irq/37/smp_affinity
# echo 00000010 > /proc/irq/38/smp_affinity
# echo 00000020 > /proc/irq/39/smp_affinity
# echo 00000040 > /proc/irq/40/smp_affinity
# echo 00000080 > /proc/irq/41/smp_affinity
Alternatively, to specify the CPU numbers in a human readable form,
you would write to the smp_affinity_list file.
# echo 0 > /proc/irq/34/smp_affinity_list
# echo 1 > /proc/irq/35/smp_affinity_list
# echo 2 > /proc/irq/36/smp_affinity_list
# echo 3 > /proc/irq/37/smp_affinity_list
# echo 4 > /proc/irq/38/smp_affinity_list
# echo 5 > /proc/irq/39/smp_affinity_list
# echo 6 > /proc/irq/40/smp_affinity_list
# echo 7 > /proc/irq/41/smp_affinity_list
However, research has shown that the performance of the IRQ handling is better on the first SMT thread of a core. It is better to combine IRQs on the first SMT thread than to spread them out over all the SMT threads. The PowerLinux systems were configured with SMT4 enabled. The first SMT thread on a core is therefore any CPU number that is evenly divisible by four. So in this example, what you would instead want to do is pin all the IRQs for eth0 to CPU 0 and pin all the IRQs for eth1 to CPU 4.
# echo 00000001 > /proc/irq/34/smp_affinity
# echo 00000001 > /proc/irq/35/smp_affinity
# echo 00000001 > /proc/irq/36/smp_affinity
# echo 00000001 > /proc/irq/37/smp_affinity
# echo 00000010 > /proc/irq/38/smp_affinity
# echo 00000010 > /proc/irq/39/smp_affinity
# echo 00000010 > /proc/irq/40/smp_affinity
# echo 00000010 > /proc/irq/41/smp_affinity
Or, if using the smp_affinity_list file:
# echo 0 > /proc/irq/34/smp_affinity_list
# echo 0 > /proc/irq/35/smp_affinity_list
# echo 0 > /proc/irq/36/smp_affinity_list
# echo 0 > /proc/irq/37/smp_affinity_list
# echo 4 > /proc/irq/38/smp_affinity_list
# echo 4 > /proc/irq/39/smp_affinity_list
# echo 4 > /proc/irq/40/smp_affinity_list
# echo 4 > /proc/irq/41/smp_affinity_list
Interrupt Coalescing
Most modern network adapters have settings for coalescing interrupts. In interrupt coalescing, the adapter collects multiple network packets and then delivers the packets to the operating system on a single interrupt. The advantage of interrupt coalescing is that it decreases CPU utilization since the CPU does not have to run the entire interrupt code path for every network packet. The disadvantage of interrupt coalescing is that it can delay the delivery of network packets, which can hurt workloads that depend on low network latency. The SPECjEnterprise workload is not sensitive to network latency. For SPECjEnterprise, it is better to conserve CPU utilization, freeing it up for the applications such as WebSphere and DB2.
On some network adapters the coalescing settings are command line
parameters specified when the kernel module for the network adapter is
loaded. On the Chelseo and Intel adapters used in this setup, the
coalescing settings are changed with the ethtool utility.
To see the coalescing settings for an Ethernet device run
ethtool with the -c option.
# ethtool -c eth2
Coalesce parameters for eth2:
Adaptive RX: off  TX: off
stats-block-usecs: 0
sample-interval: 0
pkt-rate-low: 0
pkt-rate-high: 0

rx-usecs: 3
rx-frames: 0
rx-usecs-irq: 0
rx-frames-irq: 0

tx-usecs: 0
tx-frames: 0
tx-usecs-irq: 0
tx-frames-irq: 0

rx-usecs-low: 0
rx-frame-low: 0
tx-usecs-low: 0
tx-frame-low: 0

rx-usecs-high: 0
rx-frame-high: 0
tx-usecs-high: 0
tx-frame-high: 0
Many modern network adapters have adaptive coalescing that analyzes the network frame rate and frame sizes and dynamically sets the coalescing parameters based on the current load. Sometimes the adaptive coalescing doesn't do what is optimal for the current workload and it becomes necessary to manually set the coalescing parameters. Coalescing parameters are set in one of two basic ways. One way is to specify a timeout. The adapter holds network frames until a specified timeout and then delivers all the frames it collected. The second way is to specify a number of frames. The adapter holds network frames until it collects the specified number of frames and then delivers all the frames it collected. A combination of the two is usually used.
To set the coalescing settings for an Ethernet device, use the
-C option for ethtool and specify the settings
you want to change and their new values. This workload benefited from
setting the receive timeout on the WebSphere server to 200 microseconds,
the maximum allowed by the Chelseo driver, and disabling the frame count
threshold.
ethtool -C eth4 rx-usecs 200 rx-frames 0
ethtool -C eth5 rx-usecs 200 rx-frames 0
ethtool -C eth6 rx-usecs 200 rx-frames 0
ethtool -C eth7 rx-usecs 200 rx-frames 0
On the database server, increasing the receive timeout to 100 microseconds was sufficient to gain some efficiency. The database server had plenty of idle CPU time, so it was not necessary to conserve CPU utilization.
ethtool -C eth2 rx-usecs 100
ethtool -C eth3 rx-usecs 100
ethtool -C eth4 rx-usecs 100
ethtool -C eth5 rx-usecs 100
Consider Disabling IPv6
If IPv6 is not used, consider disabling it completely for a potential boost. IPv6 support can be disabled in the Linux kernel by adding the following options to the kernel command line in the boot loader configuration.
ipv6.disable_ipv6=1 ipv6.disable=1Disabling IPv6 support in the Linux kernel guarantees that no IPv6
code will ever be run as long as the system is booted. That may be too
heavy-handed. A lighter touch is to let the kernel boot with IPv6
support and then disable it. This may be done by adding
net.ipv6.conf.all.disable_ipv6=1 to
/etc/sysctl.conf and running sysctl -p and
rebooting. Alternatively, diable IPv6 on particular interfaces with
net.ipv6.conf.eth0.disable_ipv6=1.
Huge Pages
The default page size is 4KB. Large pages on Linux are called huge
pages, and they are commonly 2MB or 1GB (depending on the processor). In
general, large pages perform better for most non-memory constrained
workloads because of fewer and faster CPU translation lookaside buffer
(TLB) misses. There are two types of huge pages: the newer transparent
huge pages (AnonHugePages in /proc/meminfo)
and the older hugetlb (HugePages_Total in
/proc/meminfo). In general, transparent huge pages are
preferred.
Note that there are some potential negatives to huge pages:
huge page use can increase memory pressure, add latency for minor pages faults, and add overhead when splitting huge pages or coalescing normal sized pages into huge pages
Transparent Huge Pages
In recent kernel versions, transparent huge pages (THP) support is enabled by default and automatically tries to use huge pages. The status of THP can be checked with:
$ cat /sys/kernel/mm/transparent_hugepage/enabled
[always] never
The number of anonymous huge pages allocated can be found in /proc/meminfo
$ grep AnonHuge /proc/meminfo
AnonHugePages:   1417216 kB
Transparent huge pages use the khugepaged daemon to periodically defragment memory to make it available for future THP allocations. If this causes problems with high CPU usage, defrag may be disabled, at the cost of potentially lower usage of huge pages:
It's also possible to limit defragmentation
efforts in the VM to generate hugepages in case they're not
immediately free to madvise regions or to never try to defrag memory and
simply fallback to regular pages unless hugepages are immediately
available. Clearly if we spend CPU time to defrag memory, we would
expect to gain even more by the fact we use hugepages later instead of
regular pages. This isn't always guaranteed, but it may be more likely
in case the allocation is for a MADV_HUGEPAGE region.
echo always > /sys/kernel/mm/transparent_hugepage/defrag
echo madvise > /sys/kernel/mm/transparent_hugepage/defrag
echo never > /sys/kernel/mm/transparent_hugepage/defrag
AnonHugePages is a subset of AnonPages.
You can check for transparent huge page usage by process in /proc/PID/smaps and look for AnonHugePages.
Important notes about THP:
[THP] requires no modifications for applications to take advantage of it.
An application may mmap a large region but only touch 1 byte of it, in that case a 2M page might be allocated instead of a 4k page for no good. This is why it's possible to disable hugepages system-wide and to only have them inside MADV_HUGEPAGE madvise regions.
The amount of memory dedicated to page tables can be found with grep PageTables /proc/meminfo
If your architecture is NUMA and kernel is >= 2.6.14, the huge
pages are per
NUMA node and so you can see the total huge pages allocated to a
process by adding the "huge" elements across nodes in
/proc/PID/numa_maps.
Show huge page layout per NUMA node:
cat /sys/devices/system/node/node*/meminfohugetlb
The older method to use huge pages involves libhugetlbfs
and complex administration. Note:
Pages that are used as huge pages are reserved inside the kernel and cannot be used for other purposes. Huge pages cannot be swapped out under memory pressure.
/proc/meminfo contains information on libhugetlbfs usage:
HugePages_Total is the size of the pool of huge pages.
HugePages_Free  is the number of huge pages in the pool that are not yet
                allocated.
HugePages_Rsvd  is short for "reserved," and is the number of huge pages for
                which a commitment to allocate from the pool has been made,
                but no allocation has yet been made.  Reserved huge pages
                guarantee that an application will be able to allocate a
                huge page from the pool of huge pages at fault time.
HugePages_Surp  is short for "surplus," and is the number of huge pages in
                the pool above the value in /proc/sys/vm/nr_hugepages. The
                maximum number of surplus huge pages is controlled by
                /proc/sys/vm/nr_overcommit_hugepages.
Hugepagesize    is the size of each huge page.
The number of hugetlb pages in use is:
HugePages_Total - HugePages_Free + HugePages_ReservedFor example:
HugePages_Total:    8192
HugePages_Free:     1024
HugePages_Rsvd:     1024
HugePages_Surp:        0
Hugepagesize:       2048 kB
In this example, there are no hugetlb pages in use, although 1GB is reserved by some processes.
Note that when using hugetlb, RSS for the
process is not accounted for properly (this is not true of THP; THP
accounts into RSS properly) and instead is accounted
for in /proc/meminfo:
"Shared_Hugetlb" and "Private_Hugetlb" show the ammounts of memory backed by hugetlbfs page which is *not* counted in "RSS" or "PSS" field for historical reasons. And these are not included in {Shared,Private}_{Clean,Dirty} field.
Process Limits
Review the operating system section on process limits which is generally summarized as:
ulimit -c unlimited
ulimit -f unlimited
ulimit -u unlimited
ulimit -n unlimited
ulimit -d unlimited
Kernel Limits
The maximum number of processes and threads is controlled by /proc/sys/kernel/threads-max:
"This file specifies the system-wide limit on the number of threads
(tasks) that can be created on the system." Each thread also has a
maximum stack size, so virtual and physical memory must support your
requirements.
The maximum number of PIDs is controlled by /proc/sys/kernel/pid_max:
"This file specifies the value at which PIDs wrap around (i.e., the
value in this file is one greater than the maximum PID). The default
value for this file, 32768, results in the same range of PIDs as on
earlier kernels. On 32-bit platforms, 32768 is the maximum value for
pid_max. On 64-bit systems, pid_max can be set
to any value up to 2^22 (PID_MAX_LIMIT, approximately 4
million)."
Crontab
Review all users' crontabs and the processing that they do. Some built-in crontab processing such as monitoring and file search may have significant performance impacts.
Processor Scheduling
The Linux Completely Fair Scheduler (CFS) may affect IBM Java performance:
The Linux Completely Fair Scheduler (CFS) first appeared in the 2.6.23 release of the Linux kernel in October 2007. The algorithms used in the CFS provide efficient scheduling for a wide variety of system and workloads. However, for this particular workload there is one behavior of the CFS that cost a few percent of CPU utilization.
In the CFS, a thread that submits I/O, blocks and then is notified of the I/O completion preempts the currently running thread and is run instead. This behavior is great for applications such as video streaming that need to have low latency for handling the I/O, but it can actually hurt SPECjEnterprise performance. In SPECjEnterprise, when a thread submits I/O, such as sending a response out on the network, the I/O thread is in no hurry to handle the I/O completion. Upon I/O completion, the thread is simply finished with its work. Moreover, when an I/O completion thread preempts the current running thread, it prevents the current thread from making progress. And when it preempts the current thread it can ruin some of the cache warmth that the thread has created. Since there is no immediate need to handle the I/O completion, the current thread should be allowed to run. The I/O completion thread should be scheduled to run just like any other process.
The CFS has a list of scheduling features that can be enabled or disabled. The setting of these features is available through the debugfs file system. One of the features is WAKEUP_PREEMPT. It tells the scheduler that an I/O thread that was woken up should preempt the currently running thread, which is the default behavior as described above. To disable this feature, you set NO_WAKEUP_PREEMPT (not to be confused with NO_WAKEUP_PREEMPTION) in the scheduler's features.
mount -t debugfs debugfs /sys/kernel/debug
echo NO_WAKEUP_PREEMPT > /sys/kernel/debug/sched_features
umount /sys/kernel/debug
Unfortunately, the NO_WAKEUP_PREEMPT scheduler feature was removed in Linux kernel version 3.2. It is and will be available in the RedHat Enterprise Linux 6 releases. It is not available in the latest SUSE Linux Enterprise Server 11 Service Pack 2. There are some other scheduler settings that can achieve close to the same behavior as NO_WAKEUP_PREEMPT.
You can use the
sched_min_granularity_nsparameter to disable preemption.sched_min_granularity_nsis the number of nanoseconds a process is guaranteed to run before it can be preempted. Setting the parameter to one half of the value of thesched_latency_nsparameter effectively disables preemption.sched_latency_nsis the period over which CFS tries to fairly schedule all the tasks on the runqueue. All of the tasks on the runqueue are guaranteed to be scheduled once within this period. So, the greatest amount of time a task can be given to run is inversely correlated with the number of tasks; fewer tasks means they each get to run longer. Since the smallest number of tasks needed for one to preempt another is two, settingsched_min_granularity_nsto half ofsched_latency_nsmeans the second task will not be allowed to preempt the first task.The scheduling parameters are located in the
/proc/sys/kernel/directory. Here is some sample bash code for disabling preemption.# LATENCY=$(cat /proc/sys/kernel/sched_latency_ns) # echo $((LATENCY/2)) > /proc/sys/kernel/sched_min_granularity_nsThe parameter
sched_wakeup_granularity_nsis similar to thesched_min_granularity_nsparameter. The documentation is a little fuzzy on how this parameter actually works. It controls the ability of tasks being woken to preempt the current task. The smaller the value, the easier it is for the task to force the preemption. Settingsched_wakeup_granularity_nsto one half ofsched_latency_nscan also help alleviate the scheduling preemption problem.
IBM Java on Linux
In some cases, -Xthr:noCfsYield
and -Xthr:minimizeUserCPU may improve performance.
systemd
systemd and WebSphere
Example service
- Create
/etc/systemd/system/wlp.servicewith the contents:[Unit] Description=wlp Wants=network-online.target After=network-online.target [Service] ExecStart=/opt/ibm/wlp/bin/server start ExecStop=/opt/ibm/wlp/bin/server stop User=someuser Environment=JAVA_HOME=/opt/ibm/java Type=forking Restart=always PIDFile=/opt/ibm/wlp/usr/servers/.pid/defaultServer.pid [Install] WantedBy=multi-user.target - Reload systemd configuration:
systemctl daemon-reload - Start the service:
systemctl start wlp - If you want to start the service after reboot:
systemctl enable wlp
Showing service status
Example:
systemctl --no-pager status wlpsystemd Tips
systemd-analyze blameto review potential causes of slow boot times
Other Tips
- Print kernel boot parameters:
cat /proc/cmdline - Print current
kernel log levels:
cat /proc/sys/kernel/printk - Change kernel log level:
echo 5 > /proc/sys/kernel/printk
Linux on Power
The default page size on Linux on Power is 64KB
Some workloads benefit from lower SMT hardware thread values.
Running profile
on Linux on Power.
-Xnodfpbd
Consider testing with -Xnodfpbd because "The hardware
instructions can be slow."
Hardware Prefetching
Consider disabling hardware prefetching because Java does it in software. "[Use] the ppc64_cpu utility (available in the powerpc-utils package) to set the pre-fetch depth to 1 (none) in the DSCR."
# ppc64_cpu --dscr=1Idle Power Saver
Idle Power Saver, [which is enabled by default], will put the processor into a power saving mode when it detects that utilization has gone below a certain threshold for a specified amount of time. Switching the processor into and out of power saving mode takes time. For sustained peak performance it is best not to let the system drop into power saving mode. Idle Power Saver can be disabled by using the web interface to the Advanced System Management Interface (ASMI) console. Navigate to System Configuration -> Power Management -> Idle Power Saver. Set the Idle Power Saver value to Disabled, then click on the "Save settings" button on the bottom of the page.
Adaptive Frequency Boost
The Adaptive Frequency Boost feature allows the system to increase the clock speed for the processors beyond their nominal speed as long as environmental conditions allow it, for example, the processor temperature is not too high. Adaptive Frequency Boost is enabled by default. The setting can be verified (or enabled if it is disabled) by using the web interface to the Advanced System Management Interface (ASMI) console. Navigate to Performance Setup -> Adaptive Frequency Boost. Change the setting to Enabled, then click on the "Save settings" button.
Dynamic Power Saver (Favor Performance) Mode
The PowerLinux systems have a feature called Dynamic Power Saver that will dynamically adjust the processor frequencies to save energy based on the current processor utilization. The Dynamic Power Saver mode can be set to favor performance by using the web interface to the ASMI console. Navigate to System Configuration -> Power Management -> Power Mode Setup. Select Enable Dynamic Power Saver (favor performance) mode, then click on the "Continue" button.
64-bit DMA Adapter Slots for Network Adapters
The 64-bit direct memory access (DMA) adapter slots are a feature on the newer IBM POWER7+ systems. 64-bit DMA enables a faster data transfer between I/O cards and the system by using a larger DMA window, possibly covering all memory. On the PowerLinux 7R2 system, two of the adapter slots, slots 2 and 5, are enabled with 64-bit DMA support. On each system the two network cards were installed in the two 64-bit DMA slots. Using the 64-bit DMA slots resulted in a noticeable improvement in network performance and CPU utilization.
Scaling Up or Out
One question for tuning a multi-threaded workload for increased capacity is whether to scale up by adding more processor cores to an instance of an application or to scale out by increasing the number of application instances, keeping the number of processor cores per application instance the same.
The performance analysis for this workload on the Power architecture has shown that the WebSphere Application Server (WAS) performs best with two processor cores and their attending SMT threads. Therefore, when increasing the capacity of a POWER system running WAS it is best to increase the number of WAS instances, giving each instance two processor cores. The WAS setup for SPECjEnterprise2010 ran eight WAS instances.
...
[If] the WAS instances have to listen on the same port... By default, a WAS instance is configured with multi-home enabled, which means it listens for requests on its port on all of the IP addresses on the system. If multiple WAS instances are running, they cannot all be allowed to listen for requests on all the IP addresses. They would end up stepping on each other and would not function correctly. If multiple WAS instances are running, multi-home must be disabled and each WAS instance must be configured to listen on a different IP address. For instructions on how to configure an application server to use a single network interface, see Configuring an application server to use a single network interface [4] in the WebSphere Application Server Version 8.5 Information Center.
...
Since a system cannot have multiple IP addresses on the same subnet, the IP address of each WAS instance must be on its own Ethernet device. This can easily be done if the number of Ethernet devices on the system is greater than or equal to the number of WAS instances, the IP addresses for the WAS instances can each be put on their own Ethernet device.
If the system has fewer Ethernet devices than the number of WAS instances, then aliases can be used to create multiple virtual devices on a single physical Ethernet device. See section 9.2.8. Alias and Clone Files [5] of the Red Hat Enterprise Linux 6 Deployment Guide for details on how to configure an alias interface.
Linux on System z (zLinux, s390)
Test setting QUICKDSP:
In general, we recommend setting QUICKDSP on for production guests and server virtual machines that perform critical system functions.
You can get a sense of the system your Linux virtual server is running on by issuing cat /proc/sysinfo
The zLinux "architecture" is sometimes referred to as s390.
z/VM has three storage areas: central store (cstore), expanded store (xstore), and page volumes. The first two are RAM and the last is disk.
Discontiguous Saved Segments (DCSS)
Discontiguous Saved Segments (DCSS) may be mounted in zLinux to share data across guests, thus potentially reducing physical memory usage. DCSS can also be used as an in-memory filesystem.