WAS traditional on z/OS
WAS traditional on z/OS Recipe
- Consider increasing the TCP
listenBacklogto at least 100 from the default of 10. - Consider tuning TCP buffer sizes.
- Consider classifying address spaces as per general best practices.
- Consider enabling and reviewing SMF 120 Subtype 9 records.
- Consider enabling and reviewing SMF 72.3 Workload Activity Reports.
- Consider enabling and reviewing the WLM Delay Monitoring Report.
- Consider classifying workload into individually tuned WLM transaction/service/report classes with a classification file.
- Review common WAS on z/OS considerations
SMF 120 Records
SMF
Type 120 records provide various performance statistics. Subtype 9
records generally supersede and
subsume subtype 1-8 records. Subtype 9 records also tend to be more
accurate and lower overhead. In general, the overhead of SMF120.9s is
less than about 2%. Enable
SMF 120.9 records with
server_SMF_request_activity_enabled = 1.
In general, never use subtype 1 - 8 records. Interval records (e.g. subtypes 3 and 6) might seem like they can be used to reduce volume compared to subtype 9 since data is averaged over the internal; however, the problem is that everything except subtype 9 has significant performance overhead of up to 20% because all of the data is gathered (in a less efficient way than subtype 9) and then it's averaged after-the-fact, instead of being averaged as the data is gathered. If subtype 9 volume is too high, instead, in addition to considering subtype 9 for some subset of servers, for the rest, instead of using interval records, use subtype records but use a transaction classification XML file to only capture subtype 9s on the most important things or a sampling of some common activity to reduce the volume.
Process and Review SMF 120.9 records
First, format the output data set.
One way to analyze is to post-process the output data set using SMF_WAS_PLUGINS.
Confirm 120 record counts
To get statistics on the LPARs and record types:
java -Xmx1g "-Dcom.ibm.ws390.smf.dateTimeFormat=yyyy-MM-dd'T'HH:mm:ss.SSSZ" -DPRINT_WRAPPER=false -jar smftools.jar "INFILE(DATASET)"Example output:
SMF Data for system ABCD covering Mon Dec 11 12:30:00 GMT 2023 to Mon Dec 11 14:29:59 GMT 2023
 Record Type      Records  %Total   Avg Length   Min Length   Max Length
          98        1,440    0.00    28,533.69       27,292       30,204
         120    4,801,374    1.00     1,680.77        1,236        6,116
       Total    4,802,814  100.00     1,688.82        1,236       30,204

SMF Data for system EFGH covering Mon Dec 11 12:30:00 GMT 2023 to Thu Dec 14 10:28:06 GMT 2023
 Record Type      Records  %Total   Avg Length   Min Length   Max Length
           2            1    0.00        14.00           14           14
           3            1    0.00        14.00           14           14
          98        1,440    0.00    27,914.16       20,124       30,524
         120    6,183,802    1.00     1,598.33        1,236        6,116
       Total    6,185,244  100.00     1,604.45           14       30,524
Total requests per server
A good place to start is to get total requests per server:
java -Xmx1g "-Dcom.ibm.ws390.smf.dateTimeFormat=yyyy-MM-dd'T'HH:mm:ss.SSSZ" -DPRINT_WRAPPER=false -jar smftools.jar "INFILE(DATASET)" "PLUGIN(com.ibm.smf.was.plugins.RequestsPerServer,STDOUT)"Response Times
Basic statistics (times are in milliseconds):
java -Xmx1g "-Dcom.ibm.ws390.smf.dateTimeFormat=yyyy-MM-dd'T'HH:mm:ss.SSSZ" -DPRINT_WRAPPER=false -jar smftools.jar "INFILE(DATASET)" "PLUGIN(com.ibm.smf.was.plugins.ResponseTimes,STDOUT)"It is often useful to break out response times over time:
java -Xmx1g "-Dcom.ibm.ws390.smf.dateTimeFormat=yyyy-MM-dd'T'HH:mm:ss.SSSZ" -DPRINT_WRAPPER=false -Dcom.ibm.ws390.smf.smf1209.useTime=RESPONDED -Dcom.ibm.ws390.smf.smf1209.breakdown=BY_SERVER -jar smftools.jar "INFILE(DATASET)" "PLUGIN(com.ibm.smf.was.plugins.ResponseTimes,STDOUT)"Distribution by servant
java -Xmx1g "-Dcom.ibm.ws390.smf.dateTimeFormat=yyyy-MM-dd'T'HH:mm:ss.SSSZ" -DPRINT_WRAPPER=false -jar smftools.jar "INFILE(DATASET)" "PLUGIN(com.ibm.smf.was.plugins.ThreadRequestDensity,STDOUT)"General Considerations
See the z/OS operating systems chapter for prerequisite knowledge.
Keep the number of nodes per local partition (LPAR) between one or two nodes with a maximum of four nodes per LPAR. Spread a cell or cluster over at least two LPARs. Using multiple LPARs ensures hardware redundancy as well, while still allowing the cluster to be upgraded on a per node basis.
IBM recommends that you install as much of the WebSphere Application Server for z/OS code in the Link Pack Area (LPA) as is reasonable. Also, ensure that you have eliminated any unnecessary STEPLIBs which can affect performance. If you must use STEPLIBs, verify that any STEPLIB DDs in the controller and servant procs do not point to any unnecessary libraries. (https://www.ibm.com/support/knowledgecenter/SSAW57_8.5.5/com.ibm.websphere.nd.multiplatform.doc/ae/rprf_tunezprogloc.html)
The first place to review is your CTRACE configuration. Ensure that all components are either set to MIN or OFF. To display the CTRACE options for all components on your system, issue the following command from the operator console: D TRACE,COMP=ALL
To change the setting for an individual component to its minimum tracing value, use the following command, where xxx is the component ID: TRACE CT,OFF,COMP=xxx
This configuration change eliminates the unnecessary overhead of collecting trace information that is not needed. Often during debug, CTRACE is turned on for a component and not shut off when the problem is resolved.
Ensure that you are not collecting more SMF data than you need. Review the SMFPRMxx settings to ensure that only the minimum number of records is collected.
The Transaction Service RLS_LOGSTREAM_COMPRESS_INTERVAL custom property can be set to a value larger than the default value if the Transaction Service is the only application component using a logstream. If none of your components are configured to use a logstream, you can set this property to 0 (zero) to disable this function. (https://www.ibm.com/support/knowledgecenter/SSAW57_8.5.5/com.ibm.websphere.nd.doc/ae/tprf_tuneappserv.html)
If you find long garbage collection pause times but the normal components of a pause (mark, sweep, compact, exclusiveaccess) do not add up to the total time, then this is usually caused by the Virtual Lookaside Facility (VLF) caching being disabled or not working efficiently.
"Ensure that ras_trace_defaultTracingLevel=0 or 1, and that ras_trace_basic and ras_trace_detail are not set." (https://www.ibm.com/support/knowledgecenter/SSAW57_8.5.5/com.ibm.websphere.nd.multiplatform.doc/ae/rprf_tuneztrace.html).
Address Spaces
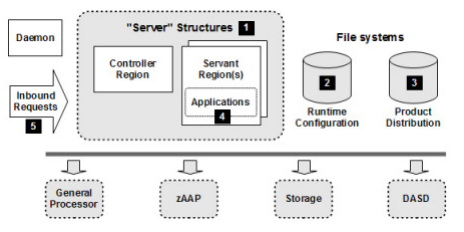
Each application server is split into two or more address spaces: a control region and one or more servant regions. The control region handles incoming traffic and distributes it to the servant regions where the application work is performed. It is a best practice to use ${X} as the control region name and ${X}S for the servant region names. For example, WBESR12 and WBESR12S.
Servants
WebSphere allows you to configure a minimum and maximum number of servants for a server. WLM will dynamically adjust the number of servants within the specified range, up or down based on what's needed to meet the goals for the system. WLM does this for work running in WebSphere and for work elsewhere on the system.
To set the minimum value, consider how many servants you want to start automatically when the server is started and how many you want WLM to keep available. In determining the maximum value, consider how many servants you can support on your system. Also, consider the number of available connectors for applications in WebSphere and elsewhere in the system.
But what if something changes someday and the minimum just is not enough? Or, you reach the configured maximum and need more servants? To change the values, you must update the configuration and recycle the server. But if you are running at peak utilization and decide you need to increase the maximum number of servants; recycling the whole server is probably going to hurt more than just not having enough servants. It would be nice to be able to dynamically change the number of servants without a recycle.
In Version 7, we introduced a new MODIFY command to let you do that. If the server is not configured as single-servant, you can change the current minimum and maximum number of servants. You enter the command as follows:
MODIFY server,WLM_MIN_MAX=(minimum,maximum)
Specify these values as decimal numbers. Obviously, the minimum must be less than the maximum.
Your changes are in effect until the next time you recycle the server, in which case, the values in the configuration are used instead. To make your changes permanent, you need to update the configuration.
In general, WLM responds quickly to your request. If the minimum number of servants is not already running, WLM starts more. Increasing the maximum value, however, might not have any immediate effect. Further, decreases in values might also not cause an immediate change because of WLM's opinion as to how many servants it needs. Some situations, such as session data pinned to the servant, might prevent WLM from reducing the number of currently active servants. Of course, unless you've committed your min and max values to memory, you would probably like to have a quick way to see what you are currently configured for. We added a new command to allow you to do that.
MODIFY server,DISPLAY,WLM
Start servants in parallel: wlm_servant_start_parallel=1 (http://www-03.ibm.com/support/techdocs/atsmastr.nsf/5cb5ed706d254a8186256c71006d2e0a/da939fa8cdf48510862575a1007461d2/$FILE/WP101464%20-%20WebSphere%20zOS%20Hidden%20Gems2.pdf)
All of the various custom properties, environment variables, etc. that are set in the WAS configuration (e.g. through the admin console) ultimately get generated into the was.env file (located under profiles/default/config/cells/cellname/nodes/nodename/servers/servername/was.env) which is read when the address space starts.
Contraction
First, with proper idle tuning and disabling Intelligent Management if not used, CPU usage of unused servants is expected to be very low. For further profiling and tuning, use the IBM Java Health Center profiler. If the concern for unused servants is virtual storage usage, note that it's generally not recommended to overcommit memory. Finally, if work is being distributed unevenly between servants, this should not impact overall processor usage.
Nevertheless, if for whatever reason you would like to contract
servants by setting the minimum number
of servants less than the maximum, the way this works is that every
10 minutes, WLM considers if there are excess servants above the minimum
with no outstanding affined work. This is a conservative judgment
because starting and stopping servants is itself an intensive process.
If WLM decides a servant is no longer needed, it first unbinds it from
the service class (because a different service class may need it). After
further time, if the servant still isn't needed, then it will be fully
destroyed. There is an explicit WLM_MIN_MAX
MODIFY command; however, this is primarily used to adjust the
minimum to request adding servants whereas reducing the minimum is still
very conservative.
For details, see https://www-03.ibm.com/support/techdocs/atsmastr.nsf/002573f7000ac64286256c71006d2e0a/f1ec690b6bee04cd8625778800595c69/$FILE/WP101740%20-%20WAS_and_zOS_WLM_v8.pdf#page=19 and https://dx.doi.org/10.5445/KSP/1000034624
Control Region
The default value of worker threads in a control region is 25. This can be changed to a higher value as required by setting customer property was.controlThreads as follows:
Application servers > server_name > Container Services > ORB Service > Custom Properties > was.controlThreads
To verify how many control region threads you are using, you can check the following message in the control region joblog:
BBOM0001I control_region_thread_pool_size: 25.Starting in WAS 8.0.0.8 and 8.5.5.2 (PM85194), use the property control_region_thread_pool_maximum_size to allow growth of this pool, or set to 0 to allow dynamic calculation of the size (see also PI50098).
Daemon
"Stopping a Daemon server will stop all servers for that cell on that... image. This is because of the way servers for that cell... access key LPA modules. It's done "through" the Daemon server. Stopping the Daemon server means the servers can no longer access those modules, so they too stop." (http://www-01.ibm.com/support/docview.wss?uid=tss1wp100396&aid=3)
Thread Pools
Most work in the servant is handled by the ORB thread pool. The maximum size of this pool is controlled by the ORB workload profile setting: https://www.ibm.com/support/knowledgecenter/SSAW57_8.5.5/com.ibm.websphere.nd.multiplatform.doc/ae/tgrid_zosthreads.html
- IOBOUND: Default - Number of threads is 3 * Number of processors. Specifies more threads in applications that perform I/O-intensive processing on the z/OS operating system. The calculation of the thread number is based on the number of processors. IOBOUND is used by most applications that have a balance of processor intensive and remote operation calls. A batch job is an example that uses the IOBOUND profile.
- CPUBOUND: Number of threads is the number of processors. Specifies that the application performs processor-intensive operations on the z/OS operating system, and therefore, would not benefit from more threads than the number of processors. The calculation of the thread number is based on the number of processors. Use the CPUBOUND profile setting in processor intensive applications, like compute-intensive (CI) jobs, XML parsing, and XML document construction, where the vast majority of the application response time is spent using the processor.
- LONGWAIT: Number of threads is 40. Specifies more threads than IOBOUND for application processing. LONGWAIT spends most of its time waiting for network or remote operations to complete. Use this setting when the application makes frequent calls to another application system, like Customer Information Control System (CICS) screen scraper applications, but does not do much of its own processing.
- In WebSphere Application Server for z/OS V7 you can choose Workload profile CUSTOM and then set property servant_region_custom_thread_count to the number of servant threads you want up to a limit of 100.
BBOO0234I SERVANT PROCESS THREAD COUNT IS X
WAS 7 on z/OS introduced the ability to interrupt hung threads: http://www-03.ibm.com/support/techdocs/atsmastr.nsf/5cb5ed706d254a8186256c71006d2e0a/3c02b79e79ea32fd8625751a005d7f63/$FILE/WP101374%20-%20WebSphere%20zOS%20V7%20Dispatch%20Timeout%20Improvements.pdf. This was improved in WAS 8: http://w3-03.ibm.com/support/techdocs/atsmastr.nsf/3af3af29ce1f19cf86256c7100727a9f/d7bb7aa1f7be24128625791e00830412/$FILE/WP101992%20-%20WebSphere%20zOS%20V8%20Hidden%20Gems.pdf
Joblogs
Type ? next to the WAS servant region in the SDSF.DA or SDFS.ST panels. Roughly speaking, SYSPRINT is equivalent to SystemOut.log and SYSOUT is equivalent to SystemErr.log + native_stderr.log
Common things to look for in WAS joblogs:
- Search for the word HOST by typing F HOST and F5 to repeat search
- Hostname: com.ibm.CORBA.LocalHost = ZTESTB2.PDL.POK.IBM.COM
- Search for the word LEVEL by typing F LEVEL and F5 to repeat search
- WAS Level: BBOM0007I CURRENT CB SERVICE LEVEL IS build level 6.1.0.32 (AM24112) release WAS61.ZNATV date 10/10/10 19:40:16.
- Search for the word cell_name
- Cell name: cell_name: wbecell.
- Search for the word PROCEDURE by typing F PROCEDURE and F5 to repeat
- PROCLIB: PROCEDURE WBESS62 WAS EXPANDED USING SYSTEM LIBRARY USER.S12.PROCLIB
- Search for the word WAS_HOMe by typing F WAS_HOME and F5 to repeat
- WAS_HOME: BBOM0001I adjunct_region_jvm_properties_file: /S12/wbe61/wbes12/AppServer/profiles/default/config/cells/ws/wbenode2/servers/wbesr12/adjunct.jvm.options.
Timeouts
zIIP/zAAP Usage
In general, WAS traditional on z/OS is mostly Java so it mostly offloads to zIIPs (other than small bits such as creating WLM enclaves, SAF, writing SMF records, etc.). Even if application processing hands-off to non-zIIP-eligible native code (e.g. third party JNI), recent versions of z/OS (with APAR OA26713) have a lazy-switch design in which short bursts of such native code may stay on the zIIP and not switch to GCPs. For non-zIIP-eligible native code such as the type 2 DB2 driver, some of that may use zAAPs and total processor usage compared to type 4 depends on various factors and may be lower.
WLM
WebSphere has several different types of work running in its address spaces. It is classified using classification rules under 3 different workloads:
- For STC workloads the WebSphere address spaces control regions and servant regions would be given an aggressive Velocity goal equal to or slightly less than DB2, IMS, or MQ and a goal equal to or slightly higher than CICS.
- For OMVS workloads the WebSphere address spaces control regions and servant regions would be given an aggressive Velocity goal so that at start-up the BPXBATCH facility used to run our applyPTF.sh script does not slow startup of the server.
- For CB workloads the WebSphere Servant Regions are given a Response time with percentile goal close to but not to exceed 90% of the work in .5 seconds. Even though WebSphere servers are long running tasks, typically Velocity goals are used for long running tasks, the actual transactions within WebSphere are very short lived HTTP type transactions. Response times with percentile goals are used for these short lived transactions.
The report classes associated with the classification rule for each workload would be unique.
Workload CB is enclave work or WLM queue managed WebSphere work. Almost all WebSphere work happens here after the initial startup of the address spaces.
STC work also occurs in the WebSphere address spaces:
- The processing necessary to start the address spaces before the first enclave is created is STC workload.
- Any spawned threads from the application will not be enclave, WLM, or CB managed work and will run under STC.
- Address space functions such as JES related activities will be STC workload.
- An argument can be made that says Garbage Collection activities run under STC workload.
Rarely use discretionary classification for WebSphere. If there is only a single service class, then all work occurs in that service class (i.e. overflow work would not go into, for example, a discretionary servie class).
OMVS work also occurs in the WebSphere Address Spaces. During startup a program called BPXBATCH is executed to run a script in the JCL. This script called applyPTF.sh checks to see if any service has been applied. If service has been applied this script executes any post install actions necessary. If startup is very slow, you may want to investigate a classification rule for OMVS. If the combination of applyPTF.sh and lack of classification are the cause of the slow startup, adding a classification rule may fix the slow start problem.
More on WAS with WLM: https://www-03.ibm.com/support/techdocs/atsmastr.nsf/002573f7000ac64286256c71006d2e0a/f1ec690b6bee04cd8625778800595c69/$FILE/WP101740%20-%20WAS_and_zOS_WLM_v8.pdf
WebSphere creates a WLM enclave for all requests that get dispatched in a servant. An enclave has an associated WLM service class and report class. The service class is used by WLM to help make decisions about assigning resources to the servant to ensure the requests meet the goals defined in the service class. The report class is used to separate information about the requests in reports generated by RMF (or other similar products). To determine which service class and report class to assign to the enclave, WLM looks at classification information provided by WebSphere when the enclave is created.
One piece of information provided is called a transaction class. This is just an eight character name assigned to the request. WebSphere supports an XML file pointed to by the variable wlm_classification_file to determine what transaction class to use. The XML file allows you to specify a different transaction class (and thus indirectly a different service class and report class) for different applications or even parts of applications.
The XML file also allows you to specify a transaction class to be used when classifying requests that are internally generated. Sometimes the controller needs to dispatch something in its own servant. For example, this could be the dispatch of a management bean (MBean). To separate internal work from application work, you might want to put these requests in their own report class. To do that you simply specify the 'internal' clause in the XML file and provide a transaction class name that WLM will recognize (based on the rules you provide in the WLM configuration) and assign service and report classes appropriately.
WLMStatefulSession
Note that wlm_stateful_session_placement_on
is not true round robin:
When you enable [wlm_stateful_session_placement_on] [...] When a new HTTP request without affinity arrives on a work queue, the WLM checks to see if there is a servant that has at least one worker thread waiting for work. If there are no available worker threads in any servants, WLM queues the request until a worker thread in any of the servants becomes available. If there are available worker threads, WLM finds the servant with the smallest number of affinities. If there are servant regions with equal number of affinities, then WLM dispatches the work to the servant region with the smaller number of busy server threads. The goal of this algorithm is for WLM to balance the incoming requests without servant affinity among waiting servants while considering changing conditions. The algorithm does not blindly assign requests to servers in a true round-robin manner. [...] This distribution mechanism works for all inbound requests without affinity. After the HTTP session object is created, all the client requests are directed to that servant until the HTTP session object is removed.
Links:
SMF 120
Details on 120-9 records in WP-101342
JVM.dumpThreads
The environment variable wsadmin_dumpthreads_enable_javatdump defaults to 1. This means that when the JVM.dumpThreads MBean is called such as through wsadmin, the Administrative Console Java dumps and cores, diagnostic plans, and so on, in addition to the requested javacore, a SYSTDUMP will also be taken. A javacore is designed to be a lightweight diagnostic to investigate hangs, high CPU, and performance issues. It usually takes less than a few hundred milliseconds to gather and is just a few MB in size. On the other hand, SYSTDUMPS can take dozens of seconds to gather and are usually GB in size. There are various mechanisms to request a SYSTDUMP separate from JVM.dumpThreads so the JVM.dumpThreads mechanism in general should not be used to gather SYSTDUMPS. The default value of wsadmin_dumpthreads_enable_javatdump is a historical relic because we could not change a default value in service, but, in general, a value of 0 is recommended. This can be set at the cell level.
MODIFY Command
/F ADDRESSSPACE,... COMMANDS... or /MODIFY ADDRESSSPACE,... COMMANDS (https://www.ibm.com/support/knowledgecenter/SSAW57_8.5.5/com.ibm.websphere.nd.multiplatform.doc/ae/rxml_mvsmodify.html)
Display Java heap information: /F ADDRESSSPACE,JVMHEAP
Request javacore on control region and all servants:
MODIFY $CONTROLLER,JAVACOREThe joblog will show where it is written; for example:
JVMDUMP007I JVM Requesting Java Dump using '/var/WebSphere/home/ZPSRG/javacore.20090309.205027.50397255.txtThere's also an option to specify an ASID to avoid getting javacores for other address spaces:
/F $CONTROLLER,JAVACORE,ASIDX=F4A MODIFY command can be sent to a servant but it will not do anything other than print a message:
BBOO0152E STOP AND MODIFY COMMANDS ARE NOT SUPPORTED FOR WEBSPHERE FOR Z/OS SERVANT PROCESSESRequest stack on control region and all servants:
MODIFY $CONTROLLER,STACKTRACEPAUSELISTENERS, will cause the target server to close its listener ports and stop taking new requests
DISPLAY,SERVERS modify command has been enhanced to also report the 'state' of the server. There are four possibilities: ACTIVE, ENDING, PAUSED/STOPPING, and RECOVERY. ACTIVE seems pretty obvious. Basically ACTIVE means it isn't any of the other states; it could be up or it could be initializing. ENDING means that the server is on its way down. PAUSED/STOPPING means either you have issued PAUSELISTENERS or STOPped the server. It is kind of the same thing. In both cases the server is not taking new work, but there is a possibility work is still in-flight inside the server. The only difference is if we are stopping, then once the work completes the server will end. Finally, RECOVERY means that the server has been started to recover in-flight transactions and will automatically shut down once that is done. No new work will be taken.
BBOO0182I SERVER ASID SYSTEM LEVEL STATE
BBOO0183I WAS00 /ZWASAXXX 6Fx SY1 8.0.0.0 (ff1106.32) ACTIVE
BBOO0183I BBON001 /BBON001 58x SY1 8.0.0.0 (ff1106.32) ACTIVE
BBOO0183I BBOC001 /BBOS001 5Bx SY1 8.0.0.0 (ff1106.32) PAUSED/STOPPING
BBOO0183I BBODMGR /BBODMGR 57x SY1 8.0.0.0 (ff1106.32) ACTIVEWay back in WebSphere Version 5 we introduced the DISPLAY,WORK command (underneath the MVS 'Modify' command for the WAS controller). This pretty cool command lets you see how much work had been processed by the server since it started and how much work was actually in the server at the time. You could even look server region by server region and see how work was spreading (or not) across them. (http://www-03.ibm.com/support/techdocs/atsmastr.nsf/5cb5ed706d254a8186256c71006d2e0a/ec31a38f42faf8c486257c27005f7a64/$FILE/WP102371%20-%20New%20Functions%20in%20WAS%20zOS%20Maintenance%20Stream.pdf)
MODIFY Commands
See section above
Console Dump
Take a console dump from the operator console with the title $X of the address space with ID $Y, responding to the operator console identifier $Z returned by the DUMP command (replace X, Y, and Z):
DUMP COMM=($X)
R $Z,ASID=$Y,CONT
R $Z SDATA=(PSA,CSA,LPA,LSQA,RGN,SQA,SUM,SWA,TRT,ALLNUC,GRSQ),END
Dispatch Progress Monitor (DPM)
DPM is complementary to WAS hung thread detection, although it provides many more z/OS-related details: https://www.ibm.com/support/knowledgecenter/en/SSAW57_9.0.5/com.ibm.websphere.nd.multiplatform.doc/ae/tprf_monitor_dispatch_requests.html
The maximum treshold is 255 seconds, so if you want a larger threshold, use WAS hung thread detection instead.
Example of dynamically enable DPM to dump stack traces to the joblogs for requests taking more than 30 seconds:
MODIFY $JOB,DPM,HTTP=30
MODIFY $JOB,DPM,HTTPS=30
MODIFY $JOB,DPM,DUMP_ACTION=TRACEBACK
Or to dump javacores for MDBs taking longer than 30 seconds:
MODIFY $JOB,DPM,MDB=200
MODIFY $JOB,DPM,DUMP_ACTION=JAVACORE
The documentation discusses INTERVAL but that is not the
interval at which DPM checks; that's just a short-hand for setting the
threshold as set above but for all protocols.
To display active DPMs, look for non-RESET values:
MODIFY $JOB,DISPLAY,DPM
BBOO0361I DISPATCH PROGRESS MONITOR (DPM) SETTINGS:IIOP(RESET):HTTP(030):HTTPS(030):MDB(RESET):SIP(RESET):SIPS(RESET):OLA(RESET):CRA(RESET) DUMP_ACTION(RESET)
Dynamically disable DPM:
MODIFY $JOB,DPM,RESET_ALLAcquire console dump with DPM
Set DPM trigger after X elapsed seconds (replace
$addressspaceto match):F $addressspace,dpm,HTTP=X,HTTPS=X,dump_action=TRACEBACKChange the protocol if the work comes in through some method other than HTTP such as MDB. See https://www.ibm.com/support/knowledgecenter/en/SSAW57_9.0.5/com.ibm.websphere.nd.multiplatform.doc/ae/tprf_monitor_dispatch_requests.html
Configure DPM to send to the MVS console in addition to joblog (replace $addressspace to match):
F $addressspace,msgroute,COPYCONSOLE=BBOJ0118ISet slip trap on the DPM message (note that the column in the message ID is required). Replace
$jobnameto match and end with an*to capture controller and servants:SLIP SET,MSGID=BBOJ0118I:,A=SVCD,JOBNAME=$jobname*,MATCHLIM=1, JOBLIST=($jobname), SDATA=(ALLNUC,CSA,GRSQ,LPA,LSQA,PSA,RGN,SQA,SUM,SWA,TRT),ENDAfter a slip is triggered, it will be removed.
After dumps are captured, reset COPYCONSOLE (replace
$addressspaceto match):F $addressspace,msgroute,COPYCONSOLE,resetUpload console dumps, job logs, and verbosegc*log for the servants from HFS/ZFS
TCP Packet Trace
Capture packet trace to/from IP 10.20.30.1:30037
V TCPIP,NCDTCP,PKT,ON,FULL,IP=10.20.30.1,PORTNUM=30037TCP Connect Timeout
On z/OS, WAS defaults the listenBacklog to 10
rather than 511. WAS on z/OS also uses accept_and_recv
as an optimization. If there is significant load or there are delays
greater than 7 seconds between many concurrent clients establishing a
connection and sending their first requests, then the listen backlog can
fill up and cause connect timeout errors for new connections. Therefore,
it's generally recommended to increase
listenBacklog to at least 100. The
listenBacklog option is preferred rather than the
deprecated options protocol_http_backlog,
protocol_https_backlog, protocol_iiop_backlog,
and protocol_iiop_backlog_ssl.
The netstat -A SERVER
OMVS/USS command shows all connections in the listen state. The
following command shows each connection's maximum backlog and number of
connections dropped:
netstat -A SERVER | awk '$2 == "Name:" { name=$3; } $1 == "Local" {ipport=$3;} $3 == "ConnectionsDropped:" { dropped=$4;} $1 == "MaximumBacklog:" { maxbacklog=$2; print name " " ipport " " maxbacklog " " dropped;}'IBM Z IntelliMagic Vision for z/OS
To gather detailed IntelliMagic reports for WAS traditional on z/OS:
- Click Reports } WebSphere } WebSphere Traditional } Transactions
- At the top, click Selection and choose the relevant time period of interest
- At the top, click Export
- For "Item to export," select "Focal point: WebSphere Traditional"
- Select PDF and click Export
- Wait for the "Export Ready" green popup at the bottom right and then click Download
- Perform the same steps as above (including changing to the Focal point) but this time choose CSV instead of PDF